

Consumer Insights
Uncover trends and behaviors shaping consumer choices today
Procurement Insights
Optimize your sourcing strategy with key market data
Industry Stats
Stay ahead with the latest trends and market analysis.
The global sebacic acid market reached a value of about USD 294.89 Million in 2025. The market is further expected to grow at a CAGR of 3.00% in the forecast period of 2026-2035 to reach a value of approximately USD 396.31 Million by 2035.
Compound Annual Growth Rate
3%
Value in USD Million
2026-2035
Read more about this report - REQUEST FREE SAMPLE COPY IN PDF
Based on application, the plasticisers segment accounts for a significant share in the sebacic acid industry. This can be attributed to the globally increasing usage of polymers and plastics, which, in turn, is fuelling the growth of the sebacic acid industry. Moreover, in contrast to phthalate plasticisers, these sebacate plasticisers possess improved low-temperature properties. As a result, shifting focus towards the development and use of bio-based polymers in order to minimise negative environmental impact is expected to drive the consumer demand in the forecast period.
Region-wise, North America is expected to witness a robust growth over the forecast period. The market growth in North America can be attributed to the rising living standards of consumers, which has resulted in increased cosmetics spending. This is accompanied by the involvement of a variety of multinational companies engaged in the manufacturing of high-end beauty products in the United States. Moreover, sebacic acid is used as a chemical intermediate in the production of esters, which are used as solvents, emollients, masking agents, film forming agents, and conditioning agents, hence, further driving the growth of the regional market.
Read more about this report - REQUEST FREE SAMPLE COPY IN PDF
Sebacic acid is a powdered crystal or white flake derived from castor oil using sulphuric acid via catalysts like phenol, zinc oxide, and sodium hydroxide. Lubricants, plasticisers, hydraulic fluids, candles, and cosmetics are a few of the industries that use sebacic acid.
Based on source, the industry can be segmented into:
By application, the market is divided into:
The market is divided based on end use into:
The regional markets for the product include:


Read more about this report - REQUEST FREE SAMPLE COPY IN PDF
Sebacic acid is commonly used in the automotive and aerospace industries because of its excellent lubricity, low temperature fluidity, high flash points, and high thermal stability. Moreover, the growing consumer preference for bio-lubricants over traditional lubricants owing to the growing focus on reducing CO2 emissions and strict environmental policies is anticipated to drive the demand growth for sebacic acid. Furthermore, at high altitudes, sebacic acid is used as an ingredient in low temperature lubricants. In addition, growing investments in the automotive industry to produce high-performance fuel-efficient vehicles, coupled with the increased consumer spending, is projected to further propel the product demand. All these factors are driving the growth of the market.
Over the forecast period, the rapidly growing automotive and aerospace industries are expected to further stimulate the growth of the market.
The report gives a detailed analysis of the following key players in the global sebacic acid market, covering their competitive landscape, capacity, and latest developments like mergers, acquisitions, and investments, expansions of capacity, and plant turnarounds:
The comprehensive EMR report provides an in-depth assessment of the market based on the Porter's five forces model along with giving a SWOT analysis.
Upto 15% Off
USD
$2499 $2249
$3999 $3599
$4999 $4249
$5999 $5099


*While we strive to always give you current and accurate information, the numbers depicted on the website are indicative and may differ from the actual numbers in the main report. At Expert Market Research, we aim to bring you the latest insights and trends in the market. Using our analyses and forecasts, stakeholders can understand the market dynamics, navigate challenges, and capitalize on opportunities to make data-driven strategic decisions.*
In 2025, the global sebacic acid market attained a value of nearly USD 294.89 Million.
The market is projected to grow at a CAGR of 3.00% between 2026 and 2035.
The market is estimated to witness a healthy growth in the forecast period of 2026-2035 to reach USD 396.31 Million by 2035.
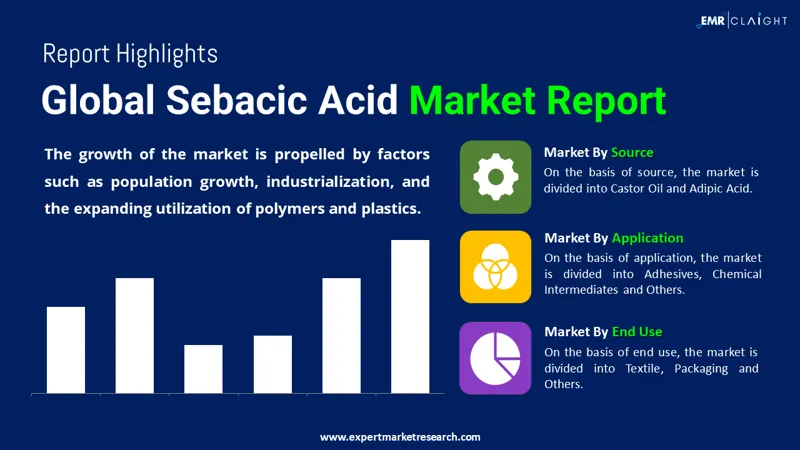
The major market drivers are rising population, rising industrialisation, and the increasing usage of polymers and plastics.
The rising use of sebacic acid in the automotive and aerospace sectors and the growing consumer preference for bio-lubricants over traditional lubricants are the key trends supporting the market growth.
The major regions in the market are North America, Latin America, the Middle East and Africa, Europe, and the Asia Pacific.
The major segments based on sources of sebacic acid considered in the market report are castor oil and adipic oil.
The various applications of sebacic acid are plasticisers, lubricants, solvents, adhesives, and chemical intermediates, among others.
The significant end uses of sebacic acid are automotive, aerospace, textile, and packaging, among others.
The major players in the market are Arkema Group, Hokoku Co., Ltd., Shipra Agrichem Pvt Ltd (SAPL), BASF SE, Wilmar International Ltd, and Sebacic India Limited, among others.
Explore our key highlights of the report and gain a concise overview of key findings, trends, and actionable insights that will empower your strategic decisions.
| REPORT FEATURES | DETAILS |
| Base Year | 2025 |
| Historical Period | 2019-2025 |
| Forecast Period | 2026-2035 |
| Scope of the Report |
Historical and Forecast Trends, Industry Drivers and Constraints, Historical and Forecast Market Analysis by Segment:
|
| Breakup by Source |
|
| Breakup by Application |
|
| Breakup by End Use |
|
| Breakup by Region |
|
| Market Dynamics |
|
| Competitive Landscape |
|
| Companies Covered |
|
| Report Price and Purchase Option | Explore our purchase options that are best suited to your resources and industry needs. |
| Delivery Format | Delivered as an attached PDF and Excel through email, with an option of receiving an editable PPT, according to the purchase option. |
Datasheet
One User
USD 2,499
USD 2,249
tax inclusive*
Single User License
One User
USD 3,999
USD 3,599
tax inclusive*
Five User License
Five User
USD 4,999
USD 4,249
tax inclusive*
Corporate License
Unlimited Users
USD 5,999
USD 5,099
tax inclusive*
*Please note that the prices mentioned below are starting prices for each bundle type. Kindly contact our team for further details.*
Flash Bundle
Small Business Bundle
Growth Bundle
Enterprise Bundle
*Please note that the prices mentioned below are starting prices for each bundle type. Kindly contact our team for further details.*
Flash Bundle
Number of Reports: 3
20%
tax inclusive*
Small Business Bundle
Number of Reports: 5
25%
tax inclusive*
Growth Bundle
Number of Reports: 8
30%
tax inclusive*
Enterprise Bundle
Number of Reports: 10
35%
tax inclusive*
How To Order

Select License Type
Choose the right license for your needs and access rights.

Click on ‘Buy Now’
Add the report to your cart with one click and proceed to register.

Select Mode of Payment
Choose a payment option for a secure checkout. You will be redirected accordingly.
Strategic Solutions for Informed Decision-Making
Gain insights to stay ahead and seize opportunities.

Get insights & trends for a competitive edge.

Track prices with detailed trend reports.

Analyse trade data for supply chain insights.

Leverage cost reports for smart savings

Enhance supply chain with partnerships.

Connect For More Information
Our expert team of analysts will offer full support and resolve any queries regarding the report, before and after the purchase.
Our expert team of analysts will offer full support and resolve any queries regarding the report, before and after the purchase.
We employ meticulous research methods, blending advanced analytics and expert insights to deliver accurate, actionable industry intelligence, staying ahead of competitors.
Our skilled analysts offer unparalleled competitive advantage with detailed insights on current and emerging markets, ensuring your strategic edge.
We offer an in-depth yet simplified presentation of industry insights and analysis to meet your specific requirements effectively.


