

Consumer Insights
Uncover trends and behaviors shaping consumer choices today
Procurement Insights
Optimize your sourcing strategy with key market data
Industry Stats
Stay ahead with the latest trends and market analysis.
The global smart labels market size reached a value of USD 11.71 Billion in 2025. The market is further expected to grow at a CAGR of 12.50% in the forecast period of 2026-2035 to reach a value of approximately USD 38.03 Billion by 2035.
Compound Annual Growth Rate
12.5%
Value in USD Billion
2026-2035
| Global Smart Labels Market Report Summary | Description | Value |
| Base Year | USD Billion | 2025 |
| Historical Period | USD Billion | 2019-2025 |
| Forecast Period | USD Billion | 2026-2035 |
| Market Size 2025 | USD Billion | 11.71 |
| Market Size 2035 | USD Billion | 38.03 |
| CAGR 2019-2025 | Percentage | XX% |
| CAGR 2026-2035 | Percentage | 12.50% |
| CAGR 2026-2035 - Market by Region | Asia Pacific | 14.4% |
| CAGR 2026-2035 - Market by Country | India | 16.5% |
| CAGR 2026-2035 - Market by Country | China | 13.8% |
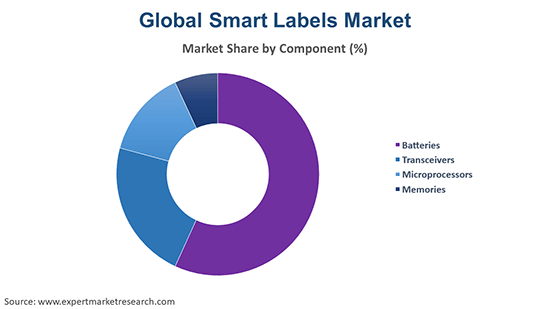
| CAGR 2026-2035 - Market by Component | Microprocessors | 13.6% |
| CAGR 2026-2035 - Market by End Use | Retail | 14.3% |
| Market Share by Country 2025 | Japan | 4.2% |
North America is the world's largest smart labels market, with the United States accounting for the largest share in the region. The massive market in the region can be attributed to the significant presence of retail stores, both small and large. The country was led by retail giants, like Walmart and others, which contributed to an upsurge in operations, primarily leading to the development of the smart label industry. Walmart has put electronic identification tags on men's apparel, including jeans, as the world's largest retailer is seeking to maintain greater control of its inventory.


Smart labels work as an innovative label that allows anyone to track product information through their smart devices. These smart labels not just provide information on the product as well as the ingredients used in it, but also provide information on the manufacturer, date of manufacture, and other crucial information. Smart labels are currently used by different industries, like manufacturing, healthcare, automotive, food and beverage, retail, security, FMCG, and others. These smart labels also offer a smart traceability of the product and help to maintain its authenticity.
On the basis of technology, the smart labels market can be divided into:
Based on the component, the industry can be divided into:
The end-use sectors of the product can be segmented as follows:
Based on the region, the industry can be divided into:
Read more about this report - REQUEST FREE SAMPLE COPY IN PDF
| CAGR 2026-2035 - Market by | Country |
| India | 16.5% |
| China | 13.8% |
| UK | 11.4% |
| USA | 11.1% |
| Italy | 8.8% |
| Canada | XX% |
| Germany | XX% |
| France | XX% |
| Japan | 8.6% |
| Australia | XX% |
| Saudi Arabia | XX% |
| Brazil | XX% |
| Mexico | XX% |
The applicability of smart labels in a broad range of vertical sectors is among the key factors boosting the smart labels market development. In the healthcare industry, these labels help to track the use and storage of medications and to regulate the inventory. They are also used in assisted living facilities to monitor the position of patients, their body temperature, and the dampness of dressings or diapers. In addition, these labels provide improved and managed inventory management for the efficient monitoring of products by maintaining the credibility of the supply chain in the logistics industry. In addition, the demand for smart labels among e-commerce companies has been boosted to reduce the reliance on handheld scanners to collect product information, improve time productivity, and reduce training and labour costs. Smart labels containing built-in alarms are useful for preventing robberies and shoplifting incidents. In addition, with the introduction of Internet of Things (IoT) technology, many companies are developing sensors that can be printed on smart labels at a lower cost compared to silicone sensors. These factors are expected to propel the growth of the smart labels market in the coming years.
The report gives a detailed analysis of the following key players in the global smart labels market, covering their competitive landscape, capacity, and latest developments like mergers, acquisitions, and investments, expansions of capacity, and plant turnarounds:
The comprehensive EMR report provides an in-depth assessment of the market based on the Porter's five forces model along with giving a SWOT analysis.
Upto 15% Off
USD
$2499 $2249
$3999 $3599
$4999 $4249
$5999 $5099


*While we strive to always give you current and accurate information, the numbers depicted on the website are indicative and may differ from the actual numbers in the main report. At Expert Market Research, we aim to bring you the latest insights and trends in the market. Using our analyses and forecasts, stakeholders can understand the market dynamics, navigate challenges, and capitalize on opportunities to make data-driven strategic decisions.*
In 2025, the global smart labels market attained a value of USD 11.71 Billion.
The market is expected to grow at a CAGR of 12.50% between 2026 and 2035.
The market is estimated to witness a healthy growth in the forecast period of 2026-2035 to reach around USD 38.03 Billion by 2035.
The major drivers of the market are growing adoption of smart labels by healthcare and ecommerce industries, and rising disposable incomes.
The adoption of Internet of Things (IoT) technology and introduction of smart labels with built-in alarms to prevent shoplifting and robbery are the key trends guiding the growth of the market.
The major regions in the market are North America, Europe, the Asia Pacific, Latin America, and the Middle East and Africa.
The leading technologies in the market are radio-frequency identification (RFID), electronic article surveillance (EAS), electronic shelf label (ESL), sensing labels, and near field communication (NFC), among others.
The significant components of smart labels in the market are batteries, transceivers, microprocessors, and memories.
Retail, logistics and transportation, healthcare, food and beverage, aerospace, and data centres and libraries, among others, are the major end uses in the market.
The leading players in the global smart labels market are Avery Dennison Corporation, CCL Industries Inc., Smartrac Technology GmbH, Mühlbauer Group, Checkpoint Systems, Inc, and Zebra Technologies Corp, among others.
Explore our key highlights of the report and gain a concise overview of key findings, trends, and actionable insights that will empower your strategic decisions.
| REPORT FEATURES | DETAILS |
| Base Year | 2025 |
| Historical Period | 2019-2025 |
| Forecast Period | 2026-2035 |
| Scope of the Report |
Historical and Forecast Trends, Industry Drivers and Constraints, Historical and Forecast Market Analysis by Segment:
|
| Breakup by Technology |
|
| Breakup by Component |
|
| Breakup by End Use |
|
| Breakup by Region |
|
| Market Dynamics |
|
| Competitive Landscape |
|
| Companies Covered |
|
| Report Price and Purchase Option | Explore our purchase options that are best suited to your resources and industry needs. |
| Delivery Format | Delivered as an attached PDF and Excel through email, with an option of receiving an editable PPT, according to the purchase option. |
Datasheet
One User
USD 2,499
USD 2,249
tax inclusive*
Single User License
One User
USD 3,999
USD 3,599
tax inclusive*
Five User License
Five User
USD 4,999
USD 4,249
tax inclusive*
Corporate License
Unlimited Users
USD 5,999
USD 5,099
tax inclusive*
*Please note that the prices mentioned below are starting prices for each bundle type. Kindly contact our team for further details.*
Flash Bundle
Small Business Bundle
Growth Bundle
Enterprise Bundle
*Please note that the prices mentioned below are starting prices for each bundle type. Kindly contact our team for further details.*
Flash Bundle
Number of Reports: 3
20%
tax inclusive*
Small Business Bundle
Number of Reports: 5
25%
tax inclusive*
Growth Bundle
Number of Reports: 8
30%
tax inclusive*
Enterprise Bundle
Number of Reports: 10
35%
tax inclusive*
How To Order

Select License Type
Choose the right license for your needs and access rights.

Click on ‘Buy Now’
Add the report to your cart with one click and proceed to register.

Select Mode of Payment
Choose a payment option for a secure checkout. You will be redirected accordingly.
Strategic Solutions for Informed Decision-Making
Gain insights to stay ahead and seize opportunities.

Get insights & trends for a competitive edge.

Track prices with detailed trend reports.

Analyse trade data for supply chain insights.

Leverage cost reports for smart savings

Enhance supply chain with partnerships.

Connect For More Information
Our expert team of analysts will offer full support and resolve any queries regarding the report, before and after the purchase.
Our expert team of analysts will offer full support and resolve any queries regarding the report, before and after the purchase.
We employ meticulous research methods, blending advanced analytics and expert insights to deliver accurate, actionable industry intelligence, staying ahead of competitors.
Our skilled analysts offer unparalleled competitive advantage with detailed insights on current and emerging markets, ensuring your strategic edge.
We offer an in-depth yet simplified presentation of industry insights and analysis to meet your specific requirements effectively.


