

Consumer Insights
Uncover trends and behaviors shaping consumer choices today
Procurement Insights
Optimize your sourcing strategy with key market data
Industry Stats
Stay ahead with the latest trends and market analysis.
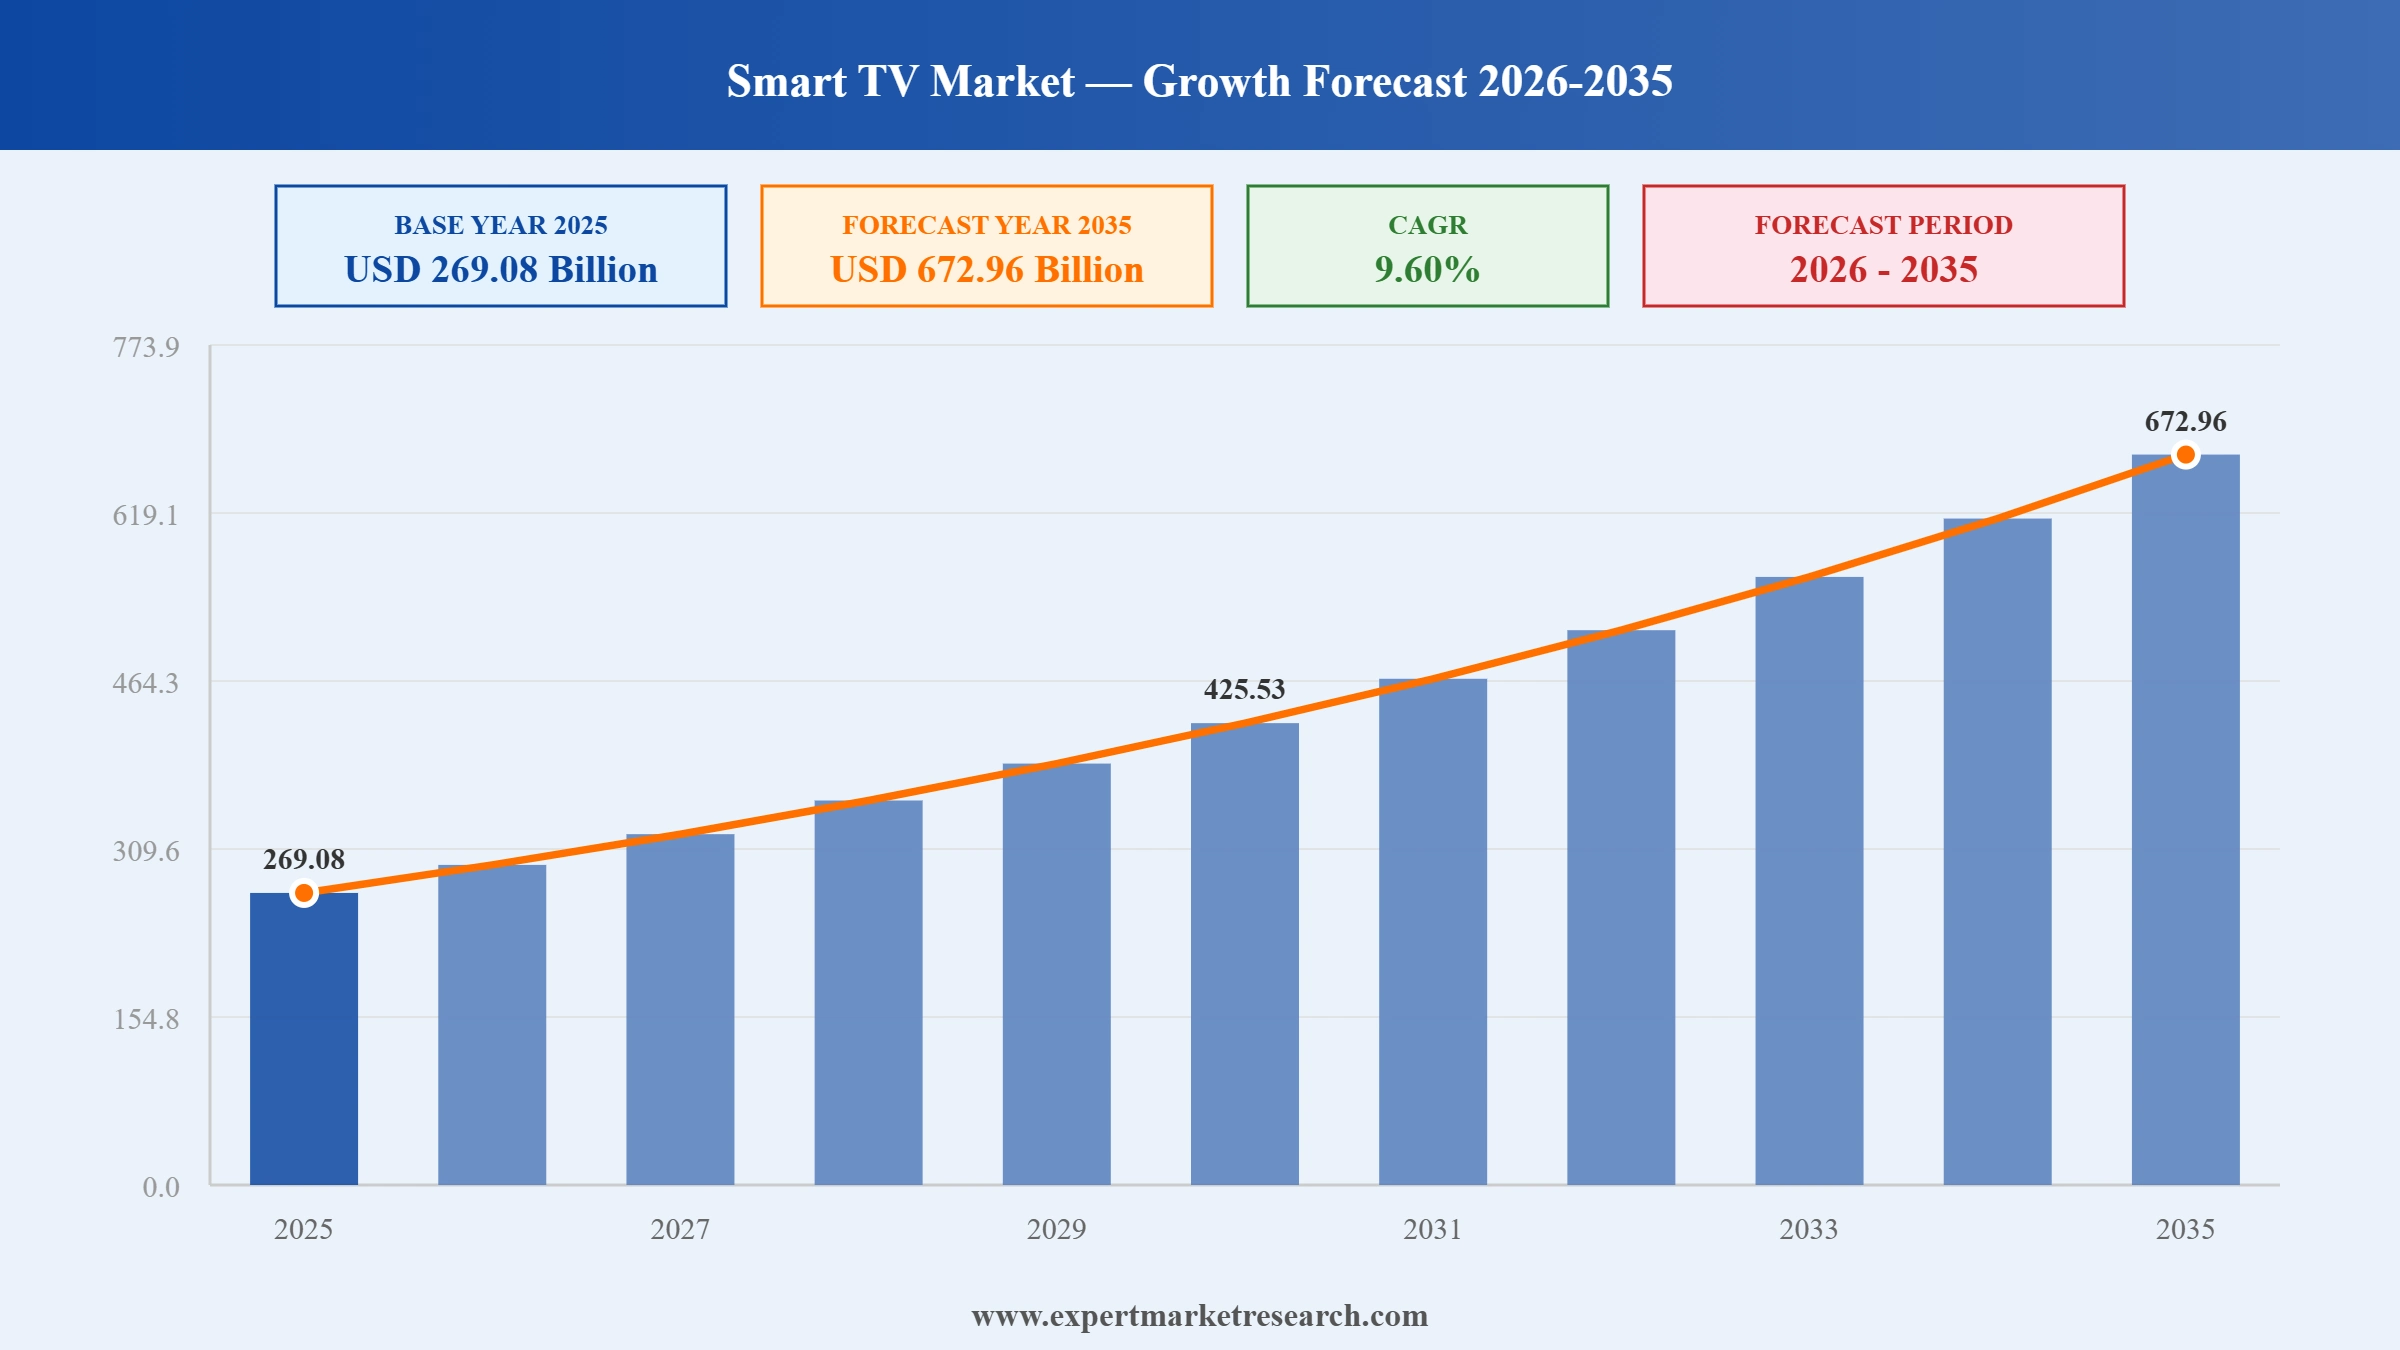
The global smart TV market reached a value of USD 269.08 Billion at 2025 and is projected to expand at a CAGR of around 9.60% during the forecast period of 2026-2035. With rapid advances in display technologies including OLED, QLED, and Micro RGB, surging OTT content consumption, expanding AI-powered smart features, and rising disposable incomes in emerging markets, the market is expected to reach USD 672.96 Billion by 2035.
Read more about this report - REQUEST FREE SAMPLE COPY IN PDF
The global smart TV market is being shaped by breakthrough display innovations, particularly the emergence of Micro RGB technology, alongside AI-driven personalisation and intensifying competition from value-focused Asian brands. CES 2026 marked a pivotal product cycle, with Samsung, LG, and Sony unveiling display advancements that are redefining picture quality benchmarks across screen sizes.
Samsung expanded its 2026 TV portfolio in March 2026, launching refreshed Neo QLED models and a new Mini LED range. The lineup continues the brand's global leadership in premium display technology, with its Neo QLED line incorporating AI-powered picture processing, reinforcing Samsung's 19 consecutive years of top global TV market share.
Samsung and LG presented their 2026 smart TV lineups at CES 2026 in January, with Micro RGB technology emerging as a centrepiece. Samsung's S95H, S90H, and S85H QD-OLED TVs and LG's Micro RGB evo range attracted strong industry attention for advances in colour accuracy, brightness, and processing performance for home entertainment.
Samsung launched the Movingstyle lineup in November 2025, targeting consumers seeking portable smart TV solutions for on-the-go entertainment. The product line reflects the growing consumer interest in flexible, room-free viewing experiences alongside traditional large-screen home cinema setups, expanding Samsung's smart TV addressable market beyond conventional living room use cases.
Samsung launched the world's first Micro RGB TV in August 2025, marking a significant display innovation breakthrough. Micro RGB backlight technology replaces traditional white LEDs with microscopic red, green, and blue LEDs, delivering superior colour accuracy and brightness compared to conventional Mini LED displays, positioning Samsung at the forefront of next-generation smart TV development.
AI integration is becoming a core differentiator in the global smart TV market, with Samsung's Vision AI and LG's AI ThinQ platforms enabling real-time content upscaling, voice control, and personalised content recommendations. Brands are embedding on-device neural processors that optimise audio and visual output based on room conditions and viewer preferences, raising consumer expectations across premium smart TV categories.
Advances in OLED and quantum dot LED display technologies are accelerating the smart TV market's premiumisation trend. LG's OLED evo W6 wallpaper TV and Samsung's QD-OLED S95H represent the leading edge of consumer display innovation. These technologies offer superior contrast ratios, wider colour gamut, and improved energy efficiency, driving upgrade behaviour among premium consumers in North America, Europe, and developed Asia Pacific markets.
The proliferation of OTT streaming services including Netflix, Amazon Prime Video, Disney Plus, and Apple TV Plus is a foundational driver of smart TV adoption in the global smart TV market. Content accessibility and platform partnerships are key purchase decision factors, with brands competing on app ecosystems, interface responsiveness, and content discovery AI to differentiate their operating systems across consumer segments.
8K TV adoption is accelerating in the premium tier of the global smart TV market, driven by growing 8K content availability and declining 8K panel costs. Samsung's 2026 8K lineup and Sony's True RGB models targeting high-resolution performance are exemplifying industry investment in pushing the resolution frontier. Consumers with large-screen preferences above 65 inches are the primary purchasers of 8K smart TVs globally.
Rising disposable incomes, affordable mid-tier smart TV options from TCL, Hisense, and domestic brands, and expanding broadband connectivity are rapidly improving smart TV household penetration in Asia Pacific and Latin America. The smart TV market in India, Southeast Asia, and Brazil is benefiting from government digitalisation initiatives and rising consumer demand for home entertainment upgrades at accessible price points.
The report of the Expert Market Research's titled "Global Smart TV Market Report and Forecast 2026-2035" offers a detailed analysis of the market based on the following segments:
Market Breakup by Resolution Type
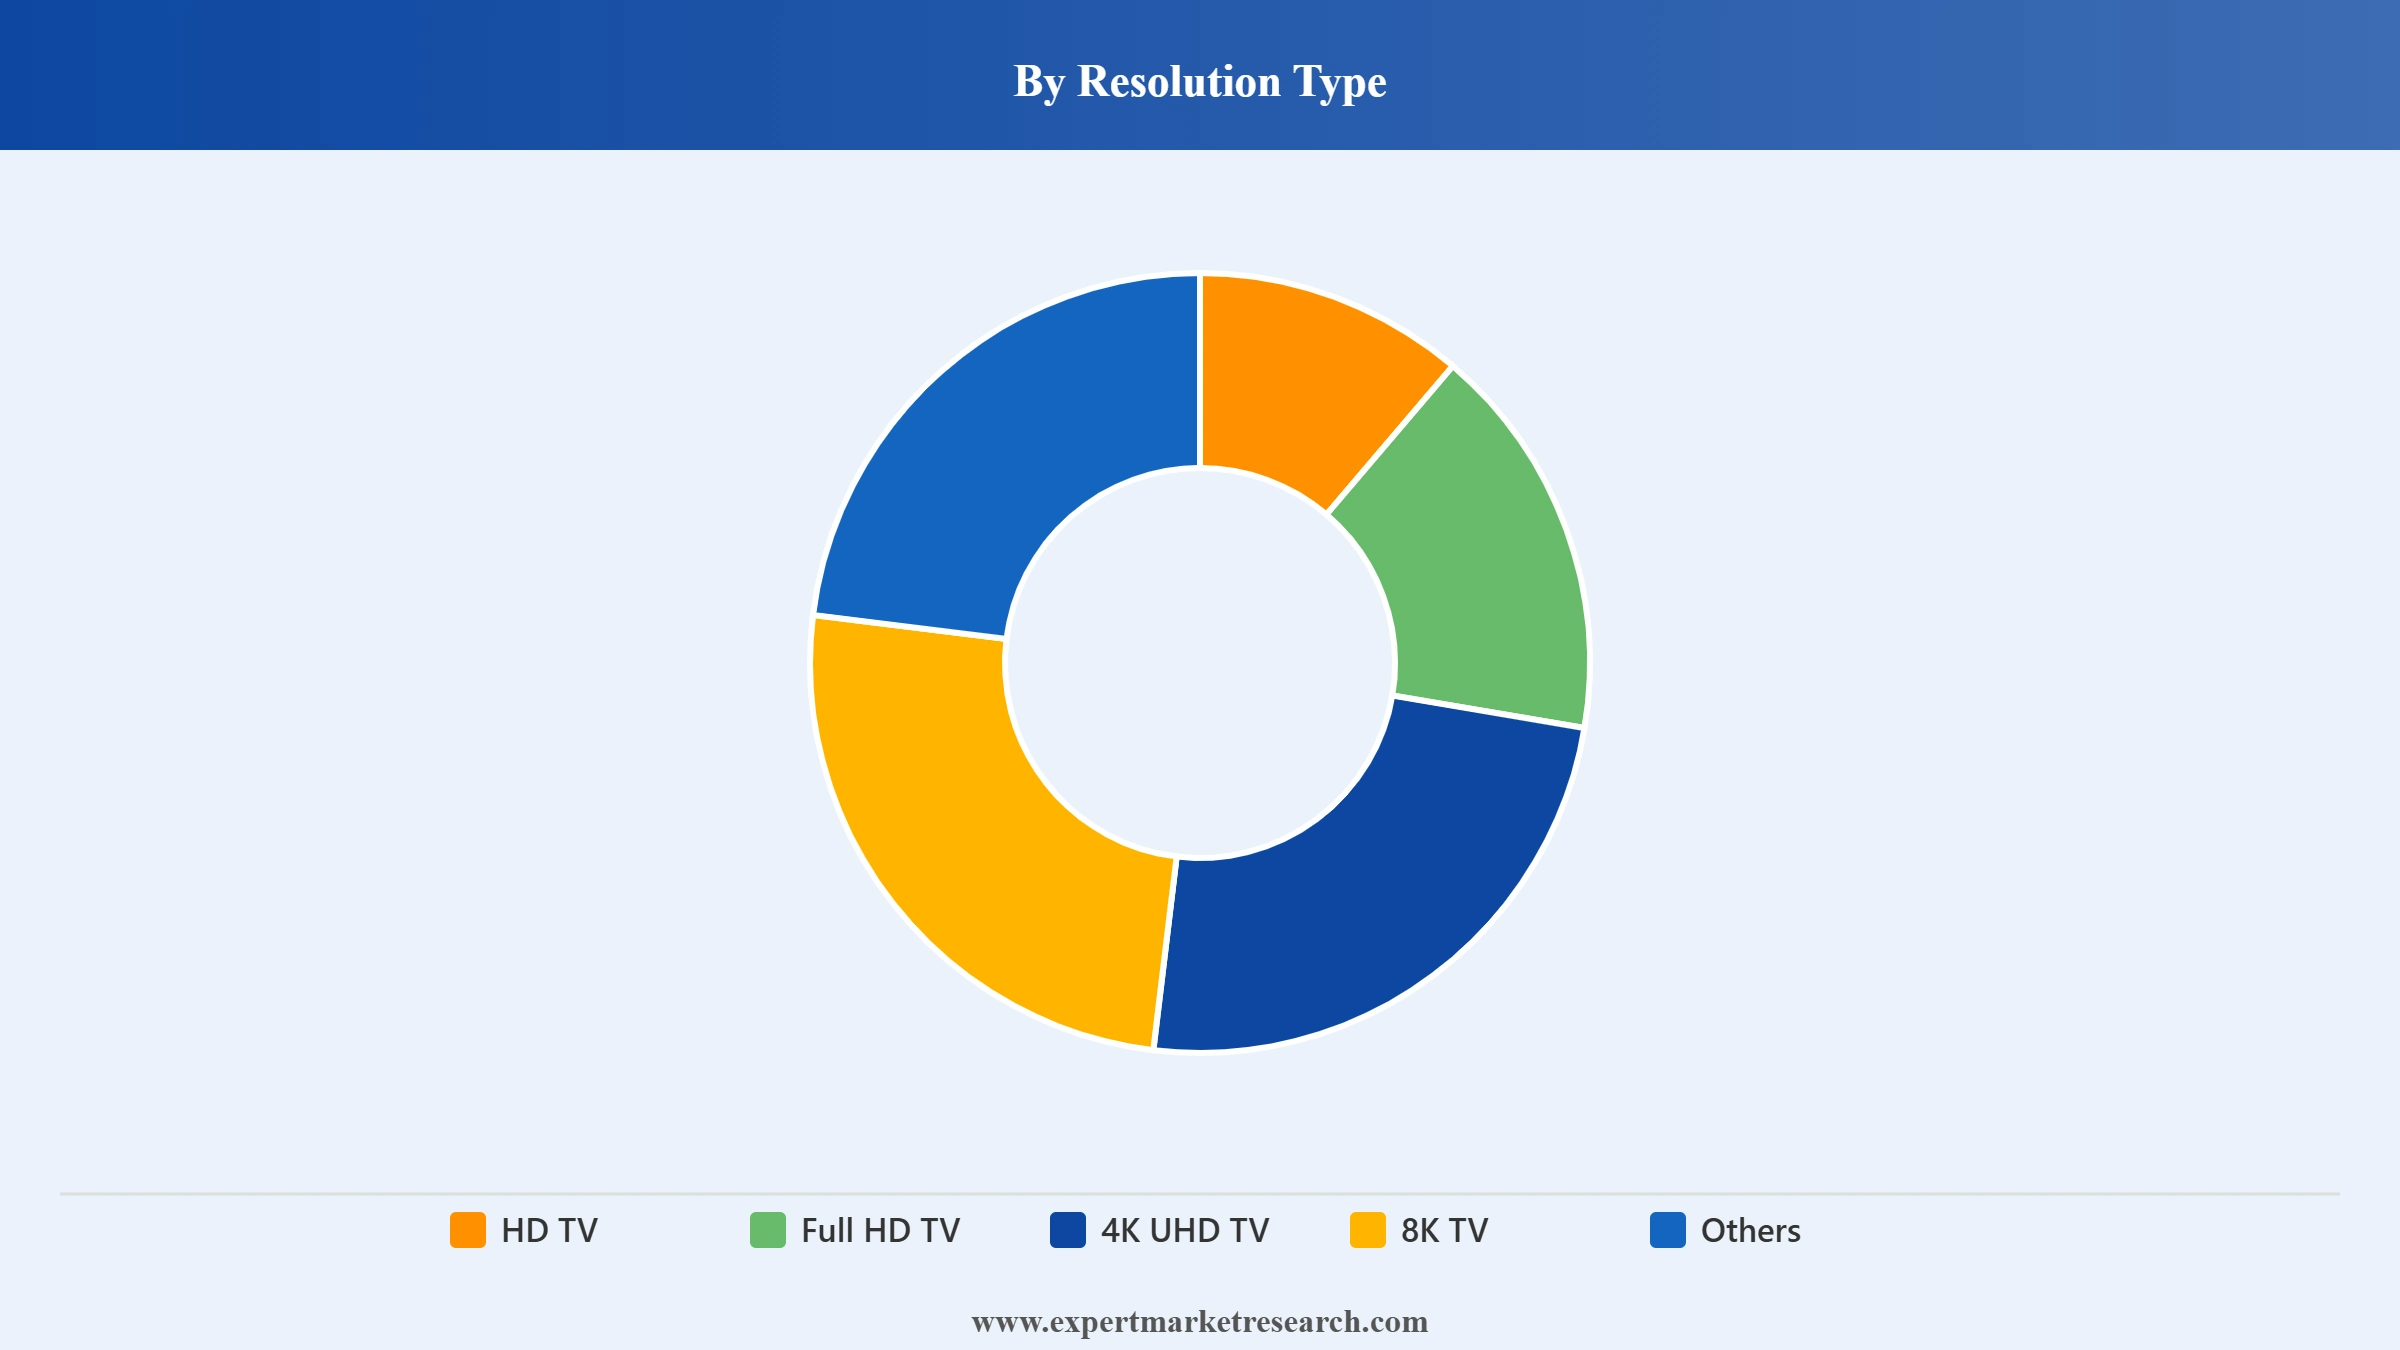
Key Insight: 4K UHD TVs dominate the global smart TV market by resolution, benefiting from widespread content availability on streaming platforms and competitive pricing that has made 4K standard across mid-to-premium segments. Full HD retains volume share in entry-level categories in emerging markets. 8K is the fastest-growing tier, driven by Samsung and Sony's premium 2026 launches and declining 8K panel production costs.
Market Breakup by Screen Size
Key Insight: The 46 to 55-inch screen size dominates the global smart TV market, representing the sweet spot between display impact and living room suitability for the majority of consumers globally. Above 65-inch screens are the fastest-growing size category, driven by consumer preferences for cinematic home entertainment. Samsung's 2026 Micro RGB range offering sizes from 55 to 130 inches reflects manufacturers' commitment to serving this premium large-screen segment.
Market Breakup by Screen Type
Key Insight: Flat screen smart TVs dominate the market by screen type, offering versatile wall-mounting options and consistent picture quality across all viewing angles. Curved screens, while aesthetically distinctive, represent a niche premium category with limited mass-market appeal due to their narrower optimal viewing zone. The flat screen segment benefits from consumer preference for clean, modern aesthetics that integrate seamlessly into contemporary home interiors globally.
Market Breakup by Screen Technology
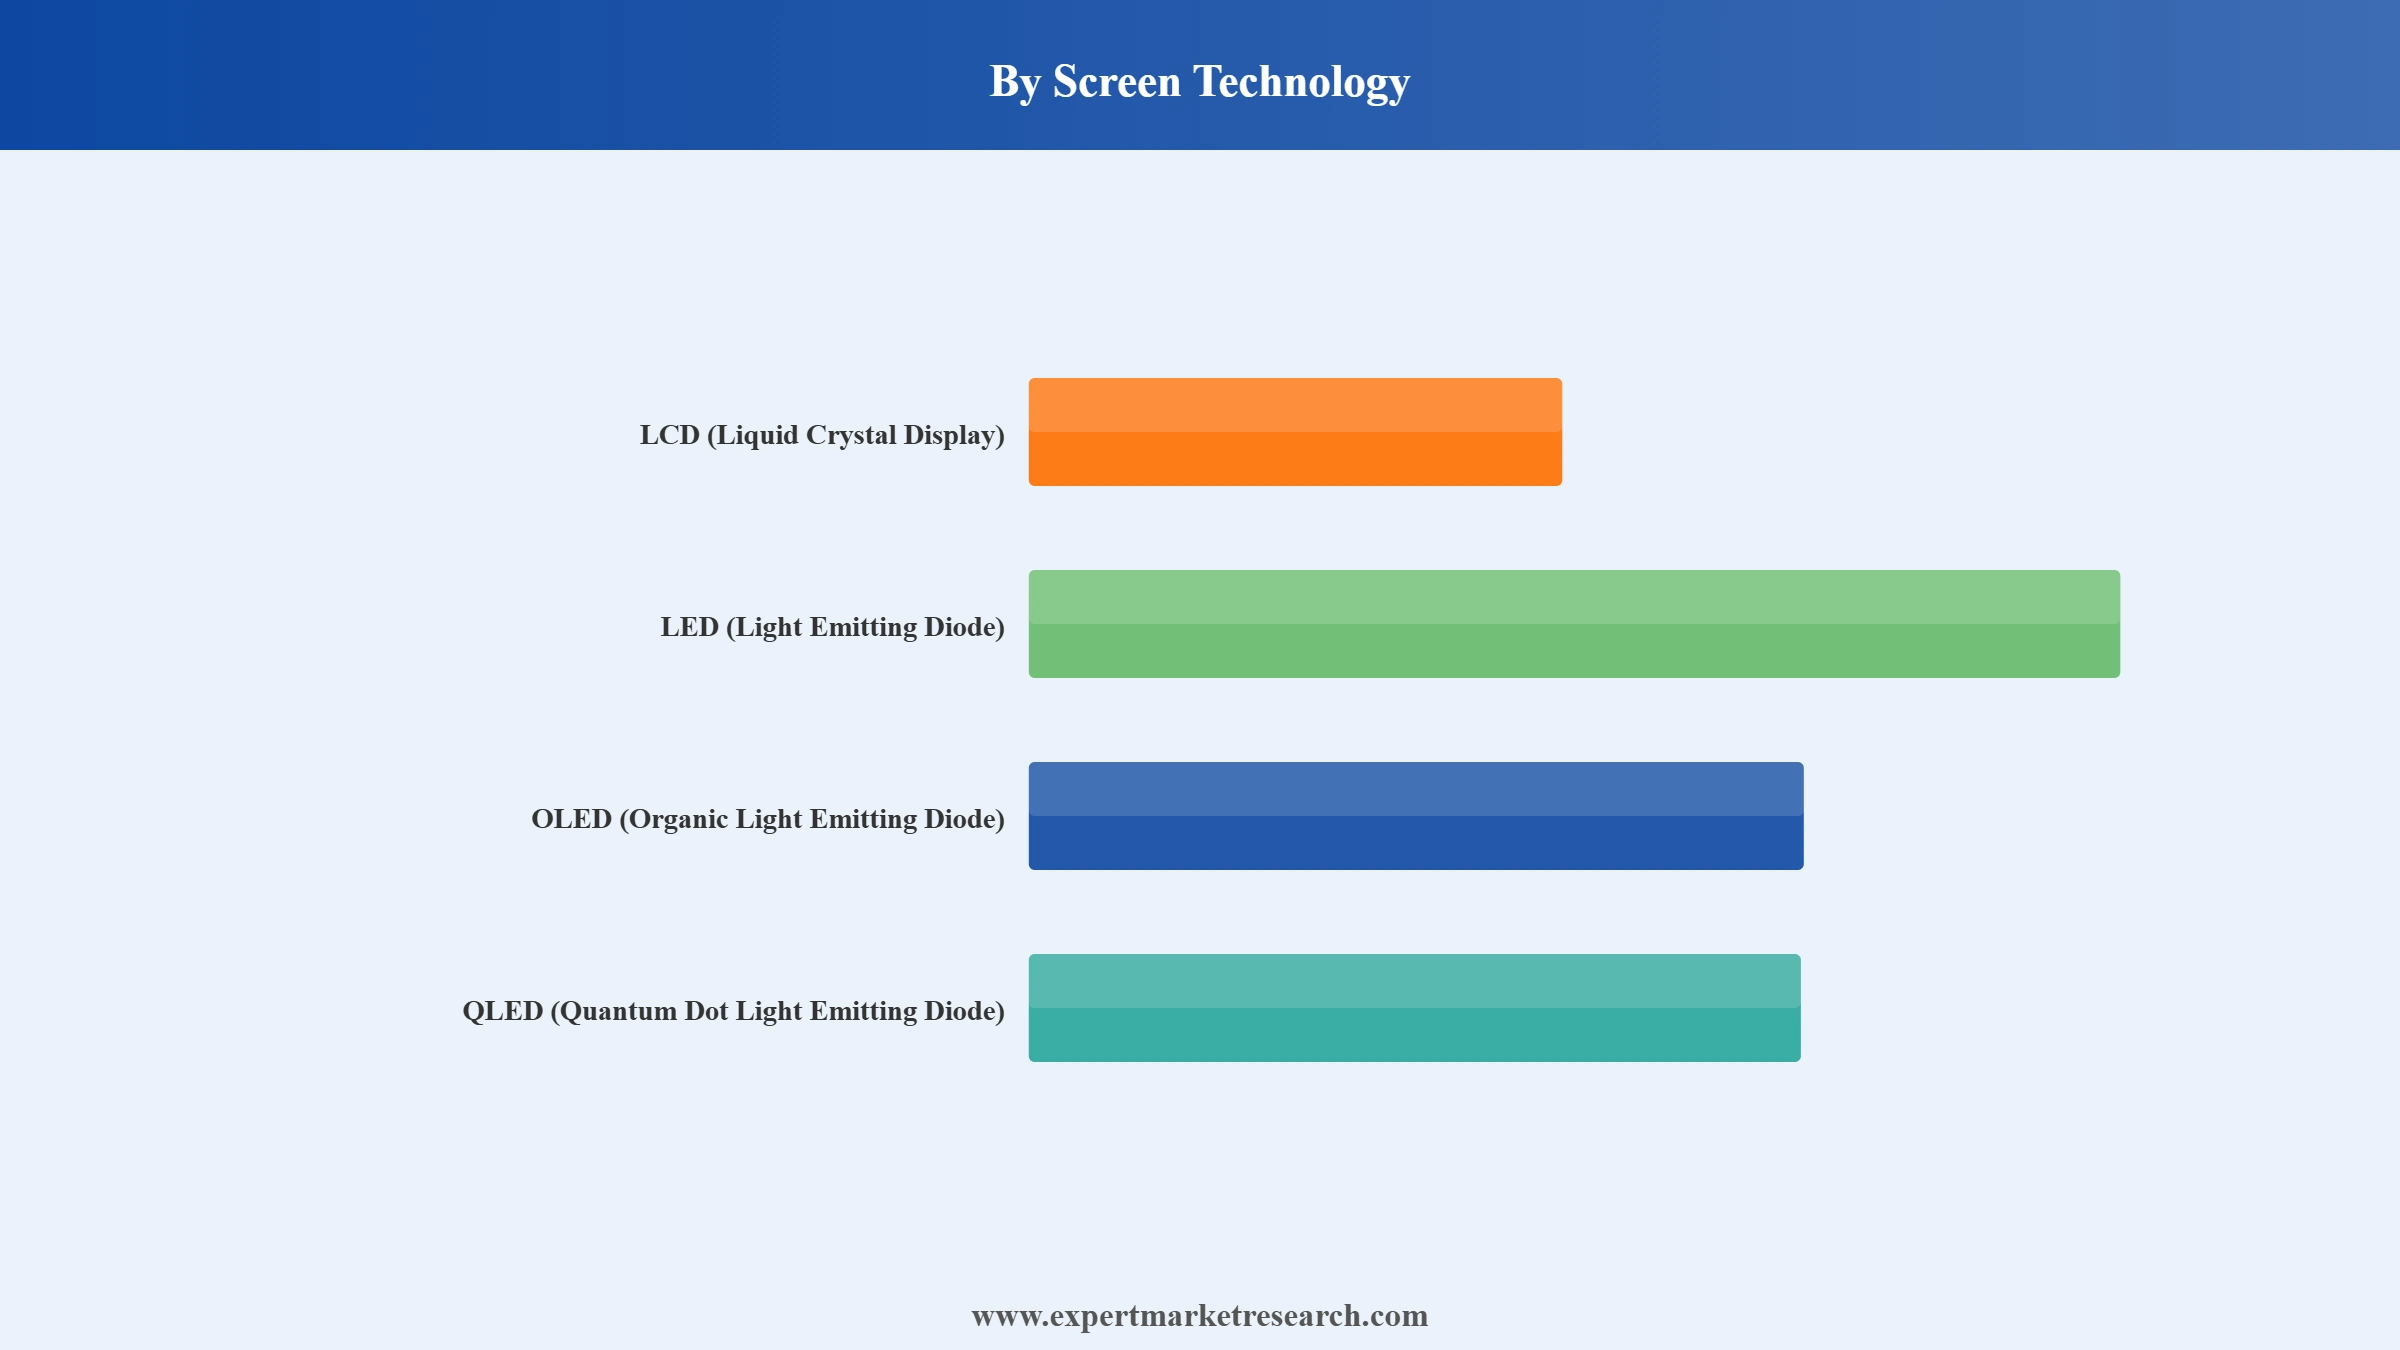
Key Insight: LED remains the largest screen technology segment by volume in the global smart TV market, owing to its cost efficiency, brightness, and broad compatibility across screen sizes. OLED holds the premium position with superior contrast and colour accuracy, led by LG and Sony. QLED is growing rapidly, with Samsung's quantum dot platform gaining share through improvements in colour volume and energy efficiency in the mid-to-premium segment.
Market Breakup by Platform
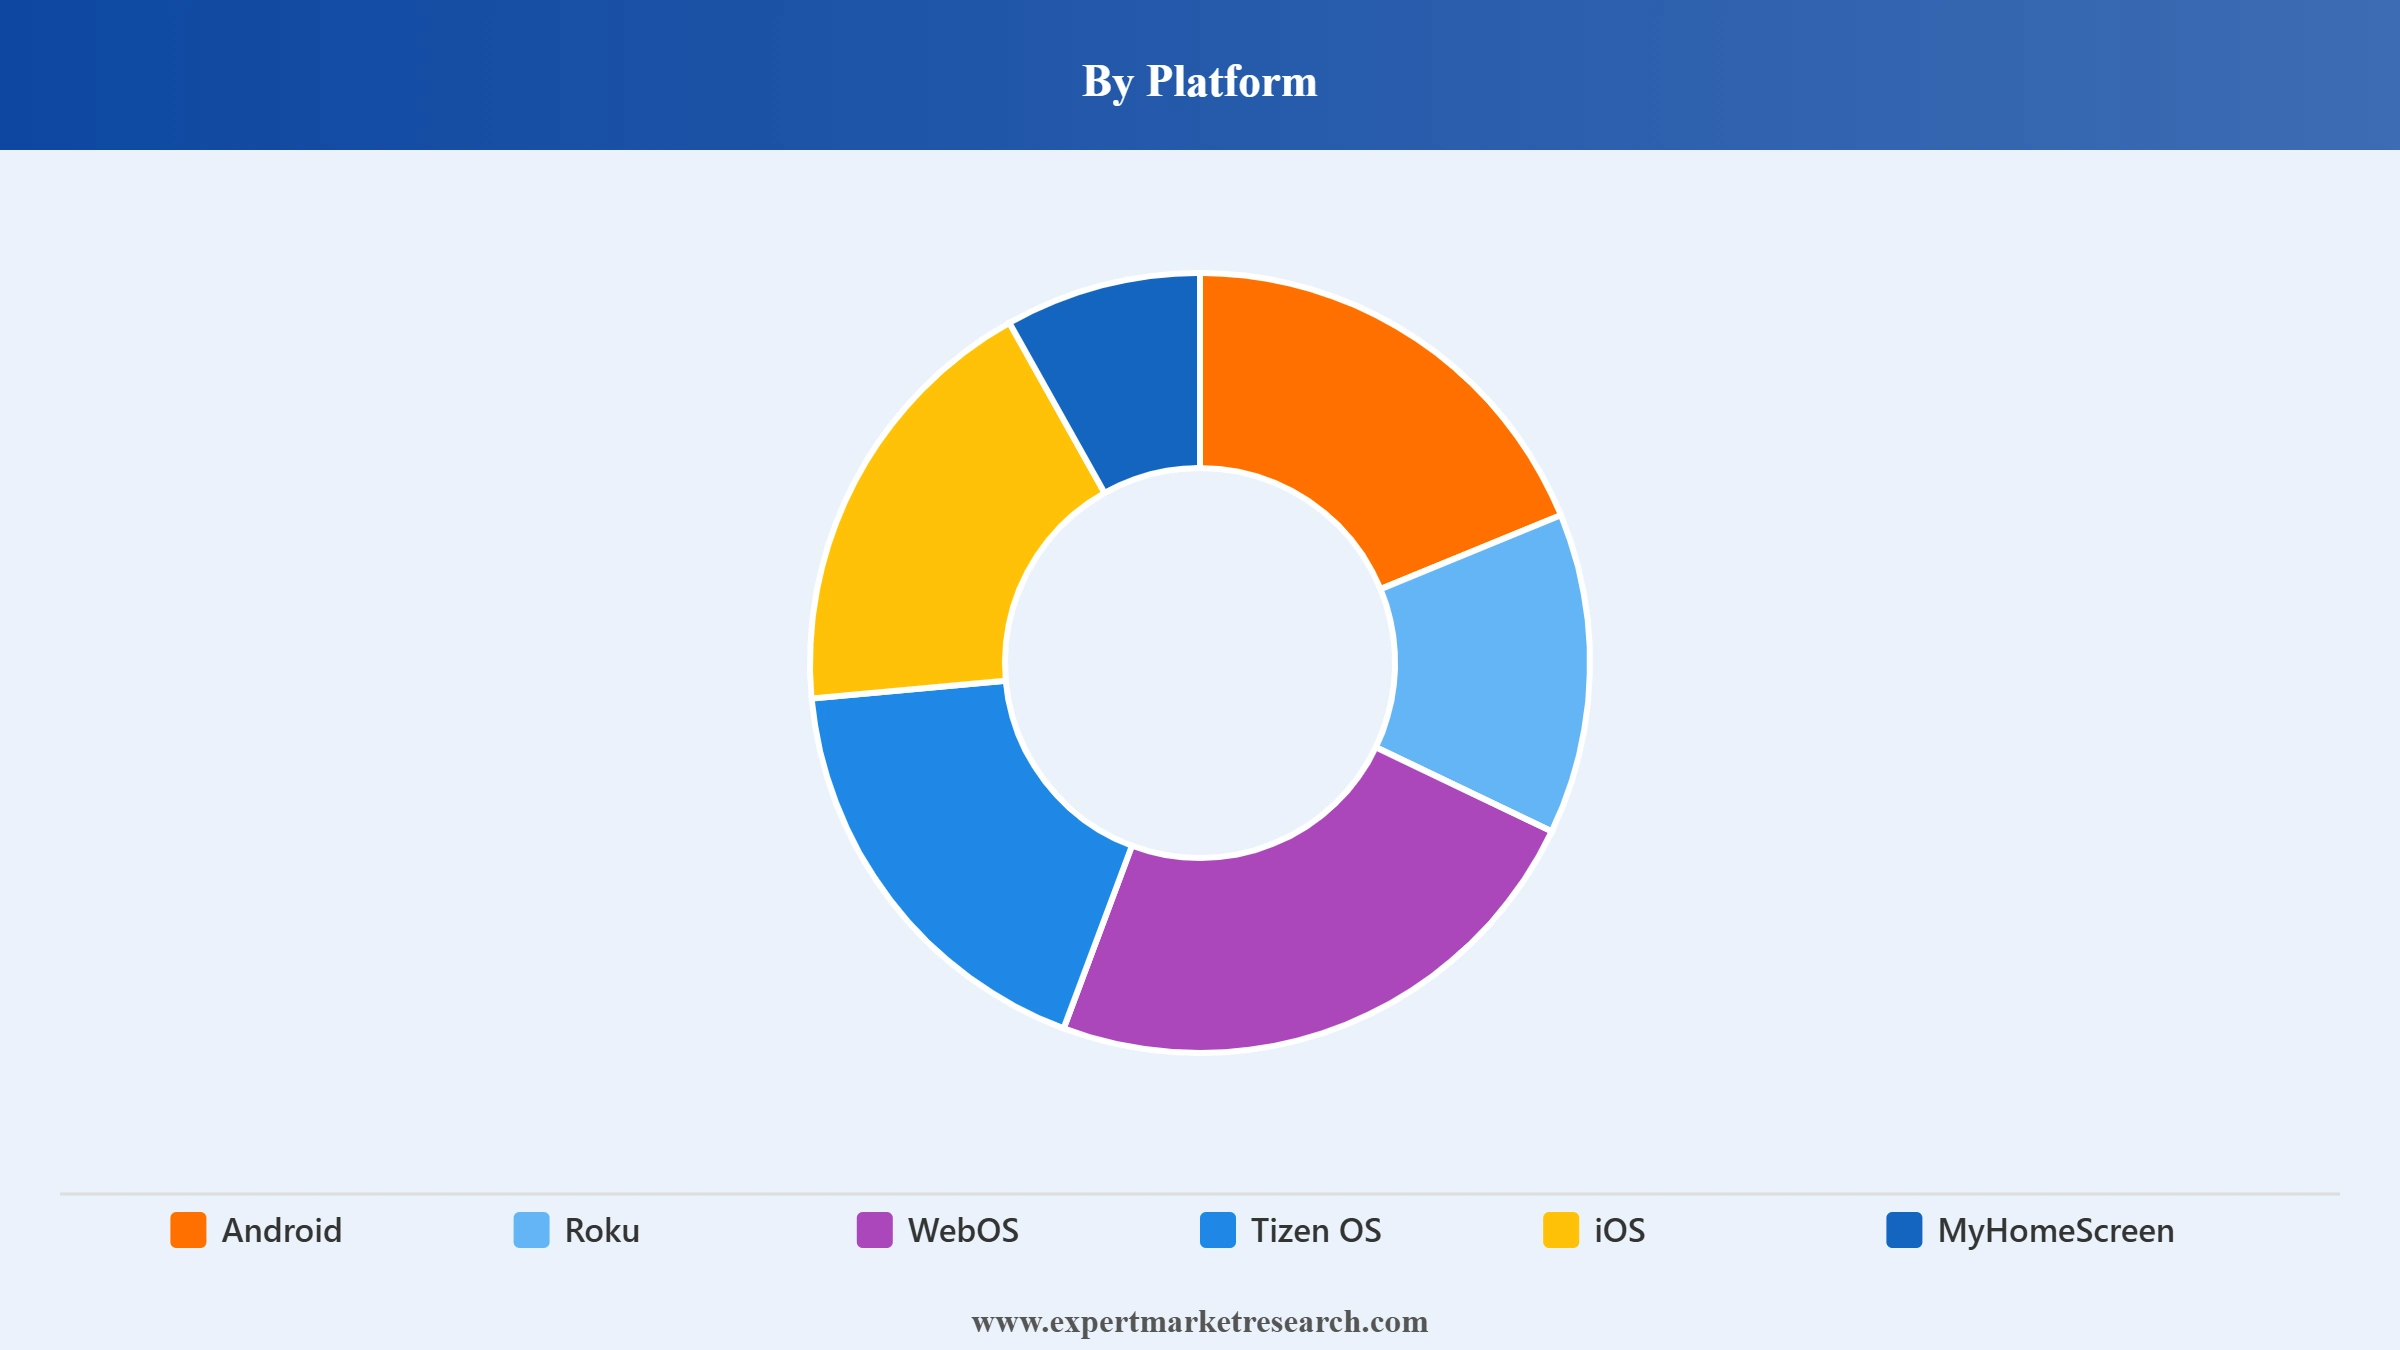
Key Insight: Android TV and Google TV platforms collectively hold the largest share of smart TV operating systems globally, benefiting from the extensive Google Play Store ecosystem and cross-device compatibility. Samsung's Tizen OS and LG's WebOS are strong competitors in the premium segment. Roku OS leads in the US value market, while Apple's iOS-based platform maintains a niche premium position through deep iPhone and Apple ecosystem integration.
Market Breakup by Distribution Channel
Key Insight: Offline distribution channels, including electronics retail chains and department stores, remain dominant for smart TV purchases globally, as consumers prefer in-store display trials for high-ticket items. However, online distribution is growing rapidly, driven by e-commerce expansion and improving consumer confidence in online purchases. Brands are increasingly investing in omnichannel strategies to align retail and digital discovery experiences.
Market Breakup by Application
Key Insight: Residential applications dominate the global smart TV market, as smart TVs are a core household entertainment device for video streaming, gaming, and connected home applications. Commercial applications, including hospitality, retail, and digital signage, represent a growing secondary segment. Hotels, restaurants, and retail environments are increasingly investing in smart TV deployments to enhance customer experiences and enable remote content management capabilities.
Market Breakup by Region
Key Insight: North America is the leading revenue region in the global smart TV market, driven by high household incomes and early technology adoption. Asia Pacific is the largest volume market and fastest-growing region, led by China, India, and ASEAN. Europe holds a substantial share supported by strong premium brand demand. Latin America and the Middle East and Africa are growing markets with improving penetration rates.


Read more about this report - REQUEST FREE SAMPLE COPY IN PDF
By Resolution Type, 4K UHD TV dominates the market due to widespread content availability and competitive pricing accessibility
4K UHD TVs represent the dominant resolution category in the global smart TV market, having achieved broad consumer acceptance through widespread content availability on Netflix, Amazon Prime Video, and YouTube at 4K resolution. Competitive pricing driven by panel supply chain efficiencies has made 4K the standard resolution for the mid-premium segment globally. Leading brands including Samsung, LG, Sony, and TCL offer broad 4K portfolios across screen sizes from 43 to 85 inches, sustaining category dominance.
Read more about this report - REQUEST FREE SAMPLE COPY IN PDF
8K TV is the fastest-growing resolution tier, reflecting consumer appetite for next-generation display quality as panel costs decline and 8K content availability improves. Samsung's 2026 Micro RGB and QD-OLED ranges in 8K resolution and Sony's planned True RGB TV lineup are driving the category's premium positioning. Full HD TV retains meaningful volume share in entry-level and affordable segments, particularly in emerging markets across Asia Pacific and Latin America.
By Screen Technology, LED accounts for the dominant share of the market due to cost efficiency and broad screen-size compatibility
LED screen technology commands the largest share of the global smart TV market by technology, underpinned by its superior energy efficiency, competitive pricing across screen sizes, and the broad availability of LED panels from Asian manufacturers. Mini LED advances have significantly improved LED's contrast performance, closing the gap with OLED in backlight precision. Brands across all price segments deploy LED technology as their volume production platform globally.
Read more about this report - REQUEST FREE SAMPLE COPY IN PDF
OLED screen technology holds the premium position, with LG and Sony leading category innovation. LG's OLED evo W6 wallpaper TV, launched in 2025, represents the pinnacle of current consumer OLED development with its ultra-thin design and immersive viewing experience. Samsung's QD-OLED TVs incorporate quantum dot layers for enhanced brightness and colour purity compared to traditional WOLED displays, appealing to premium consumers seeking best-in-class picture quality in the global smart TV market.
By Application, Residential accounts for the dominant share of the market due to universal household entertainment demand and increasing screen sizes
Residential applications dominate the global smart TV market, with smart TVs serving as the central home entertainment hub for video streaming, gaming, social media, and smart home integration. The growing preference for larger screens above 55 inches reflects consumers' desire for immersive living room entertainment experiences. Rising OTT subscription penetration across North America, Europe, and Asia Pacific sustains consistent smart TV purchase and upgrade cycles in residential settings.
Read more about this report - REQUEST FREE SAMPLE COPY IN PDF
Commercial applications for smart TVs are gaining traction across hospitality, retail, healthcare, and corporate sectors. Hotels increasingly deploy smart TVs with customised content portals, enabling personalised guest entertainment experiences. Retail businesses are adopting large-format smart displays for digital signage and interactive customer engagement. The commercial segment represents a growing revenue opportunity for brands that offer enterprise-grade smart TV platforms with remote management and content control capabilities.
North America dominates the market due to high consumer spending on premium electronics, strong brand presence, and deep OTT streaming adoption
North America leads the global smart TV market in revenue, supported by high average selling prices, strong consumer appetite for premium display technology, and near-universal OTT streaming service adoption. The United States is the single largest market, dominated by Samsung, LG, Sony, and Vizio. Samsung's 2026 expansion of its Neo QLED and Micro RGB lines for the North American market reinforces the region's importance as a primary launch territory for flagship display innovations globally.
Read more about this report - REQUEST FREE SAMPLE COPY IN PDF
Asia Pacific is the largest volume market and fastest-growing region in the global smart TV market, propelled by China's massive manufacturing base, India's rapidly expanding middle class, and ASEAN's growing digital consumption. Local brands including TCL, Hisense, and domestic Chinese manufacturers offer affordable smart TVs that drive high-volume adoption. In August 2025, AKAI launched its PowerView Series in India with Google TV, reflecting the intensifying competition from domestic and Asian brands targeting India's premium aspirational segment.
The global smart TV market is moderately concentrated, dominated by a small number of electronics conglomerates with integrated display manufacturing capabilities. Samsung has held the top global TV market share position for 19 consecutive years, followed closely by LG Electronics. Sony, TCL, Hisense, and Vizio compete across different price tiers and geographies, with Chinese brands gaining significant ground in value segments globally.
Competitive differentiation revolves around display panel technology ownership, operating system ecosystem depth, AI feature sets, and supply chain integration. Platform revenue from advertising and app stores is becoming an increasingly important competitive lever. The market is characterised by rapid product cycles with annual lineup refreshes and CES as the primary global launch showcase.
Founded in 1969, headquartered in Suwon, South Korea. Samsung leads the global smart TV market for 19 consecutive years, offering an extensive portfolio spanning OLED, QLED, Neo QLED, and Micro RGB technologies. The 2026 CES lineup featured the S95H QD-OLED flagship and Micro RGB TVs from 55 to 130 inches, underscoring Samsung's technology leadership and premium market positioning globally.
Founded in 1958, headquartered in Seoul, South Korea. LG Electronics is the global leader in OLED panel manufacturing and smart TV innovation, with the OLED evo and Micro RGB evo product families defining the premium consumer segment. LG's WebOS platform offers a rich app ecosystem and AI content discovery features, maintaining the brand's strong competitive position across North America, Europe, and Asia Pacific.
Founded in 1976, headquartered in Cupertino, California. Apple's smart TV presence centres on the Apple TV 4K streaming device and AirPlay ecosystem integration with third-party TVs. Apple TV Plus content investment and deep iOS device integration make Apple a strategic player in the connected home entertainment ecosystem, even without manufacturing its own smart TV hardware panels directly.
Panasonic is a long-established smart TV brand in India and Asia Pacific, offering reliable LED, OLED, and Android TV models across competitive price points. The company leverages its decades-long electronics heritage and trusted brand recognition to maintain consistent retail presence in the Indian subcontinent, targeting mass-market and mid-tier consumers seeking quality home entertainment solutions.
Other key players in the market are Koninklijke Philips N.V., Sony Corporation, TCL, Haier Group Corporation, Vizio Inc., and Others.
*Please note that this is only a partial list; the complete list of key players is available in the full report. Additionally, the list of key players can be customized to better suit your needs.*
Discover the latest insights on the global smart TV industry with our comprehensive 2026 report. Stay ahead with current data on display technology innovations, streaming platform dynamics, and top regional growth markets. Whether you are a manufacturer, content provider, or investor, this report delivers strategic clarity. Download your free sample now and explore the opportunities in the expanding smart TV space.
Upto 15% Off
USD
$2499 $2249
$3999 $3599
$4999 $4249
$5999 $5099


*While we strive to always give you current and accurate information, the numbers depicted on the website are indicative and may differ from the actual numbers in the main report. At Expert Market Research, we aim to bring you the latest insights and trends in the market. Using our analyses and forecasts, stakeholders can understand the market dynamics, navigate challenges, and capitalize on opportunities to make data-driven strategic decisions.*
In 2025, the market reached an approximate value of USD 269.08 Billion.
The market is projected to grow at a CAGR of 9.60% between 2026 and 2035.
The market is estimated to witness a healthy growth in the forecast period of 2026-2035 to reach about USD 672.96 Billion by 2035.
Developing modular upgradeable hardware, partnering with regional OTT and telco bundles, offering managed device fleets, and integrating edge AI services to monetize personalized viewing and enterprise solutions are some of the key strategies observed in the market.
The key market trend guiding the growth of the smart TV market include the increased acceptance of 4K resolution televisions.
The major regions in the market are North America, Latin America, the Middle East and Africa, Europe, and the Asia Pacific.
HD TV, Full HD TV, 4K UHD TV, and 8K TV, among others are the major resolution types of the product in the market.
The major screen sizes of the product in the market include below 32 inches, 32 to 45 inches, 46 to 55 inches, 56 to 65 inches, and above 65 inches, among others.
The significant screen types of the product in the market are flat and curved.
LCD (Liquid Crystal Display), LED (Light Emitting Diode), OLED (Organic Light Emitting Diode), and QLED (Quantum Dot Light Emitting Diode) are the significant screen technology segments of the product in the market.
Android, Roku, WebOS, Tizen OS, iOS, and MyHomeScreen, among others, are the significant platforms of the product in the market.
Offline and online are the major distribution channels of the product in the market.
Residential and commercial applications are the major application segments of the product in the market.
The key players in the market include Samsung Electronics Co., Ltd., LG Electronics, Apple Inc., Panasonic India, Koninklijke Philips N.V., Sony Corporation, TCL, Haier Group Corporation, Vizio Inc., and others.
Component shortages, panel commoditization, and platform fragmentation are increasing costs and slowing innovation, while regulatory privacy rules and fragmented regional OTT ecosystems complicate global go-to-market strategies.
Explore our key highlights of the report and gain a concise overview of key findings, trends, and actionable insights that will empower your strategic decisions.
| REPORT FEATURES | DETAILS |
| Base Year | 2025 |
| Historical Period | 2019-2025 |
| Forecast Period | 2026-2035 |
| Scope of the Report |
Historical and Forecast Trends, Industry Drivers and Constraints, Historical and Forecast Market Analysis by Segment:
|
| Breakup by Resolution Type |
|
| Breakup by Screen Size |
|
| Breakup by Screen Type |
|
| Breakup by Screen Technology |
|
| Breakup by Platform |
|
| Breakup by Distribution Channel |
|
| Breakup by Application |
|
| Breakup by Region |
|
| Market Dynamics |
|
| Competitive Landscape |
|
| Companies Covered |
|
| Report Price and Purchase Option | Explore our purchase options that are best suited to your resources and industry needs. |
| Delivery Format | Delivered as an attached PDF and Excel through email, with an option of receiving an editable PPT, according to the purchase option. |
Datasheet
One User
USD 2,499
USD 2,249
tax inclusive*
Single User License
One User
USD 3,999
USD 3,599
tax inclusive*
Five User License
Five User
USD 4,999
USD 4,249
tax inclusive*
Corporate License
Unlimited Users
USD 5,999
USD 5,099
tax inclusive*
*Please note that the prices mentioned below are starting prices for each bundle type. Kindly contact our team for further details.*
Flash Bundle
Small Business Bundle
Growth Bundle
Enterprise Bundle
*Please note that the prices mentioned below are starting prices for each bundle type. Kindly contact our team for further details.*
Flash Bundle
Number of Reports: 3
20%
tax inclusive*
Small Business Bundle
Number of Reports: 5
25%
tax inclusive*
Growth Bundle
Number of Reports: 8
30%
tax inclusive*
Enterprise Bundle
Number of Reports: 10
35%
tax inclusive*
How To Order

Select License Type
Choose the right license for your needs and access rights.

Click on ‘Buy Now’
Add the report to your cart with one click and proceed to register.

Select Mode of Payment
Choose a payment option for a secure checkout. You will be redirected accordingly.
Strategic Solutions for Informed Decision-Making
Gain insights to stay ahead and seize opportunities.

Get insights & trends for a competitive edge.

Track prices with detailed trend reports.

Analyse trade data for supply chain insights.

Leverage cost reports for smart savings

Enhance supply chain with partnerships.

Connect For More Information
Our expert team of analysts will offer full support and resolve any queries regarding the report, before and after the purchase.
Our expert team of analysts will offer full support and resolve any queries regarding the report, before and after the purchase.
We employ meticulous research methods, blending advanced analytics and expert insights to deliver accurate, actionable industry intelligence, staying ahead of competitors.
Our skilled analysts offer unparalleled competitive advantage with detailed insights on current and emerging markets, ensuring your strategic edge.
We offer an in-depth yet simplified presentation of industry insights and analysis to meet your specific requirements effectively.


