

Consumer Insights
Uncover trends and behaviors shaping consumer choices today
Procurement Insights
Optimize your sourcing strategy with key market data
Industry Stats
Stay ahead with the latest trends and market analysis.
The software defined perimeter market size reached around USD 106.26 Billion in 2025. The market is projected to grow at a CAGR of 33.80% between 2026 and 2035 to reach nearly USD 1954.03 Billion by 2035.
Compound Annual Growth Rate
33.8%
Value in USD Billion
2026-2035
Read more about this report - REQUEST FREE SAMPLE COPY IN PDF
| Global Software Defined Perimeter Market Report Summary | Description | Value |
| Base Year | USD Billion | 2025 |
| Historical Period | USD Billion | 2019-2025 |
| Forecast Period | USD Billion | 2026-2035 |
| Market Size 2025 | USD Billion | 106.26 |
| Market Size 2035 | USD Billion | 1954.03 |
| CAGR 2019-2025 | Percentage | XX% |
| CAGR 2026-2035 | Percentage | 33.80% |
| CAGR 2026-2035 - Market by Region | Asia Pacific | 39.0% |
| CAGR 2026-2035 - Market by Country | India | 44.7% |
| CAGR 2026-2035 - Market by Country | China | 37.3% |
| CAGR 2026-2035 - Market by Enforcement Point | End Point | 37.9% |
| CAGR 2026-2035 - Market by End Use | Banking, Financial Services, and Insurance | 38.5% |
| Market Share by Country 2025 | Germany | 4.6% |
The global software defined perimeter industry is being driven by the growing instances of cybercrime and cyber-attack across the world, resulting in the increased demand for cybersecurity. SDP acts as an organisation’s virtual perimeter that restricts any unauthentic access to enterprise applications, thus, providing enhanced security.
Read more about this report - REQUEST FREE SAMPLE COPY IN PDF
A software defined perimeter is an approach to computer security, which creates one-to-one network connections between the user and the device. The global software defined perimeter industry can be divided based on segments like enforcement points, components, deployment modes, organisations, end-uses, and regions.
Breakup by Enforcement Point
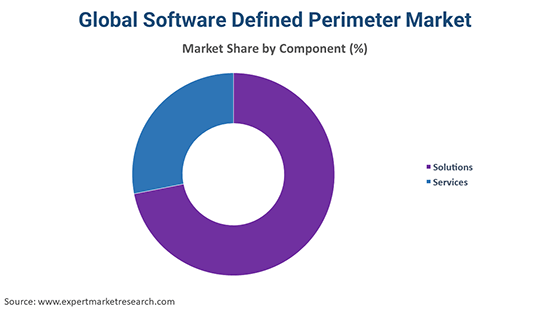
Breakup by Component
Breakup by Deployment Mode
Breakup by Organisation
Breakup by End Use
Breakup by Region


| CAGR 2026-2035 - Market by | Country |
| India | 44.7% |
| China | 37.3% |
| UK | 30.9% |
| USA | 30.1% |
| Germany | 27.8% |
| Canada | XX% |
| France | XX% |
| Italy | XX% |
| Japan | 23.3% |
| Australia | XX% |
| Saudi Arabia | XX% |
| Brazil | XX% |
| Mexico | XX% |
Organisations across the world are continuously adopting enhanced cyber security measures to protect their data from cyber-attacks. The major factors driving the growth of the global software defined perimeter industry are the growing demand for policy driven and programmable security framework, the growing consumer preference for cloud-based applications, and the enhanced regulation and compliance requirements in various organisations to fight cyber-related threats. The rising demand for cost-effective solutions is aiding the growth of cloud-based services, further fulfilling the security needs of the ever-growing IT sector. The increased government initiatives and advancement in technology is further supporting the industry growth.
The end point segment, among other enforcement point types, accounts for the largest share in the market and is further anticipated to grow at the fastest rate in the forecast period. Further, due to the increasing demand for cloud deployment mode, the segment is anticipated to account for a significant share in the global industry.
However, the lack of awareness regarding cybersecurity coupled with the reduced IT standards across the industries may restrain the growth of the global software defined perimeter market in the forecast period.
The report presents a detailed analysis of the following key players in the global software defined perimeter industry, looking into their capacity, market shares, and latest developments like capacity expansions, plant turnarounds, and mergers and acquisitions:
The EMR report gives an in-depth insight into the market by providing a SWOT analysis as well as an analysis of Porter’s Five Forces model.
Upto 15% Off
USD
$2499 $2249
$3999 $3599
$4999 $4249
$5999 $5099


*While we strive to always give you current and accurate information, the numbers depicted on the website are indicative and may differ from the actual numbers in the main report. At Expert Market Research, we aim to bring you the latest insights and trends in the market. Using our analyses and forecasts, stakeholders can understand the market dynamics, navigate challenges, and capitalize on opportunities to make data-driven strategic decisions.*
In 2025, the market attained a value of nearly USD 106.26 Billion.
The market is assessed to grow at a CAGR of 33.80% between 2026 and 2035.
The market is estimated to witness a healthy growth in the forecast period of 2026-2035 to reach about USD 1954.03 Billion by 2035.
The major market drivers include the growing incidences of cybercrime and cyber-attack and the increasing demand for policy-driven and programmable security framework.
The key trends guiding the market development include the introduction of favourable government initiatives aimed at boosting cybersecurity, the increasing deployment of cloud computing, and technological advancements and innovations.
The major regions in the market are North America, Latin America, the Middle East and Africa, Europe, and the Asia Pacific.
The leading enforcement points of the product in the market include controller, gateway, and end point.
The significant components of software defined perimeter in the market are solutions and services.
The major deployment modes of the product in the market are cloud and on-premises.
The various organisations considered in the market report include large enterprises and small and medium enterprises.
The major end uses of the product are telecom service providers, cloud service providers, information technology enabled services, defence, banking, financial services, and insurance, media and entertainment, government, education, and healthcare, among others.
The major players in the market are Check Point Software Technologies Ltd., Intel Corporation, Fortinet, Inc., Juniper Networks, Inc., and Palo Alto Networks, Inc., among others.
Explore our key highlights of the report and gain a concise overview of key findings, trends, and actionable insights that will empower your strategic decisions.
| REPORT FEATURES | DETAILS |
| Base Year | 2025 |
| Historical Period | 2019-2025 |
| Forecast Period | 2026-2035 |
| Scope of the Report |
Historical and Forecast Trends, Industry Drivers and Constraints, Historical and Forecast Market Analysis by Segment:
|
| Breakup by Enforcement Point |
|
| Breakup by Component |
|
| Breakup by Deployment Mode |
|
| Breakup by Organisation |
|
| Breakup by End Use |
|
| Breakup by Region |
|
| Market Dynamics |
|
| Competitive Landscape |
|
| Companies Covered |
|
Datasheet
One User
USD 2,499
USD 2,249
tax inclusive*
Single User License
One User
USD 3,999
USD 3,599
tax inclusive*
Five User License
Five User
USD 4,999
USD 4,249
tax inclusive*
Corporate License
Unlimited Users
USD 5,999
USD 5,099
tax inclusive*
*Please note that the prices mentioned below are starting prices for each bundle type. Kindly contact our team for further details.*
Flash Bundle
Small Business Bundle
Growth Bundle
Enterprise Bundle
*Please note that the prices mentioned below are starting prices for each bundle type. Kindly contact our team for further details.*
Flash Bundle
Number of Reports: 3
20%
tax inclusive*
Small Business Bundle
Number of Reports: 5
25%
tax inclusive*
Growth Bundle
Number of Reports: 8
30%
tax inclusive*
Enterprise Bundle
Number of Reports: 10
35%
tax inclusive*
How To Order

Select License Type
Choose the right license for your needs and access rights.

Click on ‘Buy Now’
Add the report to your cart with one click and proceed to register.

Select Mode of Payment
Choose a payment option for a secure checkout. You will be redirected accordingly.
Strategic Solutions for Informed Decision-Making
Gain insights to stay ahead and seize opportunities.

Get insights & trends for a competitive edge.

Track prices with detailed trend reports.

Analyse trade data for supply chain insights.

Leverage cost reports for smart savings

Enhance supply chain with partnerships.

Connect For More Information
Our expert team of analysts will offer full support and resolve any queries regarding the report, before and after the purchase.
Our expert team of analysts will offer full support and resolve any queries regarding the report, before and after the purchase.
We employ meticulous research methods, blending advanced analytics and expert insights to deliver accurate, actionable industry intelligence, staying ahead of competitors.
Our skilled analysts offer unparalleled competitive advantage with detailed insights on current and emerging markets, ensuring your strategic edge.
We offer an in-depth yet simplified presentation of industry insights and analysis to meet your specific requirements effectively.


