

Consumer Insights
Uncover trends and behaviors shaping consumer choices today
Procurement Insights
Optimize your sourcing strategy with key market data
Industry Stats
Stay ahead with the latest trends and market analysis.
The global tartaric acid market stood at a value of USD 386.37 Million in 2025. The market is projected to grow at a CAGR of 4.40% in the forecast period of 2026-2035 to reach USD 594.30 Million by 2035.
Compound Annual Growth Rate
4.4%
Value in USD Million
2026-2035
| Global Tartaric Acid Market Report Summary | Description | Value |
| Base Year | USD Million | 2025 |
| Historical Period | USD Million | 2019-2025 |
| Forecast Period | USD Million | 2026-2035 |
| Market Size 2025 | USD Million | 386.37 |
| Market Size 2035 | USD Million | 594.30 |
| CAGR 2019-2025 | Percentage | XX% |
| CAGR 2026-2035 | Percentage | 4.40% |
| CAGR 2026-2035 - Market by Region | North America | 4.2% |
| CAGR 2026-2035 - Market by Country | India | 5.1% |
| CAGR 2026-2035 - Market by Country | China | 4.5% |
| CAGR 2026-2035 - Market by End Use | Food and Beverages | 4.8% |
| Market Share by Country 2025 | Canada | 3.1% |
The increasing awareness among consumers regarding the health benefits offered by tartaric acids, such as boosting metabolism, increasing production of collagen, and enhancement of energy generation in the body, are the factors attributing to the growth of the tartaric acid market. It acts as a primary raw material in the process of winemaking, which has significantly propelled the overall demand for the product across the globe. Also, the product is further used in the processing of gypsum as an anti-caking agent. It can also be used in the production of cement in the form of a set-retardant and anti-solidifying agent. The aforementioned factors are expected to favourably drive the growth of the market in the coming years.
As per the tartaric acid market analysis, the increasing use of the product as an emulsifier in bread production is likely to provide lucrative opportunities to industry participants. Along with this, industrial applications of tartaric acid include the manufacturing of ceramics, textile printing, tanning, photography, etc. which are further expected to impel the market growth over the forecast period of 2026-2035.
The adequate consumption of wine is expected to remain a prime trend in tartaric acid market over the forecast period. The increasing popularity of packaged food coupled with rising living standards is estimated to further complement the market growth over the forecast period. Moreover, the increasing usage of tartaric acid as an additive and a preservative in the food and beverage industry is projected to fuel global market growth. Apart from this, the product is gaining acceptance as a chelating agent in soil fertilizers and metal cleaning and is also used in the pharmaceutical industry as an excipient for drugs, which are anticipated to strengthen global market growth.
As per the tartaric acid market dynamics and trends, a study conducted by Russian and Irish scientists stated that the addition of a small quantity of tartaric acid to shrimp can boost their growth rate and immunity.
As per the tartaric acid industry analysis, a study published in the Journal of nutrition, health and aging investigated the use of urinary tartaric acid as a biomarker for finding the anti-inflammatory effects of wine. This study found a correlation between higher wine consumption and increased tartaric acid excretion which was supported by Receiver Operating Characteristic (ROC) curve analysis. The rise in tartaric acid was also associated with significant reductions in soluble vascular cell adhesion molecule-1 (sVCAM-1) concentrations. Eventually, the study highlighted that moderate wine consumption can lead to a decrease in cardiovascular risks.
A scientific report published in nature.com studies the capabilities of novel electrolyte additives such as succinic, tartaric, citric, and maleic acid, among others, for high-performance capacity retention in zinc-ion batteries (ZIB). ZIB batteries are considered eco-friendly in nature and their demand is expected to rise in the coming years. Several characteristics of tartaric acid as an electrolyte in ZIB can exhibit a capacity of up to 374 mAh g−1, an acceptable rate capability and high-capacity retention of as much as 91.0% after 7200 cycles, which can also enhance the demand for tartaric acid to improve the capacity of ZIB batteries and consequently boost the growth of the tartaric acid industry.
Read more about this report - REQUEST FREE SAMPLE COPY IN PDF
Tartaric acid is a naturally occurring substance present in various fruits, such as grapes, apricots, apples, avocados, bananas, and tamarinds. It has antioxidant and anti-inflammatory properties, which have led to its increasing application in functional foods and energy drinks.
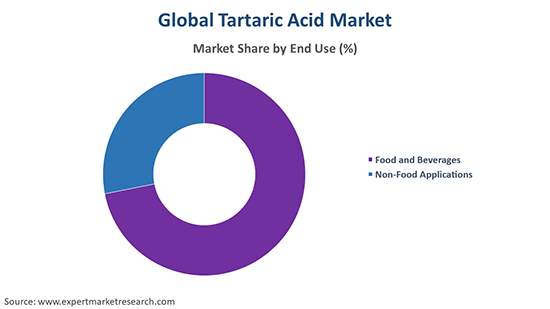
The end uses of the product is bifurcated into:
Market Breakup by Region
| CAGR 2026-2035 - Market by | Country |
| India | 5.1% |
| China | 4.5% |
| Saudi Arabia | 4.3% |
| Canada | 4.3% |
| UK | 4.0% |
| USA | XX% |
| Germany | XX% |
| France | XX% |
| Japan | 3.9% |
| Australia | XX% |
| Brazil | XX% |
| Mexico | XX% |
| Italy | 3.6% |
Based on the end-use, the food and beverage segment held the major share in 2020 and is expected to register the highest CAGR over the forecast period of 2026-2035. The segment growth in the tartaric acid industry is attributed to the growing demand for tartaric acid as an emulsifier and preservative in bakeries and the manufacturing of confectionery items. Besides, it can also be employed to enhance the flavour of carbonated beverages, thus, leading to greater adoption of the product in recent years.
The report gives a detailed analysis of the following key players in the global market for tartaric acid, covering their competitive landscape, capacity, and latest developments like mergers, acquisitions, and investments, expansions of capacity, and plant turnarounds:
The comprehensive EMR report provides an in-depth assessment of the market based on the Porter's five forces model along with giving a SWOT analysis.


Regionally, Europe dominated the global tartaric acid market share in 2020, owing to the increased production and consumption level for wines across many European nations such as Germany, Italy, France, and Spain, among others. Moreover, the increasing penetration of the product as a chelating agent is also expected to propel the demand for tartaric acid in the region.
Cost of Raw Materials
Fluctuations in the prices of grapes and other natural sources directly impact the production costs and prices of tartaric acid.
Energy and Manufacturing Expenses
Rising energy and manufacturing costs increase overall production expenses, affecting the final prices of tartaric acid as well as increasing tartaric acid market opportunities.
Market Demand and Supply Dynamics
Changes in market supply and demand directly influence pricing strategies for tartaric acid, driving prices up or down.
Research and Development Investments
Investments in research and development activities to improve product quality can lead to higher pricing of tartaric acid due to enhanced applications.
Upto 15% Off
USD
$2499 $2249
$3999 $3599
$4999 $4249
$5999 $5099


*While we strive to always give you current and accurate information, the numbers depicted on the website are indicative and may differ from the actual numbers in the main report. At Expert Market Research, we aim to bring you the latest insights and trends in the market. Using our analyses and forecasts, stakeholders can understand the market dynamics, navigate challenges, and capitalize on opportunities to make data-driven strategic decisions.*
The global tartaric acid market reached a value of USD 386.37 Million in 2025.
The market is projected to grow at a CAGR of nearly 4.40% in the forecast period of 2026-2035.
The market is estimated to observe a healthy growth in the forecast period of 2026-2035 to reach a value of about USD 594.30 Million by 2035.
The major drivers of the market include rising disposable incomes, growing wine consumption, and rising use of tartaric acid as a chelating agent.
The rising industrial applications of tartaric acid and increasing awareness among consumers regarding its health benefits are expected to be key trends guiding the growth of the market.
North America, Europe, the Asia Pacific, Latin America, and the Middle East and Africa are the leading regions in the market.
The major end uses of tartaric acid in the market are food and beverages and non-food applications.
The leading players in the global tartaric acid market are Ningbo Jinzhan Biotechnology Co.,Ltd., Noah Technologies Corporation, Caviro Extra SpA, and The Tartaric Chemicals Corporation, among others.
Explore our key highlights of the report and gain a concise overview of key findings, trends, and actionable insights that will empower your strategic decisions.
| REPORT FEATURES | DETAILS |
| Base Year | 2025 |
| Historical Period | 2019-2025 |
| Forecast Period | 2026-2035 |
| Scope of the Report |
Historical and Forecast Trends, Industry Drivers and Constraints, Historical and Forecast Market Analysis by Segment:
|
| Breakup by End Use |
|
| Breakup by Region |
|
| Market Dynamics |
|
| Competitive Landscape |
|
| Companies Covered |
|
| Report Price and Purchase Option | Explore our purchase options that are best suited to your resources and industry needs. |
| Delivery Format | Delivered as an attached PDF and Excel through email, with an option of receiving an editable PPT, according to the purchase option. |
Datasheet
One User
USD 2,499
USD 2,249
tax inclusive*
Single User License
One User
USD 3,999
USD 3,599
tax inclusive*
Five User License
Five User
USD 4,999
USD 4,249
tax inclusive*
Corporate License
Unlimited Users
USD 5,999
USD 5,099
tax inclusive*
*Please note that the prices mentioned below are starting prices for each bundle type. Kindly contact our team for further details.*
Flash Bundle
Small Business Bundle
Growth Bundle
Enterprise Bundle
*Please note that the prices mentioned below are starting prices for each bundle type. Kindly contact our team for further details.*
Flash Bundle
Number of Reports: 3
20%
tax inclusive*
Small Business Bundle
Number of Reports: 5
25%
tax inclusive*
Growth Bundle
Number of Reports: 8
30%
tax inclusive*
Enterprise Bundle
Number of Reports: 10
35%
tax inclusive*
How To Order

Select License Type
Choose the right license for your needs and access rights.

Click on ‘Buy Now’
Add the report to your cart with one click and proceed to register.

Select Mode of Payment
Choose a payment option for a secure checkout. You will be redirected accordingly.
Strategic Solutions for Informed Decision-Making
Gain insights to stay ahead and seize opportunities.

Get insights & trends for a competitive edge.

Track prices with detailed trend reports.

Analyse trade data for supply chain insights.

Leverage cost reports for smart savings

Enhance supply chain with partnerships.

Connect For More Information
Our expert team of analysts will offer full support and resolve any queries regarding the report, before and after the purchase.
Our expert team of analysts will offer full support and resolve any queries regarding the report, before and after the purchase.
We employ meticulous research methods, blending advanced analytics and expert insights to deliver accurate, actionable industry intelligence, staying ahead of competitors.
Our skilled analysts offer unparalleled competitive advantage with detailed insights on current and emerging markets, ensuring your strategic edge.
We offer an in-depth yet simplified presentation of industry insights and analysis to meet your specific requirements effectively.


