

Consumer Insights
Uncover trends and behaviors shaping consumer choices today
Procurement Insights
Optimize your sourcing strategy with key market data
Industry Stats
Stay ahead with the latest trends and market analysis.
The global transparent display market attained a value of about USD 3.75 Billion in 2025. The market is further expected to grow at a CAGR of 44.10% during the forecast period of 2026-2035 to reach nearly USD 144.77 Billion by 2035.
Compound Annual Growth Rate
44.1%
Value in USD Billion
2026-2035
| Global Transparent Display Market Report Summary | Description | Value |
| Base Year | USD Billion | 2025 |
| Historical Period | USD Billion | 2019-2025 |
| Forecast Period | USD Billion | 2026-2035 |
| Market Size 2025 | USD Billion | 3.75 |
| Market Size 2035 | USD Billion | 144.77 |
| CAGR 2019-2025 | Percentage | XX% |
| CAGR 2026-2035 | Percentage | 44.10% |
| CAGR 2026-2035 - Market by Region | North America | 48.1% |
| CAGR 2026-2035 - Market by Country | Canada | 49.6% |
| CAGR 2026-2035 - Market by Country | Germany | 43.8% |
| CAGR 2026-2035 - Market by Technology | OLED | 49.4% |
| CAGR 2026-2035 - Market by Basis of Resolution | Ultra-High Definition (UHD) | 48.5% |
| Market Share by Country 2025 | France | 5.3% |
The global market for transparent display has been driven by the constant innovation in display technology to deliver high resolution and lower power consumption. The advances in nanoparticle and transparent sensors in the electric circuit, along with the rising prevalence of LCD and OLED technology, have been significantly aiding the market growth of transparent displays as the product is used in various end use industries, including the healthcare, automotive, consumer, and industrial, among others. The sleek and lightweight design of a transparent display aided by self-illuminating technology is further augmenting its applications in various industries.
Read more about this report - REQUEST FREE SAMPLE COPY IN PDF
Owing to robust investments in the healthcare infrastructure, transparent displays find a significant application in the healthcare sector, which substantially contributes to the growth of the market. Transparent displays are being deployed to assist healthcare providers during critical operations, surgeries, and regular checkups. Head-up or head-mounted displays are installed to show a patient’s vitals, such as blood pressure, oxygen, heartbeat, and temperature, among others, without distracting the practitioner, hence boosting the overall growth of the market.
Read more about this report - REQUEST FREE SAMPLE COPY IN PDF
A transparent display is an electronic technology that passes ambient light from real objects behind a display panel, such as an LCD or OLED. The advances in nanoparticle and transparent sensors in the electric circuit has given rise to transparent display technology.
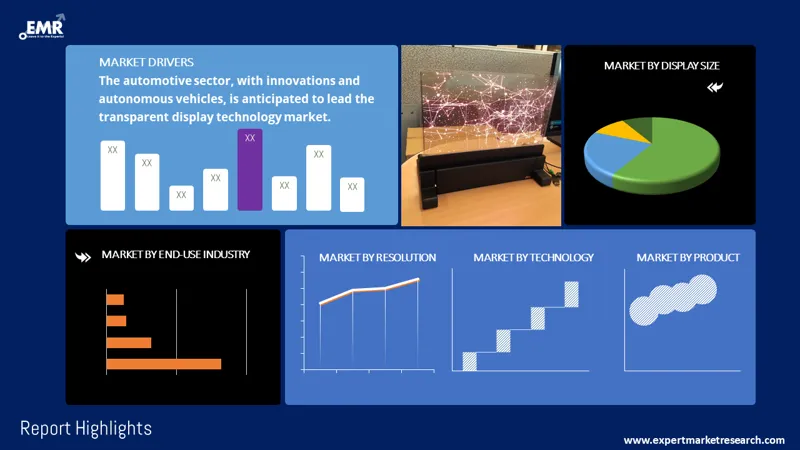
Breakup by Display Size
Breakup by Product
Breakup by Technology
Breakup by Resolution
Breakup by End-Use Industry
Breakup by Region
| CAGR 2026-2035 - Market by | Country |
| Canada | 49.6% |
| Germany | 43.8% |
| France | 41.7% |
| China | 38.4% |
| Saudi Arabia | 34.7% |
| USA | XX% |
| UK | XX% |
| Italy | XX% |
| Japan | 32.6% |
| India | XX% |
| Australia | XX% |
| Brazil | XX% |
| Mexico | XX% |


The automotive sector is expected to hold a significant share in the overall market of transparency display in the coming years. With robust investments into the automotive sector to incorporate advanced technology and elevate the consumer experience, transparent displays are rapidly being used in technically advanced and innovative automobiles. Built on a thin plastic substrate, the transparent display can be integrated into the vehicle’s windshield to provide an enhanced driving experience and eliminate the risk of distractions that may cause accidents. Displaying critical information, such as speed, distance, maps, and time, among others, via a HUD is a major safety improvement and a significant contributor to the growth of the market.
Furthermore, with the emergence of autonomous cars, transparent displays are expected to be extremely useful for a signalling intent. Due to the lack of an eye-contact with the driver, it can be difficult to know if a vehicle is slowing down or if it’s safe for a pedestrian to cross the road. Transparent displays can flash messages in order to familiarise the pedestrians or other cars on the road about the movement of the self-driven cars. Looking forward, owing to expanding purchasing power and constant innovation in automobile technology, the rising demand for transparent displays in vehicles is expected to boost the market growth of transparent display over the forecast period.
The report presents a detailed analysis of the following key players in the global transparent display market, looking into their capacity, market share, and latest developments like capacity expansions, plant turnabouts and mergers and acquisitions:
The comprehensive report looks at the micro and macro aspects of the industry. The EMR report gives an in-depth insight into the market by providing a SWOT analysis as well as an analysis of the Porter’s Five Forces Model.
Upto 15% Off
USD
$2499 $2249
$3999 $3599
$4999 $4249
$5999 $5099


*While we strive to always give you current and accurate information, the numbers depicted on the website are indicative and may differ from the actual numbers in the main report. At Expert Market Research, we aim to bring you the latest insights and trends in the market. Using our analyses and forecasts, stakeholders can understand the market dynamics, navigate challenges, and capitalize on opportunities to make data-driven strategic decisions.*
The global transparent display market attained a value of nearly USD 3.75 Billion in 2025.
The market is projected to grow at a CAGR of 44.1% in the forecast period of 2026-2035.
The market is estimated to witness a healthy growth in the forecast period of 2026-2035 to reach about USD 144.77 Billion by 2035.
The market is being driven by the constant innovations in display technology and rising applications of transparent displays in various industrial applications.
The market is anticipated to be led by the use of transparent display technology in the automotive sector, with constant innovations in the automotive sector and the emergence of autonomous vehicles.
The major regional markets for transparent display are North America, Latin America, the Asia Pacific, Europe, and the Middle East and Africa.
The different display sizes of transparent display include small and medium sized, and large sized.
The major products of transparent display include head-mounted display (HMD), head-up display (HUD), smart appliance, and digital signage, among others.
The major technologies of transparent display are LCD and OLED, among others.
The significant resolutions of transparent display are ultra-high definition (UHD), full HD, and HD, among others.
The major end-use industries of transparent display are consumer, industrial, retail and hospitality, sports and entertainment, healthcare, aerospace and defence, and automotive and transportation, among others.
The major players in the industry are Hangzhou Hikvision Digital Technology Co., Ltd., LG Electronics Inc., BenQ Corporation, Samsung Electronics Co., Ltd., Panasonic Corporation, Planar Systems, Inc., and Crystal Display Systems Ltd, among others.
Explore our key highlights of the report and gain a concise overview of key findings, trends, and actionable insights that will empower your strategic decisions.
| REPORT FEATURES | DETAILS |
| Base Year | 2025 |
| Historical Period | 2019-2025 |
| Forecast Period | 2026-2035 |
| Scope of the Report |
Historical and Forecast Trends, Industry Drivers and Constraints, Historical and Forecast Market Analysis by Segment:
|
| Breakup by Display Size |
|
| Breakup by Product |
|
| Breakup by Technology |
|
| Breakup by Resolution |
|
| Breakup by End-Use Industry |
|
| Breakup by Region |
|
| Market Dynamics |
|
| Competitive Landscape |
|
| Companies Covered |
|
| Report Price and Purchase Option | Explore our purchase options that are best suited to your resources and industry needs. |
| Delivery Format | Delivered as an attached PDF and Excel through email, with an option of receiving an editable PPT, according to the purchase option. |
Datasheet
One User
USD 2,499
USD 2,249
tax inclusive*
Single User License
One User
USD 3,999
USD 3,599
tax inclusive*
Five User License
Five User
USD 4,999
USD 4,249
tax inclusive*
Corporate License
Unlimited Users
USD 5,999
USD 5,099
tax inclusive*
*Please note that the prices mentioned below are starting prices for each bundle type. Kindly contact our team for further details.*
Flash Bundle
Small Business Bundle
Growth Bundle
Enterprise Bundle
*Please note that the prices mentioned below are starting prices for each bundle type. Kindly contact our team for further details.*
Flash Bundle
Number of Reports: 3
20%
tax inclusive*
Small Business Bundle
Number of Reports: 5
25%
tax inclusive*
Growth Bundle
Number of Reports: 8
30%
tax inclusive*
Enterprise Bundle
Number of Reports: 10
35%
tax inclusive*
How To Order

Select License Type
Choose the right license for your needs and access rights.

Click on ‘Buy Now’
Add the report to your cart with one click and proceed to register.

Select Mode of Payment
Choose a payment option for a secure checkout. You will be redirected accordingly.
Strategic Solutions for Informed Decision-Making
Gain insights to stay ahead and seize opportunities.

Get insights & trends for a competitive edge.

Track prices with detailed trend reports.

Analyse trade data for supply chain insights.

Leverage cost reports for smart savings

Enhance supply chain with partnerships.

Connect For More Information
Our expert team of analysts will offer full support and resolve any queries regarding the report, before and after the purchase.
Our expert team of analysts will offer full support and resolve any queries regarding the report, before and after the purchase.
We employ meticulous research methods, blending advanced analytics and expert insights to deliver accurate, actionable industry intelligence, staying ahead of competitors.
Our skilled analysts offer unparalleled competitive advantage with detailed insights on current and emerging markets, ensuring your strategic edge.
We offer an in-depth yet simplified presentation of industry insights and analysis to meet your specific requirements effectively.


