

Consumer Insights
Uncover trends and behaviors shaping consumer choices today
Procurement Insights
Optimize your sourcing strategy with key market data
Industry Stats
Stay ahead with the latest trends and market analysis.
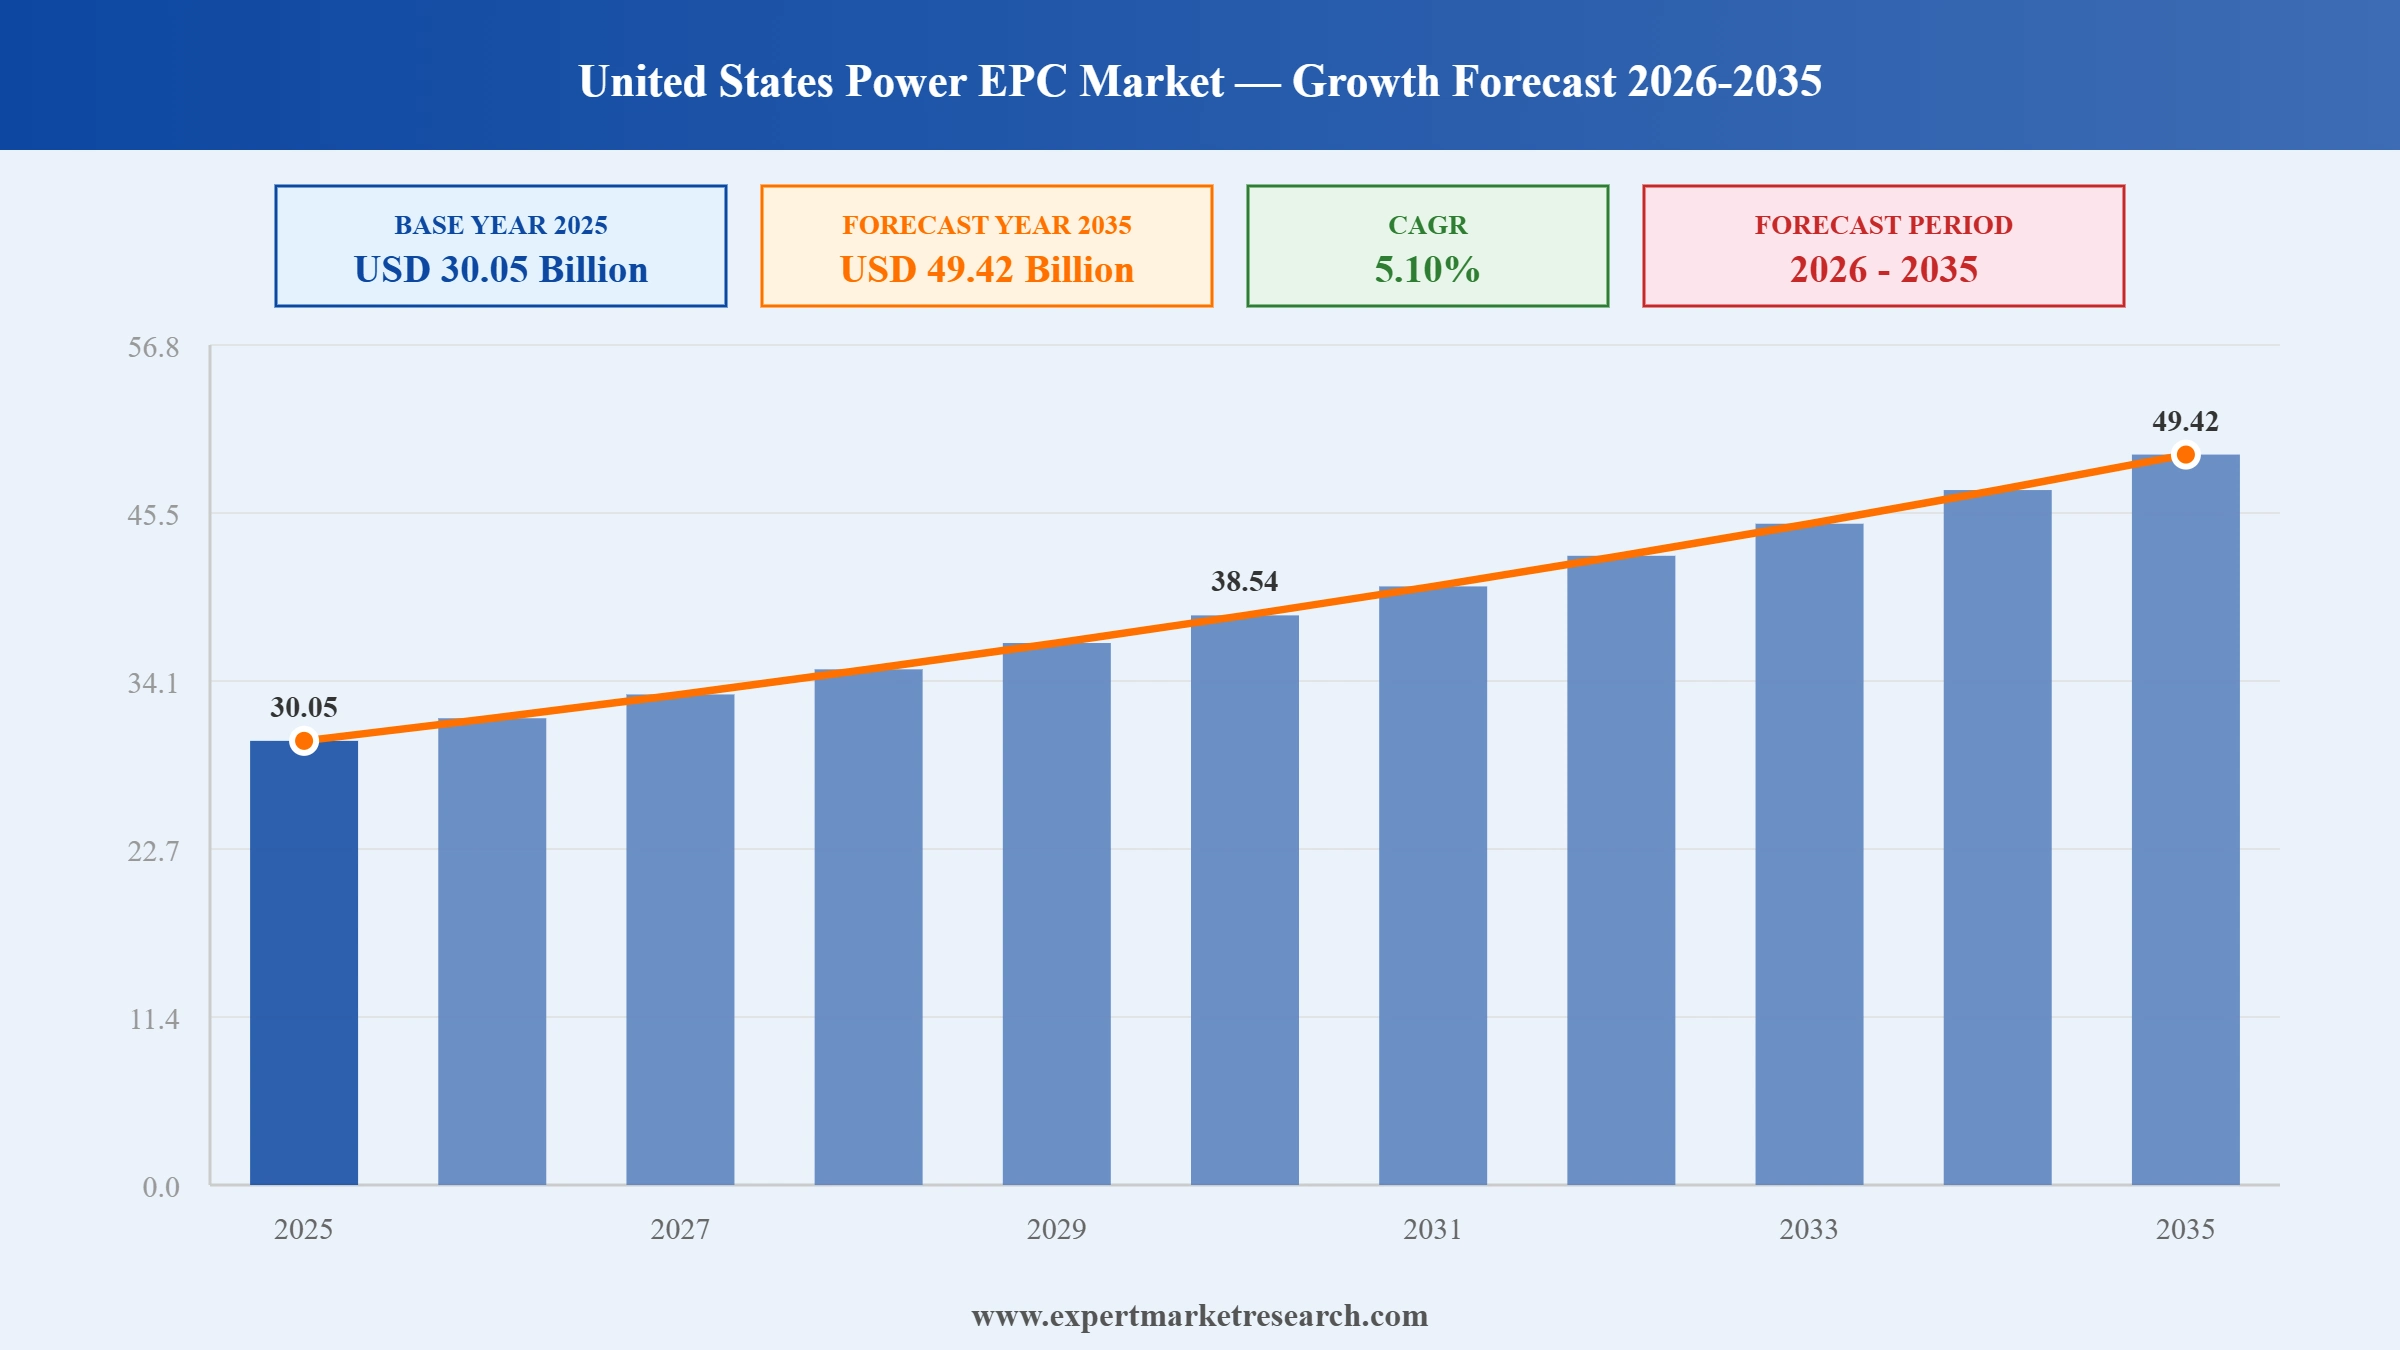
The United States power EPC market size reached USD 30.05 Billion in 2025. The market is expected to grow at a CAGR of 5.10% between 2026 and 2035, reaching almost USD 49.42 Billion by 2035.
Bechtel secured a multi-billion-dollar engineering, procurement, and construction contract for a new combined-cycle gas turbine plant in Texas, aimed at meeting surging electricity demand from data centers and industrial reshoring. The award reflects a broader U.S. shift toward firm dispatchable generation alongside renewables. Reuters reported that ERCOT load growth forecasts have accelerated EPC awards across the Gulf region.
Quanta Services reported record transmission EPC backlog tied to grid modernization and interconnection of new wind, solar, and battery storage capacity across the Midwest and Southwest. Federal permitting reforms and state-level resource-adequacy mandates are accelerating high-voltage line awards. Bloomberg noted that grid build-out is now a structural growth driver for U.S. power EPC contractors through the late 2020s.
The United States has an extensive power generation capacity, featuring over 1 million megawatts interconnected by 600,000 miles of transmission lines. Recent investments in grid modernization have significantly enhanced the system's intelligence and resilience, driving forward the US power Engineering, Procurement, and Construction (EPC) market.
As per industry reports, in 2020 alone, investments in wind and solar energy totalled USD 55 billion, with planned deployments of 7.6 gigawatts (GW) of wind and 21.5 GW of solar slated for 2022, as reported by the Energy Information Administration (EIA). Government funding continues to support various transmission projects aimed at bolstering the nation's grid infrastructure.
Read more about this report - REQUEST FREE SAMPLE COPY IN PDF
Lockdown measures implemented by the US government in response to the COVID-19 pandemic temporarily reduced electricity demand in commercial and industrial sectors in the first quarter of 2020. Despite this, the United States power EPC market is poised for growth driven by increasing power generation capacity and government support for electricity infrastructure development.
The US Department of Energy's (DOE) "Building a Better Grid Initiative," launched in January 2022, aims to accelerate the nationwide deployment of new and upgraded high-capacity electric transmission lines. The US boasts a substantial power generation capacity, with over 1 million megawatts connected to 600,000 miles of transmission lines. Recent investments in grid modernisation have made the system smarter and more resilient, further propelling the US power EPC market forward.
Investments in wind and solar energy reached USD 55 billion in 2020, with planned deployments of 7.6 GW of wind and 21.5 GW of solar in 2022, according to the Energy Information Administration (EIA). Government funding supports various transmission projects to enhance the nation's grid infrastructure.
The US Power EPC market encompasses diverse projects, including thermal power plants, renewable energy installations, and transmission networks. EPC contractors oversee the entire project lifecycle, from design to commissioning.
Factors driving the US power EPC market include increasing energy demands due to population growth and industrialisation, government initiatives promoting renewable energy, technological advancements, supportive policies, the need to modernise ageing infrastructure, and environmental concerns about reducing carbon emissions while driving the United States power EPC market development.


Read more about this report - REQUEST FREE SAMPLE COPY IN PDF
"United States Power EPC Market Report and Forecast 2026-2035" offers a detailed analysis of the market based on the following segments:
Market Breakup by Type
Market Breakup by Region
Key players in the power EPC market in the United States through technological innovations and increasing investments offer products and services to support the end users.
Upto 15% Off
USD
$3999 $3599
$2499 $2249
$4999 $4249
$5999 $5099


*While we strive to always give you current and accurate information, the numbers depicted on the website are indicative and may differ from the actual numbers in the main report. At Expert Market Research, we aim to bring you the latest insights and trends in the market. Using our analyses and forecasts, stakeholders can understand the market dynamics, navigate challenges, and capitalize on opportunities to make data-driven strategic decisions.*
The market is estimated to be valued at USD 30.05 Billion in 2025.
The market is projected to grow at a CAGR of 5.10% between 2026 and 2035.
The power EPC market is expected to witness significant growth to reach USD 49.42 Billion in 2035.
The market is categorised according to its type, which includes thermal, oil and gas, renewable, nuclear and others.
The key market players are Bechtel Corporation, Mitsubishi Heavy Industries, Ltd., EPCOM Power, Inc., McDermott International Ltd., Fluor Corporation, Blue Ridge Power, Quanta Services, Inc., The Shaw Group Inc., Sentry Electrical Group, Inc., Blattner Energy Inc., and others.
The market is driven by factors that include increasing energy demands due to population growth and industrialisation, government initiatives promoting renewable energy, technological advancements, supportive policies, among others.
The power EPC market is categorised according to its region, which includes New England, Mideast, Great Lakes, Plains, Southeast, Southwest, Rocky Mountain, and Far West.
Explore our key highlights of the report and gain a concise overview of key findings, trends, and actionable insights that will empower your strategic decisions.
| REPORT FEATURES | DETAILS |
| Base Year | 2025 |
| Historical Period | 2019-2025 |
| Forecast Period | 2026-2035 |
| Scope of the Report |
Historical and Forecast Trends, Industry Drivers and Constraints, Historical and Forecast Market Analysis by Segment:
|
| Breakup by Type |
|
| Breakup by Region |
|
| Market Dynamics |
|
| Competitive Landscape |
|
| Companies Covered |
|
Single User License
One User
USD 3,999
USD 3,599
tax inclusive*
Datasheet
One User
USD 2,499
USD 2,249
tax inclusive*
Five User License
Five User
USD 4,999
USD 4,249
tax inclusive*
Corporate License
Unlimited Users
USD 5,999
USD 5,099
tax inclusive*
*Please note that the prices mentioned below are starting prices for each bundle type. Kindly contact our team for further details.*
Flash Bundle
Small Business Bundle
Growth Bundle
Enterprise Bundle
*Please note that the prices mentioned below are starting prices for each bundle type. Kindly contact our team for further details.*
Flash Bundle
Number of Reports: 3
20%
tax inclusive*
Small Business Bundle
Number of Reports: 5
25%
tax inclusive*
Growth Bundle
Number of Reports: 8
30%
tax inclusive*
Enterprise Bundle
Number of Reports: 10
35%
tax inclusive*
How To Order

Select License Type
Choose the right license for your needs and access rights.

Click on ‘Buy Now’
Add the report to your cart with one click and proceed to register.

Select Mode of Payment
Choose a payment option for a secure checkout. You will be redirected accordingly.
Strategic Solutions for Informed Decision-Making
Gain insights to stay ahead and seize opportunities.

Get insights & trends for a competitive edge.

Track prices with detailed trend reports.

Analyse trade data for supply chain insights.

Leverage cost reports for smart savings

Enhance supply chain with partnerships.

Connect For More Information
Our expert team of analysts will offer full support and resolve any queries regarding the report, before and after the purchase.
Our expert team of analysts will offer full support and resolve any queries regarding the report, before and after the purchase.
We employ meticulous research methods, blending advanced analytics and expert insights to deliver accurate, actionable industry intelligence, staying ahead of competitors.
Our skilled analysts offer unparalleled competitive advantage with detailed insights on current and emerging markets, ensuring your strategic edge.
We offer an in-depth yet simplified presentation of industry insights and analysis to meet your specific requirements effectively.


