

Consumer Insights
Uncover trends and behaviors shaping consumer choices today
Procurement Insights
Optimize your sourcing strategy with key market data
Industry Stats
Stay ahead with the latest trends and market analysis.
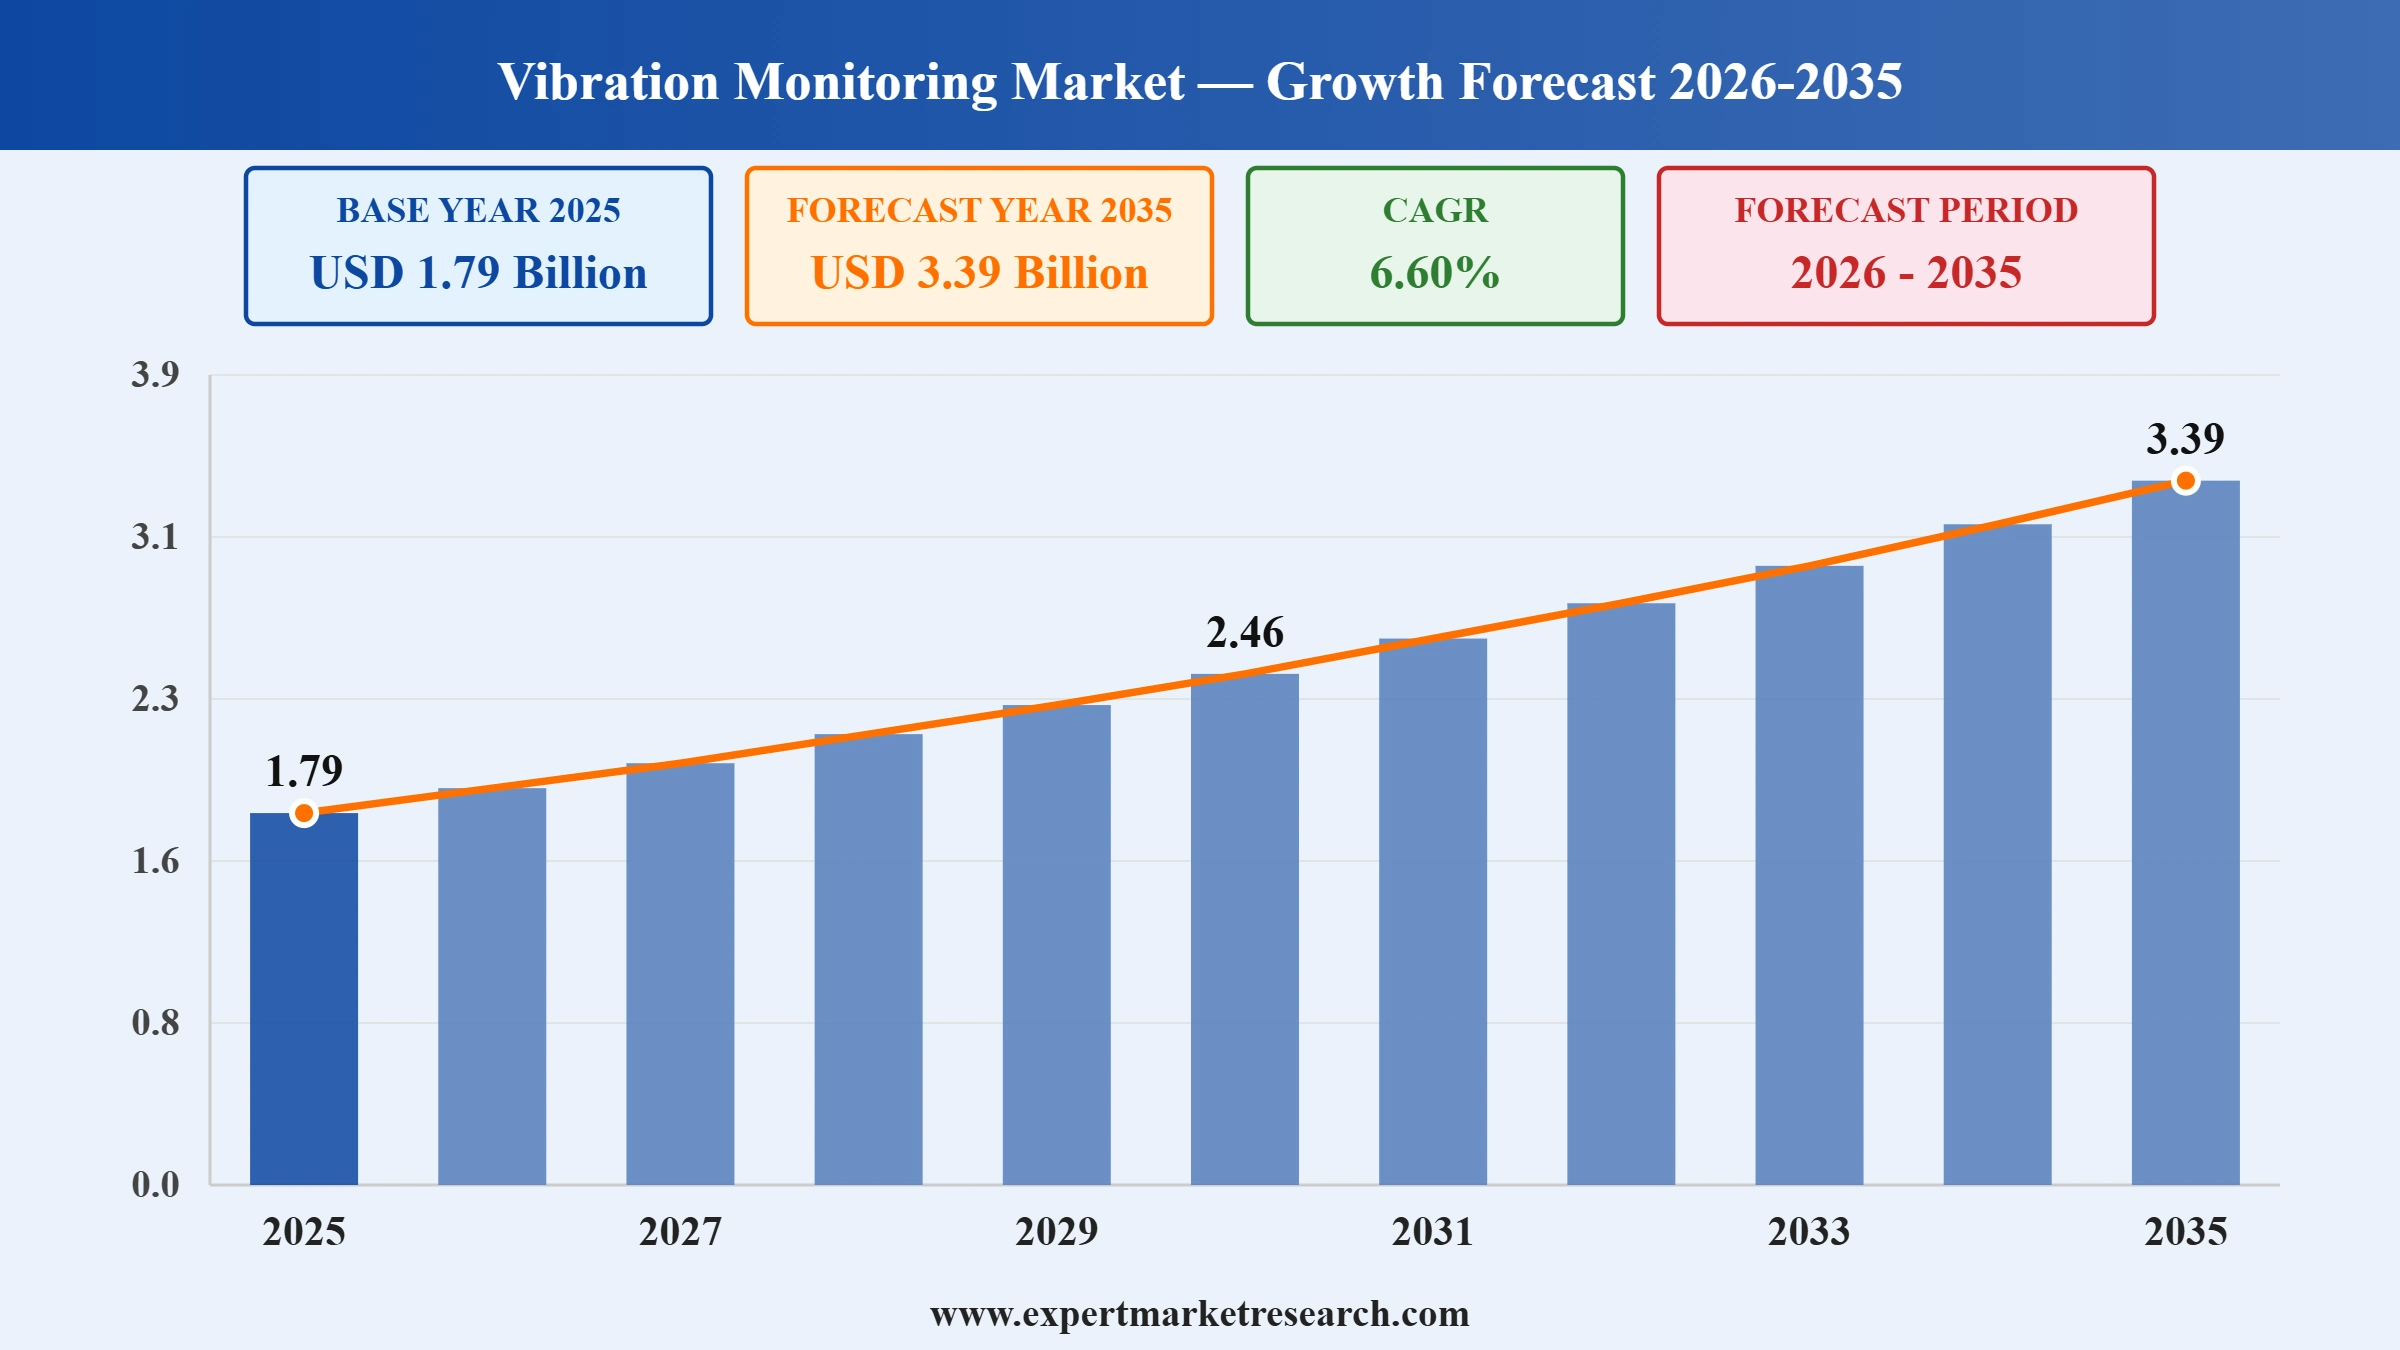
The global vibration monitoring market attained a value of USD 1.79 Billion in 2025 and is projected to expand at a CAGR of 6.60% through 2035. The market is further expected to achieve a value of USD 3.39 Billion by 2035. Falling MEMS sensor costs, embedded artificial intelligence processing, wireless deployment at scale and the shift from scheduled to condition-based maintenance are strengthening the vibration monitoring industry while making asset reliability programmes economically viable across a wider base of machinery.
The vibration monitoring market covers the sensors, instruments, software and services used to measure the mechanical oscillation of operating machinery and translate those measurements into an assessment of asset health. Accelerometers mounted on or near a machine capture amplitude, frequency and phase, and analysis of that signal reveals developing faults such as bearing wear, shaft misalignment, rotor imbalance, gear tooth damage, mechanical looseness and cavitation long before they progress to failure. The discipline applies mainly to rotating equipment, including steam and gas turbines, pumps, motors, compressors, fans, gearboxes and paper machines, where mechanical degradation follows recognisable signatures that a trained analyst or an algorithm can classify.
Deployment divides between permanently installed online systems that measure continuously on critical assets and portable instruments used for route-based inspection across larger populations of secondary equipment. The scope spans hardware covering accelerometers, transmitters and data acquisition units, software delivering trending, spectral analysis and fault diagnosis, and services ranging from data collection to reliability consulting for operators without in-house analysts. Demand is concentrated in production-intensive industries such as oil and gas, power generation, metals and mining, chemicals and manufacturing, where continuous operation means a single machine failure carries disproportionate cost, and selection turns on measurement fidelity, installed cost per asset, diagnostic accuracy and how readily the output integrates with maintenance planning systems.
Read more about this report - REQUEST FREE SAMPLE COPY IN PDF
There are two important reasons behind the growth of the global vibration monitoring market. First, sensor economics have changed decisively, as MEMS devices now deliver the bandwidth and noise performance that industrial diagnostics require at a fraction of the cost of traditional piezoelectric accelerometers, which extends monitoring beyond the critical assets that previously justified the expense. Second, production-intensive industries running continuous operations are shifting from scheduled maintenance to condition-based programmes, because unplanned failure carries higher repair costs, longer downtime and greater safety exposure than the monitoring investment required to prevent it.
The global vibration monitoring market is undergoing a structural change, with intelligence moving from the analysis workstation onto the sensor itself. This trend became more evident when STMicroelectronics launched the IIS3DWB10IS industrial MEMS vibration sensor with an integrated intelligent sensor processing unit in June 2026, measuring up to 200g across a bandwidth of 10 kHz and above with a 35 microg per root hertz noise floor, positioned explicitly as an alternative to piezoelectric sensors. Suppliers are consolidating diagnostic capability alongside, and in March 2026 SKF agreed to acquire G-Tech Instruments, a Taiwan-based condition monitoring and measuring instruments specialist with around USD 10 million in 2025 sales, to build an integrated detection and maintenance planning ecosystem.
The global vibration monitoring market is also undergoing transformation due to the integration of machinery health data into enterprise asset performance management, which changes how monitoring output is consumed. Vendors are connecting vibration platforms directly to maintenance execution rather than leaving diagnostics as a standalone discipline. For example, in January 2026, Emerson released the latest version of Aspen Mtell with direct connection to its AMS Machine Works and AMS Device Manager vibration monitoring solutions, adding artificial intelligence driven alert prioritisation. Wireless deployment and cloud analytics are simultaneously reducing the installation cost that previously limited coverage to the most critical rotating equipment.
Vibration monitoring is a system that uses sensors to monitor the movements of machines. Vibration monitoring systems use accelerometers to measure differences in amplitude, intensity, frequency vibration level, recording length, recording intervals of forces that can cause damage to assets. It is used mainly on rotating equipment such as steam and gas turbines, pumps, motors, compressors, and paper machines, among others.
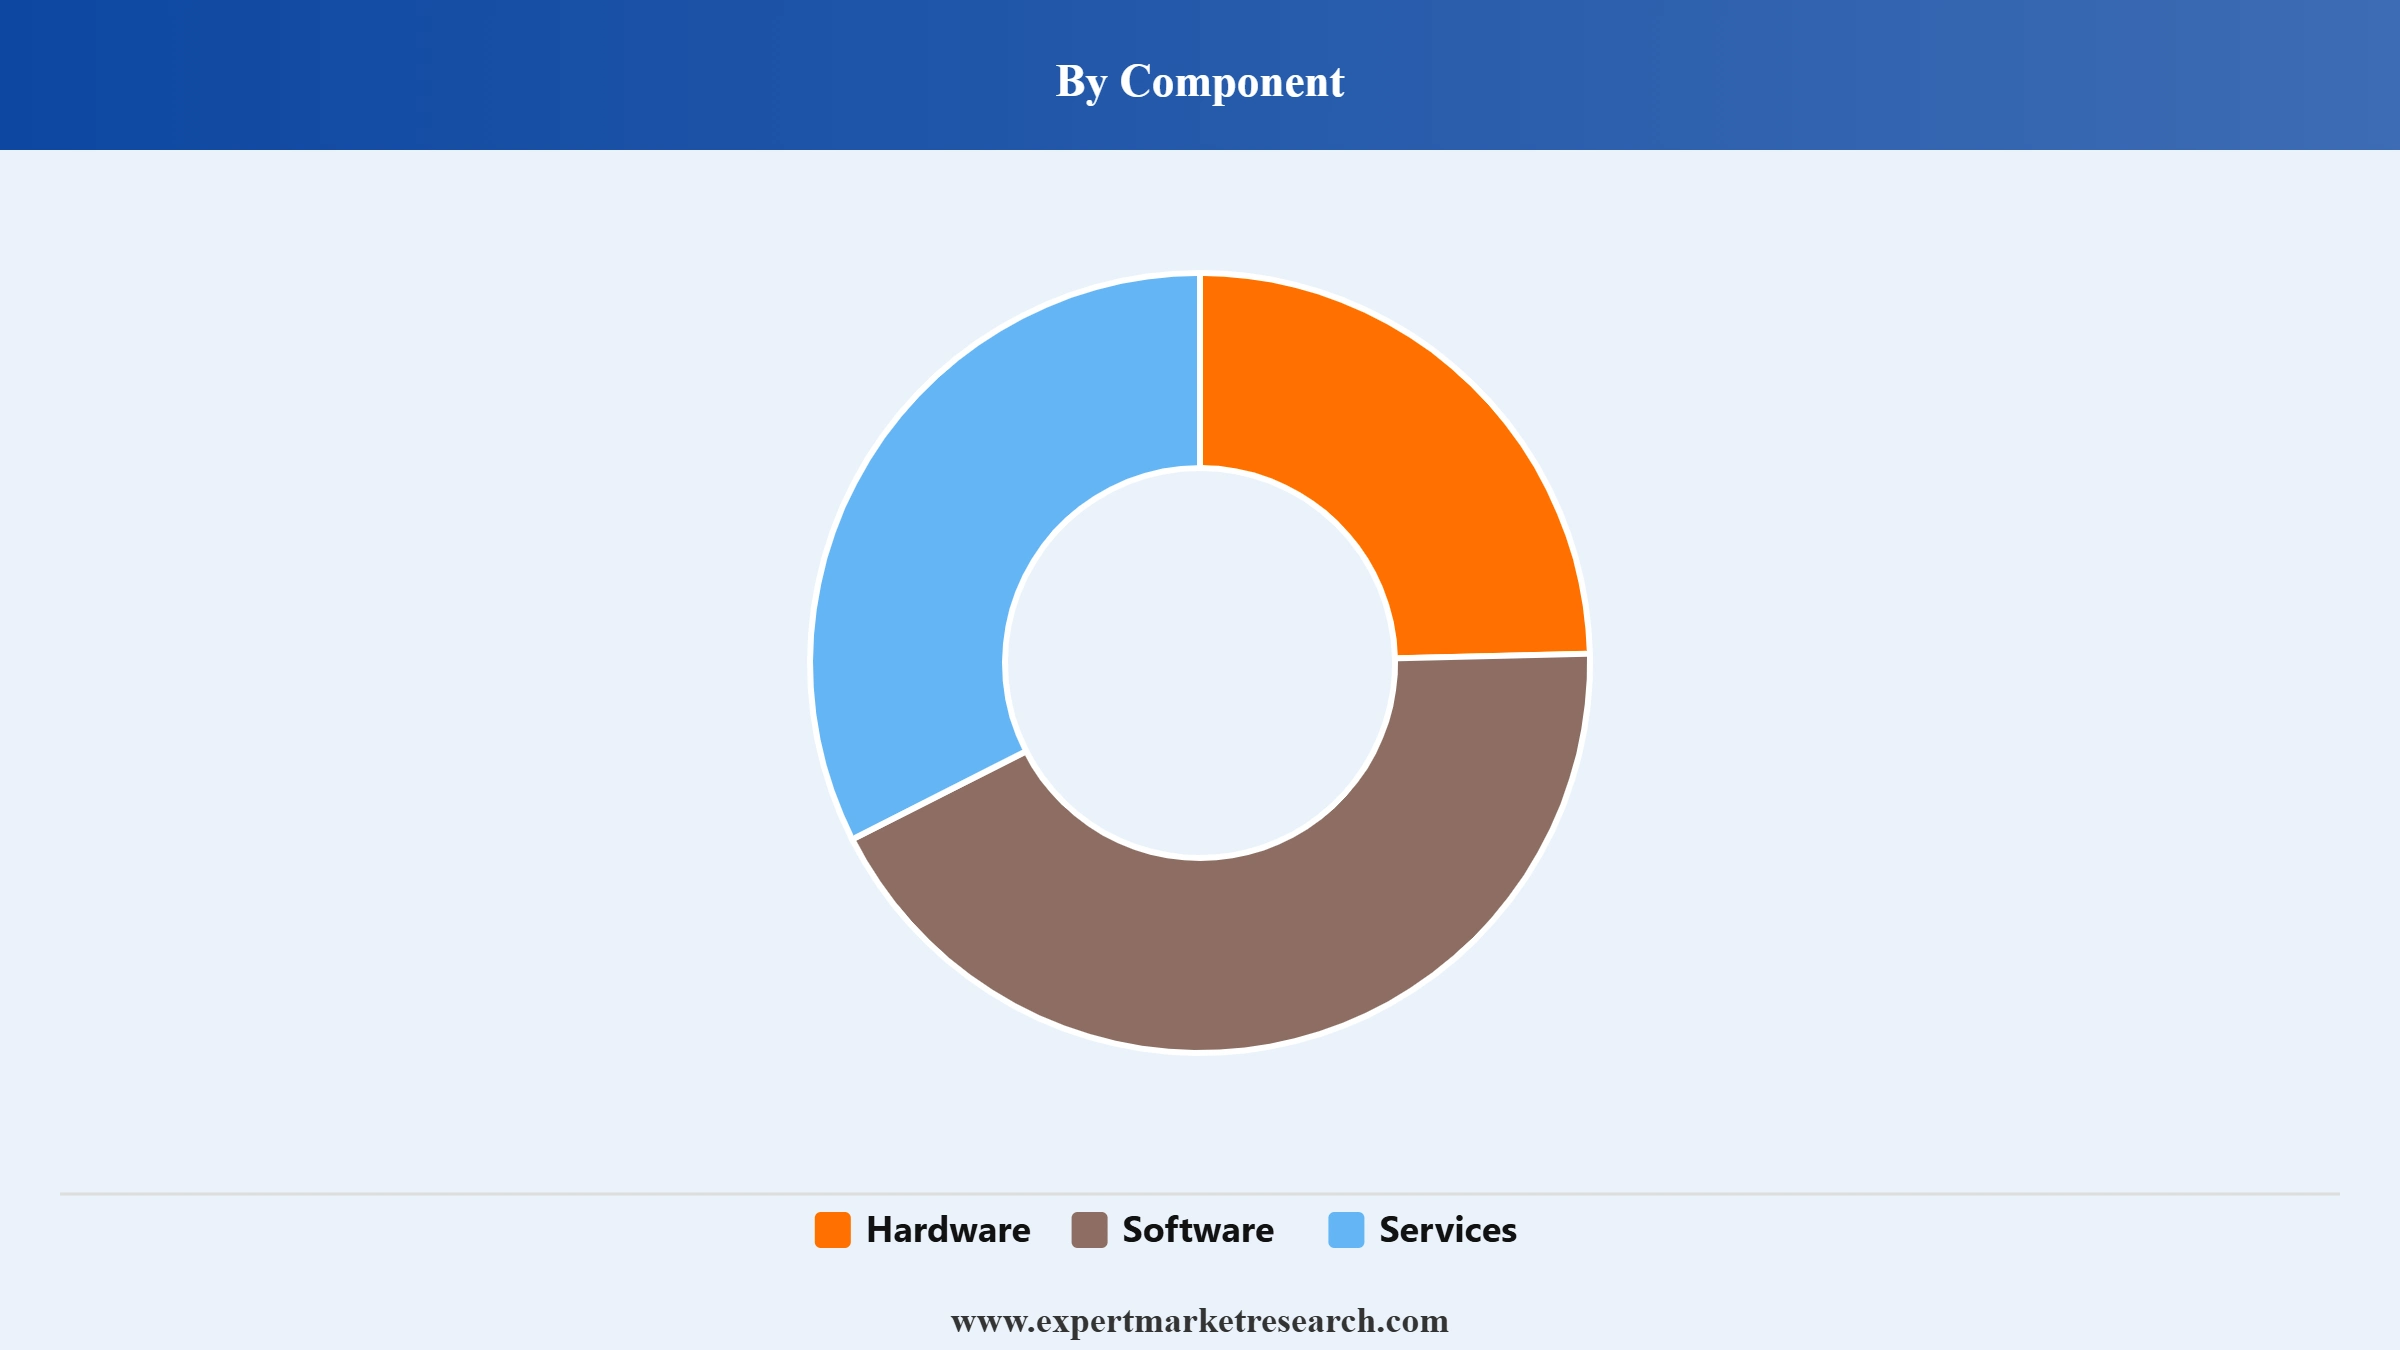
Market Breakup by Component
Key Insight: The component structure reflects how value is distributed across a condition monitoring programme within the global vibration monitoring market. Hardware holds the largest share, covering accelerometers, transmitters, data acquisition units and protection systems that physically capture machine behaviour, and sensor economics are improving rapidly as MEMS devices reach industrial specification at lower cost. Software is growing faster, since diagnostic value depends on analytics, trending and fault classification rather than measurement alone. Services remain essential where customers lack in-house vibration analysts, covering route-based data collection, diagnosis and reliability consulting.
Market Breakup by System Type
Key Insight: Embedded systems lead the system type segment because permanently installed monitoring is the only practical approach for critical machinery that must not be approached during operation or that fails without warning between inspection intervals. Vibration analysers serve reliability specialists performing detailed fault diagnosis, spectral analysis and balancing work, and remain the instrument of choice for root cause investigation. Vibration meters occupy the entry level, providing overall level readings for screening purposes. SKF strengthened this portfolio through its March 2026 agreement to acquire G-Tech Instruments, which supplies analysers and diagnostic tools.
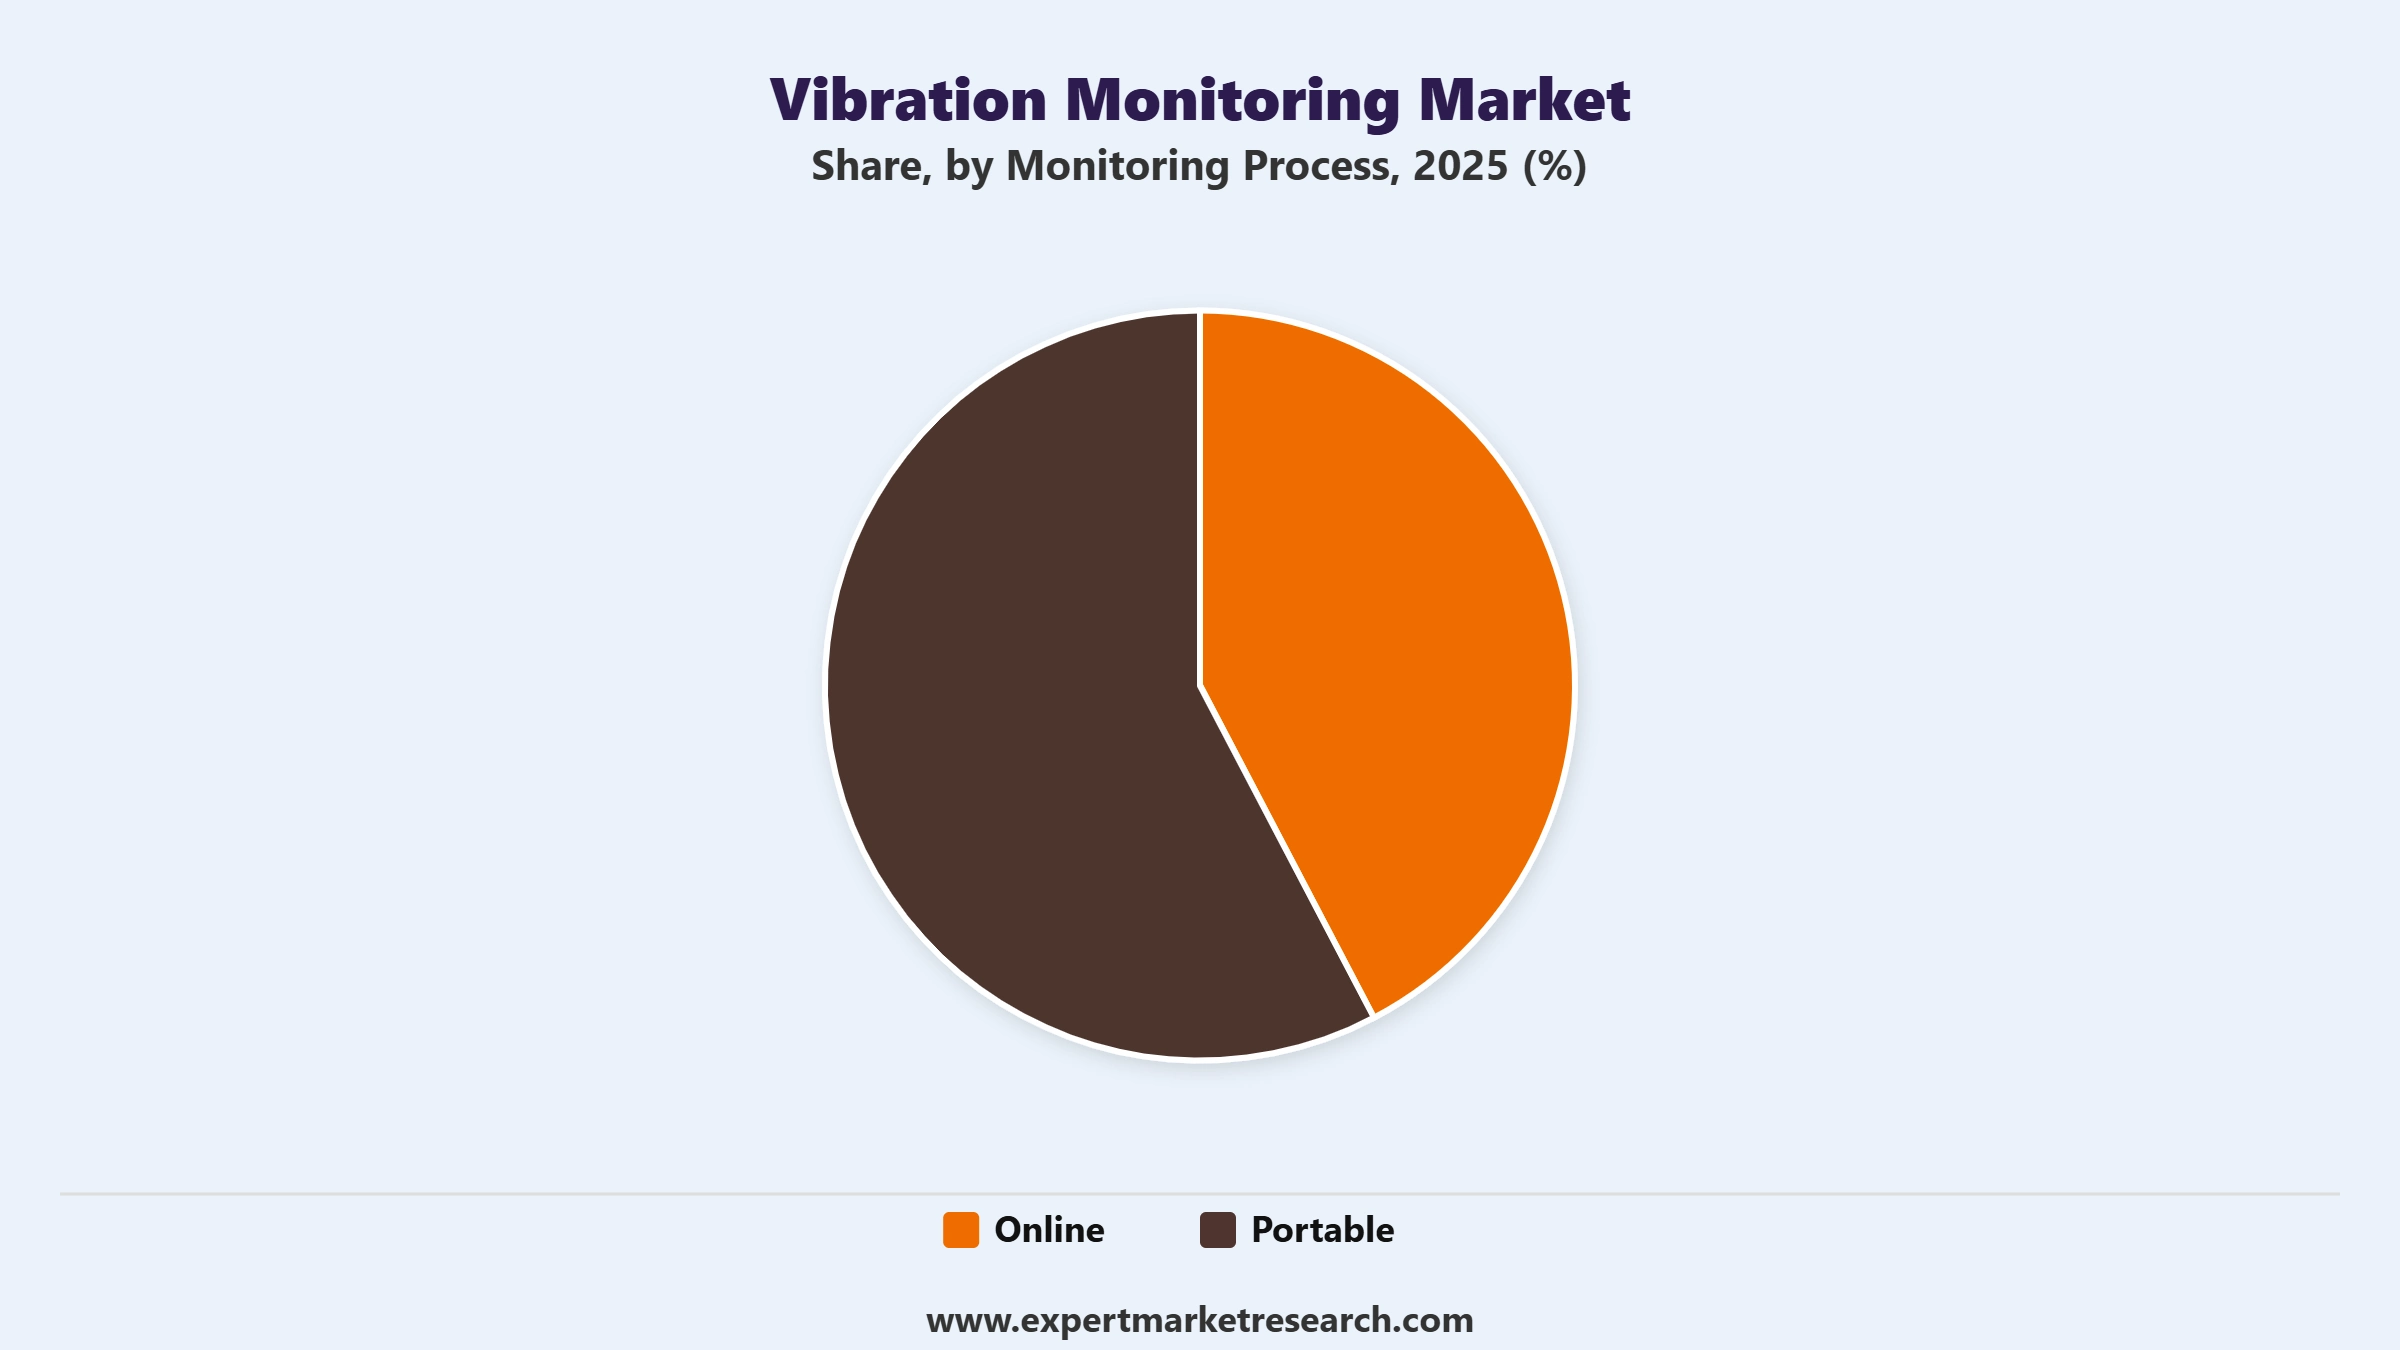
Market Breakup by Monitoring Process
Key Insight: Online monitoring dominates the process segment in production-intensive industries such as oil and gas, power generation and mining, where continuous operation means that failure of a single machine causes disproportionate loss. Continuous measurement detects developing faults between what would otherwise be inspection intervals, and wireless installation has reduced the cabling cost that previously restricted coverage. Portable monitoring retains a substantial position for route-based programmes across large populations of secondary assets, where periodic screening is sufficient and the capital cost of permanent instrumentation cannot be justified.
Market Breakup by End Use
Key Insight: As per the global vibration monitoring market report, oil and gas continues to account for a significant share owing to continuous processing operations, safety-critical rotating equipment and sustained pressure to reduce operating costs and unplanned downtime. Energy and power is expanding as renewable generation adds monitoring requirements distinct from thermal plant, supported by the publication of ISO 20816-21 for horizontal axis wind turbines. Metal and mining depends on heavy crushing, grinding and conveying equipment operating in harsh conditions, while automotive and food and beverages apply monitoring to maintain line availability and product consistency.
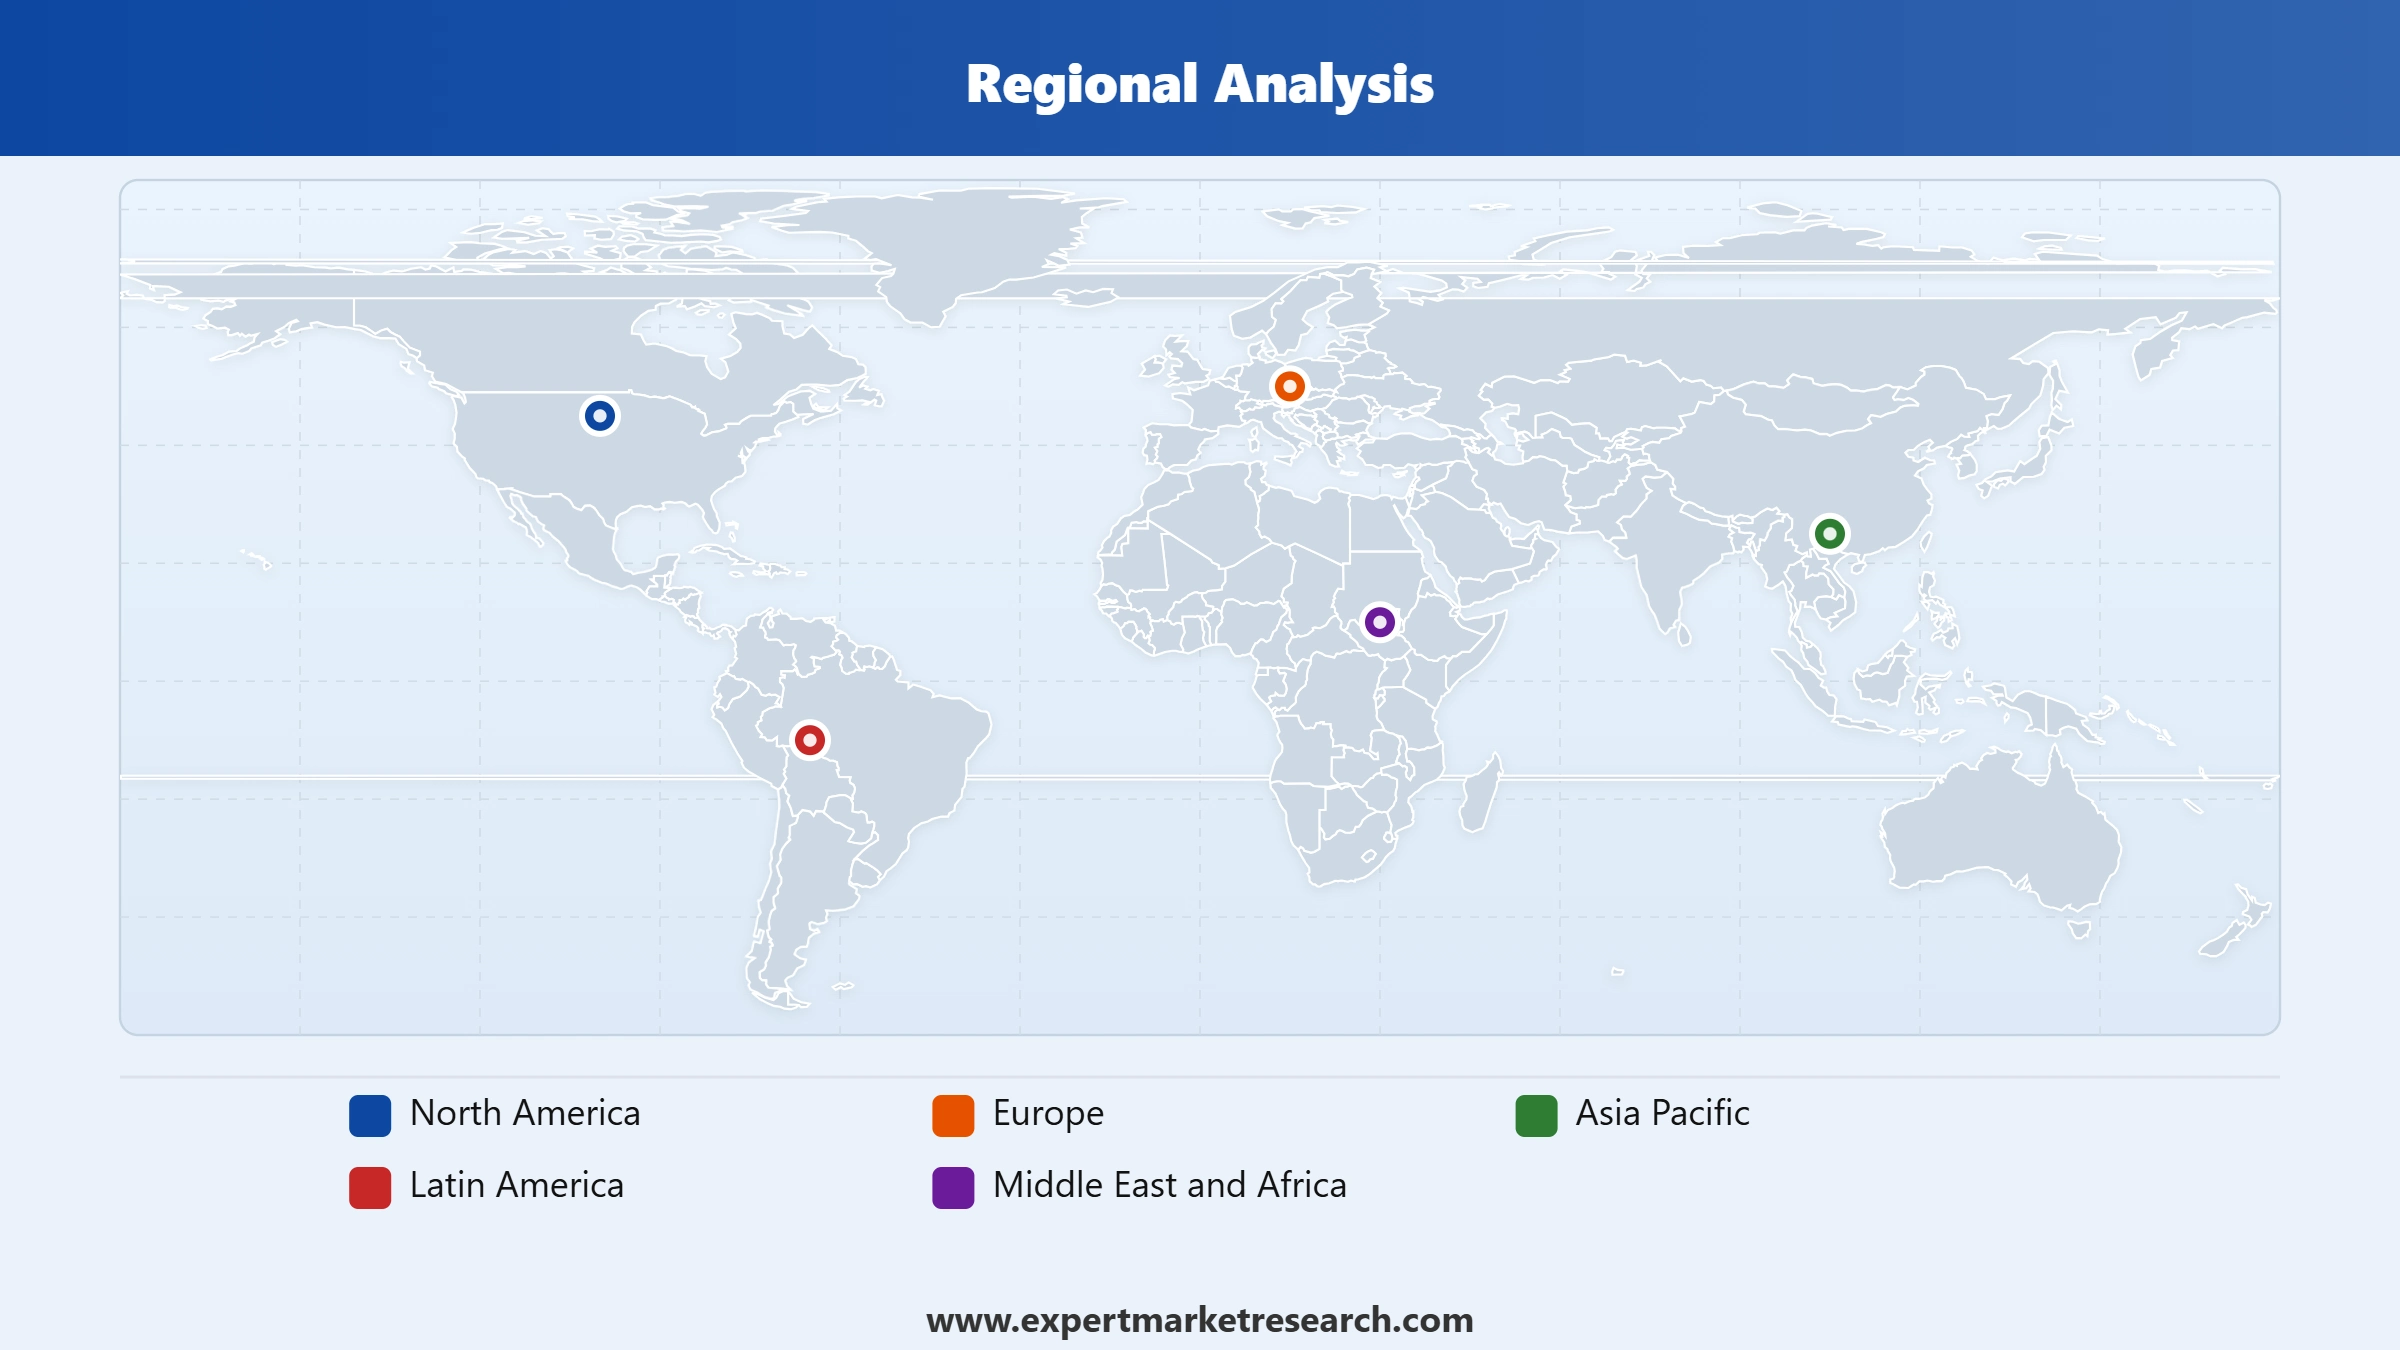
Market Breakup by Region
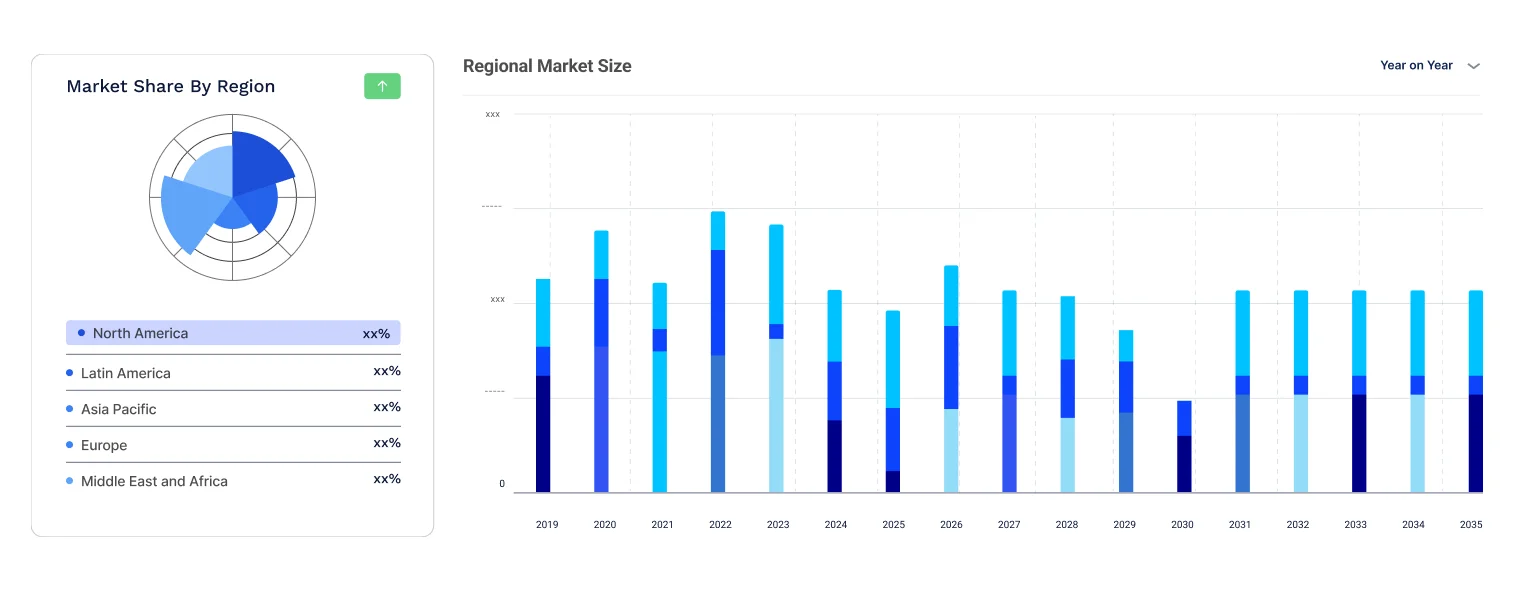
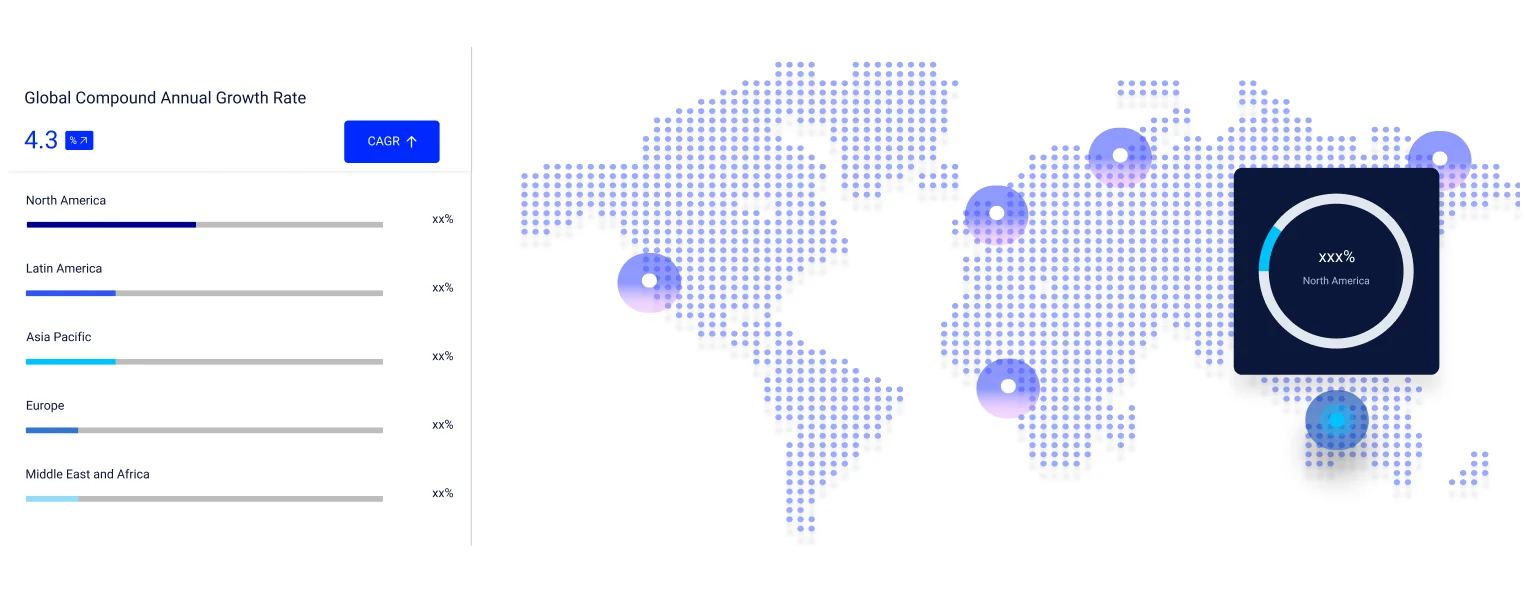
Key Insight: Regional demand differs depending on industrial base composition, maintenance practice maturity and capital investment cycles. North America holds the leading position through established reliability engineering practice, a large installed base of process industry assets and early adoption of predictive maintenance programmes. Europe is supported by manufacturing density, offshore wind development and standards-driven compliance. Asia Pacific is the fastest-growing region on the strength of manufacturing capacity additions, power generation build-out and increasing supplier presence, illustrated by SKF acquiring a Taiwan-based condition monitoring specialist in March 2026.
Read more about this report - REQUEST FREE SAMPLE COPY IN PDF
By component, hardware dominates the market due to extensive sensor and data acquisition deployment
Hardware takes up the largest share of the global vibration monitoring market, since every monitoring programme requires accelerometers, transmitters, junction boxes, data acquisition modules and in many cases machinery protection systems before any analysis can occur. Falling MEMS device cost is expanding rather than eroding this position, because cheaper sensors extend instrumentation to machines previously left unmonitored. Aligning with this trend, in June 2026, STMicroelectronics launched the IIS3DWB10IS at USD 25 per unit in 1,000 piece orders, offering 200g measurement range and bandwidth of 10 kHz and above in a 4.5 by 4.5 by 1.5 millimetre package.
Software is growing at an accelerated pace because diagnostic outcomes depend on analytics rather than measurement alone, and buyers increasingly evaluate suppliers on fault classification accuracy, trending capability and integration with maintenance systems. Artificial intelligence is raising the value attached to this layer, both at the edge through on-sensor inference and at the enterprise level through alert prioritisation. Emerson connected its AMS Machine Works and AMS Device Manager solutions with Aspen Mtell in January 2026, reflecting buyer expectation that vibration data should reach maintenance execution rather than terminate in a diagnostic report.
By monitoring process, online systems dominate the market owing to continuous operation requirements in process industries
Online monitoring accounts for the largest share of the global vibration monitoring market, as production-intensive industries operating around the clock cannot rely on periodic inspection to detect faults that develop over days. Failure of critical rotating equipment in these settings results in complete production loss, high repair costs and an unsafe working environment, which justifies permanent instrumentation on turbines, compressors, pumps and large motors. Wireless sensor deployment and improved battery life are reducing installation cost, allowing continuous coverage to extend beyond the small population of assets that previously warranted hard-wired systems.
The portable category retains a substantial position in the global vibration monitoring market, serving route-based programmes where reliability technicians collect readings across large populations of balance-of-plant equipment at scheduled intervals. This approach suits assets whose failure is inconvenient rather than catastrophic, and it supports detailed diagnostic work that follows an online system alarm. Vibration analysers used in this mode remain the primary tool for root cause investigation, spectral analysis and field balancing.
North America accounts for the largest market share through mature reliability practice and a large process industry asset base
The global vibration monitoring market continues to be led by North America due to the concentration of oil and gas, chemicals, power generation and heavy manufacturing assets, combined with reliability engineering practice that adopted condition-based maintenance earlier than most regions. The United States and Canada host large populations of ageing rotating equipment where monitoring extends asset life and defers capital replacement, and the region has an established base of certified vibration analysts supporting both in-house and outsourced programmes. Pressure to reduce operating cost across the energy sector continues to sustain investment in monitoring systems that reduce unplanned downtime.
The Asia Pacific vibration monitoring market is witnessing the fastest growth due to manufacturing capacity additions, power generation build-out and expanding industrial automation across China, India, Japan and South Korea. Suppliers are strengthening regional presence to serve this demand, illustrated by SKF agreeing in March 2026 to acquire Taiwan-headquartered G-Tech Instruments, which brings vibration analysers and diagnostic tools alongside an established Asian customer base. Europe presents a distinct dynamic where offshore wind development and standards-driven compliance shape requirements, supported by the publication of ISO 20816-21 for horizontal axis wind turbines.
Competition is shifting towards integrated ecosystems, embedded intelligence and maintenance workflow connection as opposed to sensor accuracy alone. Vibration monitoring companies are building portfolios that span detection, diagnosis and planning, adding artificial intelligence capability at both the sensor and enterprise level to reduce the analyst effort each installed asset requires.
Leading global vibration monitoring market players are also pursuing acquisitions to consolidate diagnostic technology and secure regional distribution, as demonstrated by SKF agreeing to acquire G-Tech Instruments in March 2026. One more important issue that players are addressing is the alarm burden that condition monitoring creates, with vendors introducing prioritisation logic so that reliability teams act on the alerts that matter. Semiconductor suppliers are simultaneously changing the competitive base of the market by delivering industrial-grade MEMS sensors with on-device processing at price points that open new application segments.
SKF AB was founded in 1907 and operates from its headquarters in Gothenburg, Sweden. The company supplies bearings alongside a broad condition monitoring portfolio covering wireless sensors, online surveillance systems and diagnostic software, and it agreed in March 2026 to acquire G-Tech Instruments to strengthen its analyser and diagnostic tool capability.
Emerson Electric was established in 1890 and is headquartered in St. Louis, Missouri, United States. The company delivers machinery health management through its AMS Machine Works and AMS Device Manager platforms, and in January 2026 connected these vibration monitoring solutions directly with the AspenTech Aspen Mtell asset performance management application.
General Electric traces its origins to 1892 and operates from Boston, Massachusetts, United States. The company supplies machinery protection and condition monitoring systems widely deployed on turbines, compressors and large rotating equipment across power generation and process industries, with a substantial installed base in safety-critical applications.
Honeywell International was founded in 1906 and is headquartered in Charlotte, North Carolina, United States. The company provides vibration-based condition monitoring within its industrial automation portfolio, focusing on wireless deployment across process plant assets where cabling cost has historically limited monitoring coverage.
Other key players in the market include Meggitt PLC, Rockwell Automation Inc., among others.
*Please note that this is only a partial list; the complete list of key players is available in the full report. Additionally, the list of key players can be customized to better suit your needs.*
Unlock the latest insights with our global vibration monitoring market trends 2026 report. Discover regional growth patterns, end use requirements, and key industry players. Stay ahead of competition with trusted data and expert analysis. Download your free sample report today and drive informed decisions in the market.


Upto 15% Off
USD
$2499 $2249
$3999 $3599
$4999 $4249
$5999 $5099


*While we strive to always give you current and accurate information, the numbers depicted on the website are indicative and may differ from the actual numbers in the main report. At Expert Market Research, we aim to bring you the latest insights and trends in the market. Using our analyses and forecasts, stakeholders can understand the market dynamics, navigate challenges, and capitalize on opportunities to make data-driven strategic decisions.*
In 2025, the market attained a value of approximately USD 1.79 Billion.
The market is projected to grow at a CAGR of 6.60% between 2026 and 2035.
The market is estimated to witness a healthy growth in the forecast period of 2026-2035 to reach about USD 3.39 Billion by 2035.
The market is being driven by the rapid industrialisation, rising demand from end use sectors, and increasing applications of vibration monitoring.
The key trends of the market include the emergence of online vibration monitoring and increasing technological advancements in the market.
The major regions in the market are North America, Latin America, the Middle East and Africa, Europe, and the Asia Pacific.
The leading components of vibration monitoring are hardware, software, and services.
The significant system types in the market are embedded systems, vibration analysers, and vibration meters.
The different monitoring processes available in the market are online and portable.
The various end uses of vibration monitoring are energy and power, metal and mining, oil and gas, automotive, and food and beverages, among others.
The key players in the global vibration monitoring market are SKF AB, General Electrics, Meggitt PLC, Emerson Electric Co., Rockwell Automation INC., and Honeywell International Inc., among others.
Explore our key highlights of the report and gain a concise overview of key findings, trends, and actionable insights that will empower your strategic decisions.
| REPORT FEATURES | DETAILS |
| Base Year | 2025 |
| Historical Period | 2019-2025 |
| Forecast Period | 2026-2035 |
| Scope of the Report |
Historical and Forecast Trends, Industry Drivers and Constraints, Historical and Forecast Market Analysis by Segment:
|
| Breakup by Component |
|
| Breakup by System Type |
|
| Breakup by Monitoring Process |
|
| Breakup by End Use |
|
| Breakup by Region |
|
| Market Dynamics |
|
| Competitive Landscape |
|
| Companies Covered |
|
| Report Price and Purchase Option | Explore our purchase options that are best suited to your resources and industry needs. |
| Delivery Format | Delivered as an attached PDF and Excel through email, with an option of receiving an editable PPT, according to the purchase option. |
Datasheet
One User
USD 2,499
USD 2,249
tax inclusive*
Single User License
One User
USD 3,999
USD 3,599
tax inclusive*
Five User License
Five User
USD 4,999
USD 4,249
tax inclusive*
Corporate License
Unlimited Users
USD 5,999
USD 5,099
tax inclusive*
*Please note that the prices mentioned below are starting prices for each bundle type. Kindly contact our team for further details.*
Flash Bundle
Small Business Bundle
Growth Bundle
Enterprise Bundle
*Please note that the prices mentioned below are starting prices for each bundle type. Kindly contact our team for further details.*
Flash Bundle
Number of Reports: 3
20%
tax inclusive*
Small Business Bundle
Number of Reports: 5
25%
tax inclusive*
Growth Bundle
Number of Reports: 8
30%
tax inclusive*
Enterprise Bundle
Number of Reports: 10
35%
tax inclusive*
How To Order

Select License Type
Choose the right license for your needs and access rights.

Click on ‘Buy Now’
Add the report to your cart with one click and proceed to register.

Select Mode of Payment
Choose a payment option for a secure checkout. You will be redirected accordingly.
Strategic Solutions for Informed Decision-Making
Gain insights to stay ahead and seize opportunities.

Get insights & trends for a competitive edge.

Track prices with detailed trend reports.

Analyse trade data for supply chain insights.

Leverage cost reports for smart savings

Enhance supply chain with partnerships.

Connect For More Information
Our expert team of analysts will offer full support and resolve any queries regarding the report, before and after the purchase.
Our expert team of analysts will offer full support and resolve any queries regarding the report, before and after the purchase.
We employ meticulous research methods, blending advanced analytics and expert insights to deliver accurate, actionable industry intelligence, staying ahead of competitors.
Our skilled analysts offer unparalleled competitive advantage with detailed insights on current and emerging markets, ensuring your strategic edge.
We offer an in-depth yet simplified presentation of industry insights and analysis to meet your specific requirements effectively.




