

Consumer Insights
Uncover trends and behaviors shaping consumer choices today
Procurement Insights
Optimize your sourcing strategy with key market data
Industry Stats
Stay ahead with the latest trends and market analysis.
The vibration sensor market size reached around USD 5.14 Billion in 2025. The market is projected to grow at a CAGR of 8.00% between 2026 and 2035 to reach nearly USD 11.10 Billion by 2035.
Compound Annual Growth Rate
8%
Value in USD Billion
2026-2035
Read more about this report - REQUEST FREE SAMPLE COPY IN PDF
| Global Vibration Sensor Market Report Summary | Description | Value |
| Base Year | USD Billion | 2025 |
| Historical Period | USD Billion | 2019-2025 |
| Forecast Period | USD Billion | 2026-2035 |
| Market Size 2025 | USD Billion | 5.14 |
| Market Size 2035 | USD Billion | 11.10 |
| CAGR 2019-2025 | Percentage | XX% |
| CAGR 2026-2035 | Percentage | 8.00% |
| CAGR 2026-2035 - Market by Region | Latin America | 7.6% |
| CAGR 2026-2035 - Market by Country | USA | 6.5% |
| CAGR 2026-2035 - Market by Country | UK | 6.2% |
| CAGR 2026-2035 - Market by Type | Accelerometer | 9.0% |
| CAGR 2026-2035 - Market by Application | Consumer Electronics | 9.1% |
| Market Share by Country | Italy | 3.4% |
The growth of the vibration sensor market is being driven by the development of advanced tools, and the growing need to monitor the condition of different components and improve the productivity of machines.
The global market is anticipated to experience a healthy growth over the forecast period due to the growing demand for cost-effective maintenance and the growth in asset utilization. Vibration analysis is used to determine the condition of equipment. The rapid urbanisation and industrialisation, particularly in emerging nations, is expected to drive the expansion of the vibration sensor industry over the forecast period. The need to increase productivity and efficiency, with the growing demand to cut down maintenance cost is aiding the industry growth. The thriving oil and gas and automotive sector are expected to support the industry growth further.
The declining prices of MEMS accelerometers are expected to have a positive impact on the industry growth. Region-wise, the Asia Pacific is expected to lead the global vibration sensor industry over the forecast period owing to the growing adoption of industrial IoT (IIoT) in the region coupled with the rising preference for wireless sensor network technology.
The integration of IoT and IIoT technologies in the vibration sensor has allowed for real-time monitoring and analysis of equipment performance. By connecting vibration sensors to the internet, companies can now remotely monitor their machinery's health and condition, detecting potential issues before they become costly breakdowns in the future.
Worldsensing announced the launch of its newest wireless sensor, the Vibration Meter in 2023. This device uses a tri-axial accelerometer to gauge vibrations, offering a long battery life, wide communications range, and a more competitive price compared to similar products.
Rising Adoption of Renewable Energy and the IoT Technology
In 2020, renewable energy sources accounted for 28.1% of global electricity generation. Hydropower was the largest contributor at 16.3%, followed by wind at 6.0% and solar PV at 3.1%. In 2022, all renewables made up 29.5% of global electricity generation. As per the vibration sensor industry analysis, hydropower accounted for 15%, while wind and solar PV contributed 7.3% and 4.5% respectively. In 2024, hydropower is expected to remain a dominant power source at 15.1%, while wind energy is expected to account for 8.6% and solar PV 6.7% of renewable energy power. In 2028, renewable energy was expected to account for 41.6% of global electricity generation which can increase the vibration sensor industry revenue. Solar PV is expected to contribute around 12.6%, and wind energy around 12.1%. Hydropower's share will decrease slightly to 13.9%. The transition towards renewable energy, such as solar and wind aids the demand for vibration sensors, which are critical for monitoring and maintaining the performance of wind turbines and solar panels, ensuring their efficiency and longevity.
In 2020, Industry 4.0 adoption varied significantly across regions. North America led with a 36% adoption rate, driven by major companies like General Electric, Boeing, and Tesla. Popular vendors in this region included Microsoft, IBM, and AWS, which provide crucial technologies supporting Industry 4.0 implementation and promotes the growth of the vibration sensor industry. Europe followed with a 27% adoption rate, with Siemens, ABB, and Schneider Electric being the leading adopters. These companies are noted for their extensive use of automation and digitalization in manufacturing. The most popular vendors in Europe were ABB, Siemens, and SAP, which are integral to the region's smart manufacturing infrastructure. Asia, particularly China, had a 20% adoption rate, led by companies like Toyota, Huawei, and Foxconn. These companies have been pivotal in integrating advanced manufacturing technologies and IoT solutions.
Key vendors in Asia included Huawei, Alibaba Group, and Fanuc, which provide the necessary technology for Industry 4.0 advancements. From 2018 to 2024, the number of Internet of Things (IoT) connections in the United Kingdom is projected to grow significantly, reaching 155.7 million by 2024 from 31.4 million in 2018. Key sectors contributing to this growth include automotive, manufacturing, FMCG, utilities, and smart cities. The increase in Industry 4.0 adoption correlates with the rising demand for vibration sensors. These sensors are crucial for monitoring machinery health, predicting maintenance needs, and ensuring operational efficiency.
Read more about this report - REQUEST FREE SAMPLE COPY IN PDF
Vibration monitoring refers to the quality measurement phenomenon in modern industrial infrastructure. Vibrations help us know about the machine condition; for example, abnormal vibration level is indicative of problems in an industrial machine, which, if detected early, can be repaired before the event of machine failure. The global vibration sensor industry can be divided based on segments like types, applications, and regions.
Breakup by Type
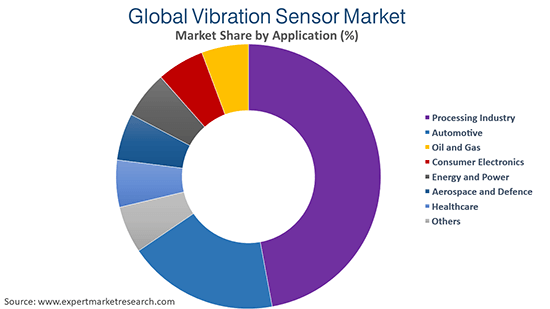
Breakup by Application
Breakup by Region
| CAGR 2026-2035 - Market by | Type |
| Accelerometer | 9.0% |
| Electromagnetic Velocity Sensor | 7.4% |
| Non-contact Displacement Sensor | XX% |
| CAGR 2026-2035 - Market by | Application |
| Consumer Electronics | 9.1% |
| Energy and Power | 8.3% |
| Processing Industry | 8.1% |
| Automotive | XX% |
| Oil and Gas | XX% |
| Others | XX% |
| CAGR 2026-2035 - Market by | Region |
| Latin America | 7.6% |
| Europe | 6.1% |
| North America | XX% |
| Asia Pacific | XX% |
| Middle East and Africa | XX% |
| CAGR 2026-2035 - Market by | Country |
| USA | 6.5% |
| Brazil | 6.3% |
| UK | 6.2% |
| Germany | 5.9% |
| Australia | 5.7% |
| Canada | XX% |
| France | XX% |
| Italy | XX% |
| China | XX% |
| Japan | 5.5% |
| India | XX% |
| Saudi Arabia | XX% |
| Mexico | XX% |


North America, especially the United States, consists of a robust industrial sector as well as high-end technologies for industrial automation and machinery condition monitoring. This region also serves as a centre for technological advancements, with rising investments in research and development of sensor technologies such as vibration sensors.
| Market Share by | Country |
| Italy | 3.4% |
| USA | XX% |
| Canada | XX% |
| UK | XX% |
The report presents a detailed analysis of the following key players in the global vibration sensor market, looking into their capacity, market shares, and latest developments like capacity expansions, plant turnarounds, and mergers and acquisitions:
The EMR report gives an in-depth insight into the vibration sensor market by providing a SWOT analysis as well as an analysis of Porter’s Five Forces model.
Upto 15% Off
USD
$2499 $2249
$3999 $3599
$4999 $4249
$5999 $5099


*While we strive to always give you current and accurate information, the numbers depicted on the website are indicative and may differ from the actual numbers in the main report. At Expert Market Research, we aim to bring you the latest insights and trends in the market. Using our analyses and forecasts, stakeholders can understand the market dynamics, navigate challenges, and capitalize on opportunities to make data-driven strategic decisions.*
In 2025, the market attained a value of nearly USD 5.14 Billion.
The market is assessed to grow at a CAGR of 8.00% between 2026 and 2035.
The market is estimated to witness a healthy growth in the forecast period of 2026-2035 to reach about USD 11.10 Billion by 2035.
The major drivers of the market are rising disposable incomes, increasing population, and growing need to monitor the condition of different components.
The key trends guiding the growth of the vibration sensor market include the increase in productivity and efficiency of machines and the development of advanced tools.
The major regions in the market are North America, Latin America, the Middle East and Africa, Europe, and the Asia Pacific.
Accelerometer, electromagnetic velocity sensor, and non-contact displacement sensor are the leading types of vibration sensors in the market.
Processing industry, automotive, oil and gas, consumer electronics, energy and power, aerospace and defence, and healthcare, among others, are the significant applications of vibration sensors in the market.
The major players in the market are Analog Devices, Inc., Hansford Sensors Ltd, Honeywell International, Inc., Keyence Corporation, National Instruments Corporation, Bosch Sensortec GmbH, Safran Colibrys SA, and TE Connectivity Ltd, among others.
Explore our key highlights of the report and gain a concise overview of key findings, trends, and actionable insights that will empower your strategic decisions.
| REPORT FEATURES | DETAILS |
| Base Year | 2025 |
| Historical Period | 2019-2025 |
| Forecast Period | 2026-2035 |
| Scope of the Report |
Historical and Forecast Trends, Industry Drivers and Constraints, Historical and Forecast Market Analysis by Segment:
|
| Breakup by Type |
|
| Breakup by Application |
|
| Breakup by Region |
|
| Market Dynamics |
|
| Competitive Landscape |
|
| Companies Covered |
|
| Report Price and Purchase Option | Explore our purchase options that are best suited to your resources and industry needs. |
| Delivery Format | Delivered as an attached PDF and Excel through email, with an option of receiving an editable PPT, according to the purchase option. |
Datasheet
One User
USD 2,499
USD 2,249
tax inclusive*
Single User License
One User
USD 3,999
USD 3,599
tax inclusive*
Five User License
Five User
USD 4,999
USD 4,249
tax inclusive*
Corporate License
Unlimited Users
USD 5,999
USD 5,099
tax inclusive*
*Please note that the prices mentioned below are starting prices for each bundle type. Kindly contact our team for further details.*
Flash Bundle
Small Business Bundle
Growth Bundle
Enterprise Bundle
*Please note that the prices mentioned below are starting prices for each bundle type. Kindly contact our team for further details.*
Flash Bundle
Number of Reports: 3
20%
tax inclusive*
Small Business Bundle
Number of Reports: 5
25%
tax inclusive*
Growth Bundle
Number of Reports: 8
30%
tax inclusive*
Enterprise Bundle
Number of Reports: 10
35%
tax inclusive*
How To Order

Select License Type
Choose the right license for your needs and access rights.

Click on ‘Buy Now’
Add the report to your cart with one click and proceed to register.

Select Mode of Payment
Choose a payment option for a secure checkout. You will be redirected accordingly.
Strategic Solutions for Informed Decision-Making
Gain insights to stay ahead and seize opportunities.

Get insights & trends for a competitive edge.

Track prices with detailed trend reports.

Analyse trade data for supply chain insights.

Leverage cost reports for smart savings

Enhance supply chain with partnerships.

Connect For More Information
Our expert team of analysts will offer full support and resolve any queries regarding the report, before and after the purchase.
Our expert team of analysts will offer full support and resolve any queries regarding the report, before and after the purchase.
We employ meticulous research methods, blending advanced analytics and expert insights to deliver accurate, actionable industry intelligence, staying ahead of competitors.
Our skilled analysts offer unparalleled competitive advantage with detailed insights on current and emerging markets, ensuring your strategic edge.
We offer an in-depth yet simplified presentation of industry insights and analysis to meet your specific requirements effectively.


