

Consumer Insights
Uncover trends and behaviors shaping consumer choices today
Procurement Insights
Optimize your sourcing strategy with key market data
Industry Stats
Stay ahead with the latest trends and market analysis.
The global virtual reality market size attained a value of nearly USD 67.66 Billion in 2025. The market is further expected to grow at a CAGR of 26.40% during the forecast period of 2026-2035 to reach a value of USD 704.37 Billion by 2035. This remarkable expansion of the virtual reality market is being driven by accelerating adoption across healthcare, corporate training, retail, and defence sectors. Declining hardware costs for standalone headsets, paired with the global rollout of high-speed 5G networks, are steadily removing entry barriers for both consumers and enterprises. The convergence of spatial computing, AI-driven content generation, and haptic feedback technology is adding entirely new application layers to the ecosystem pushing the market well beyond its gaming origins.
Compound Annual Growth Rate
26.4%
Value in USD Billion
2026-2035
Read more about this report - REQUEST FREE SAMPLE COPY IN PDF
| Global Virtual Reality Market Report Summary | Description | Value |
| Base Year | USD Billion | 2025 |
| Historical Period | USD Billion | 2019-2025 |
| Forecast Period | USD Billion | 2026-2035 |
| Market Size 2025 | USD Billion | 67.66 |
| Market Size 2035 | USD Billion | 704.37 |
| CAGR 2019-2025 | Percentage | XX% |
| CAGR 2026-2035 | Percentage | 26.4% |
| CAGR 2026-2035 - Market by Region | Asia Pacific | 30.4% |
| CAGR 2026-2035 - Market by Country | India | 34.9% |
| CAGR 2026-2035 - Market by Country | China | 29.1% |
| CAGR 2026-2035 - Market by Technology | Semi and Fully Immersive | 29.3% |
| CAGR 2026-2035 - Market by Device | Head Mounted Display (HMD) | 29.4% |
| Market Share by Country 2025 | Japan | 4.3% |
North America, Europe, and Asia Pacific are likely to dominate the global industry in the forecast period. United States is expected to be the dominate the North American market. This is because of the remarkable activity of major key players in the nation. The United States government has also been investing in virtual reality and has started to adopt this technology across fields like military. The U.S. Department of Defense has been deploying immersive simulation environments for pilot training, battlefield preparedness, and surgical readiness programs, citing measurable improvements in both cost efficiency and mission outcomes. Beyond defence, leading technology companies across the country have expanded their enterprise VR divisions, targeting healthcare, architecture, and workforce development reinforcing the United States' position as the single largest national market within the global virtual reality market. China's 14th Five-Year Plan formally identified extended reality (XR) as a digital economy priority, channelling state-backed investment into domestic VR hardware manufacturing and content platforms. South Korea has piloted immersive VR applications in smart city planning and public education, while India's expanding technology startup ecosystem is producing original VR content focused on vocational training and e-learning broadening the regional virtual reality market beyond consumer entertainment.


Read more about this report - REQUEST FREE SAMPLE COPY IN PDF
Asia Pacific is also one of the leaders of virtual reality market. This is because of the technological developments in the developing economies. 5G connectivity is also increasingly being adopted in nations like Japan and China. Japanese government initiatives have also been favourable to virtual reality industry such as technological grants and funds to VR companies. Europe is also expected to witness significant growth in the coming years because of the technological advancements in the region. The United Kingdom government is also looking for virtual reality projects like virtual farmer market. Latin America and Africa will also register industry growth because of the increasing penetration of gaming and entertainment activities.
Read more about this report - REQUEST FREE SAMPLE COPY IN PDF
Virtual reality refers to an artificial 3-dimensional visual environment that is created through computer simulation. The user is also allowed to interact with the interface through sensory equipment like gloves, glasses, and headsets. This technology is used in gaming and entertainment industry for better customer experience. The virtual reality is also finding its use in diverse sectors such as medical, education, and corporate training. In clinical settings, peer-reviewed studies published in leading medical journals have validated the use of virtual reality for surgical simulation, phobia treatment, and chronic pain management — bringing credibility to its therapeutic applications. For enterprises, VR-based safety training and onboarding is delivering measurable ROI by reducing workplace incidents and compressing skill-development timelines. These cross-industry use cases signal a fundamental shift: the virtual reality market is no longer a niche technology it is becoming foundational infrastructure for how people learn, work, and receive care.
The components of virtual reality industry are classified as:
The hardware component is further segmented into sensors and semiconductor components, among others.
By technology, the virtual reality is categorised into:
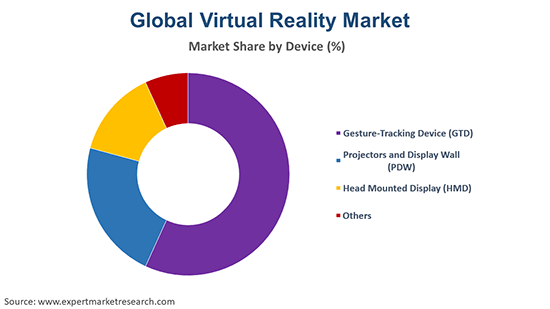
On the basis of device, the industry is segmented into the following:
Based on the end use, the virtual reality is classified into:
Market Breakup by Region
| CAGR 2026-2035 - Market by | Country |
| India | 34.9% |
| China | 29.1% |
| UK | 24.1% |
| USA | 23.5% |
| Germany | 21.7% |
| Canada | XX% |
| France | XX% |
| Italy | XX% |
| Japan | 18.2% |
| Australia | XX% |
| Saudi Arabia | XX% |
| Brazil | XX% |
| Mexico | XX% |
The coronavirus pandemic had led to decline in physical interactions and rapid growth of digital and virtual reality industry. The different industries are looking for virtual reality platforms for their working interface. Education and academia have increasingly adopted the virtual reality because of the closing down of educational institutions. Corporate and other trainings are also performed through virtual reality which is providing impetus to industry growth. Gaming and entertainment industry have been recognised the virtual reality potential earlier as the consumers base is swiftly increasing. Healthcare industry and military sectors are also recognising the virtual reality and investing for this technology. The arrival of 5G with faster information transfer will also propel the virtual reality market in the coming years.
The report gives a detailed analysis of the following key players in the virtual reality market, covering their competitive landscape, capacity, and latest developments like mergers, acquisitions, and investments, expansions of capacity, and plant turnarounds:
The comprehensive EMR report provides an in-depth assessment of the market based on the Porter's five forces model along with giving a SWOT analysis.
Upto 15% Off
USD
$2499 $2249
$3999 $3599
$4999 $4249
$5999 $5099


*While we strive to always give you current and accurate information, the numbers depicted on the website are indicative and may differ from the actual numbers in the main report. At Expert Market Research, we aim to bring you the latest insights and trends in the market. Using our analyses and forecasts, stakeholders can understand the market dynamics, navigate challenges, and capitalize on opportunities to make data-driven strategic decisions.*
In 2025, the global virtual reality market attained a value of nearly USD 67.66 Billion.
The market is projected to grow at a CAGR of 26.40% between 2026 and 2035.
The major drivers of the market include the arrival of 5G network, increasing investment in virtual reality, technological developments, and government initiatives.
The rapid growth of digital and virtual reality industry due to coronavirus pandemic and increasing gaming and entertainment industry are the key industry trends propelling the growth of the market.
The major regions in the industry are North America, Latin America, the Middle East and Africa, Europe, and the Asia Pacific.
Hardware, software, and content are the major components in the virtual reality market. The hardware component is further segmented into sensors and semiconductor components, among others.
By technology, the virtual reality is categorised into non-immersive, and semi and fully immersive.
On the basis of device, the industry is segmented into gesture-tracking device (GTD), projectors and display wall (PDW), and head mounted display (HMD), among others.
The end-uses include education, gaming, media and entertainment, healthcare, military and defence, and real estate, among others.
The major players in the industry are Google LLC, Sony Corporation, HTC Corporation, Samsung Electronics Co., Ltd., Facebook Technologies, LLC, Microsoft Corporation, Vuzix Corporation, and EON Reality Inc., among others.
The market is estimated to witness a healthy growth in the forecast period of 2026-2035 to reach USD 704.37 Billion by 2035.
Explore our key highlights of the report and gain a concise overview of key findings, trends, and actionable insights that will empower your strategic decisions.
| REPORT FEATURES | DETAILS |
| Base Year | 2025 |
| Historical Period | 2019-2025 |
| Forecast Period | 2026-2035 |
| Scope of the Report |
Historical and Forecast Trends, Industry Drivers and Constraints, Historical and Forecast Market Analysis by Segment:
|
| Breakup by Component |
|
| Breakup by Technology |
|
| Breakup by Device |
|
| Breakup by End Use |
|
| Breakup by Region |
|
| Market Dynamics |
|
| Competitive Landscape |
|
| Companies Covered |
|
| Report Price and Purchase Option | Explore our purchase options that are best suited to your resources and industry needs. |
| Delivery Format | Delivered as an attached PDF and Excel through email, with an option of receiving an editable PPT, according to the purchase option. |
Datasheet
One User
USD 2,499
USD 2,249
tax inclusive*
Single User License
One User
USD 3,999
USD 3,599
tax inclusive*
Five User License
Five User
USD 4,999
USD 4,249
tax inclusive*
Corporate License
Unlimited Users
USD 5,999
USD 5,099
tax inclusive*
*Please note that the prices mentioned below are starting prices for each bundle type. Kindly contact our team for further details.*
Flash Bundle
Small Business Bundle
Growth Bundle
Enterprise Bundle
*Please note that the prices mentioned below are starting prices for each bundle type. Kindly contact our team for further details.*
Flash Bundle
Number of Reports: 3
20%
tax inclusive*
Small Business Bundle
Number of Reports: 5
25%
tax inclusive*
Growth Bundle
Number of Reports: 8
30%
tax inclusive*
Enterprise Bundle
Number of Reports: 10
35%
tax inclusive*
How To Order

Select License Type
Choose the right license for your needs and access rights.

Click on ‘Buy Now’
Add the report to your cart with one click and proceed to register.

Select Mode of Payment
Choose a payment option for a secure checkout. You will be redirected accordingly.
Strategic Solutions for Informed Decision-Making
Gain insights to stay ahead and seize opportunities.

Get insights & trends for a competitive edge.

Track prices with detailed trend reports.

Analyse trade data for supply chain insights.

Leverage cost reports for smart savings

Enhance supply chain with partnerships.

Connect For More Information
Our expert team of analysts will offer full support and resolve any queries regarding the report, before and after the purchase.
Our expert team of analysts will offer full support and resolve any queries regarding the report, before and after the purchase.
We employ meticulous research methods, blending advanced analytics and expert insights to deliver accurate, actionable industry intelligence, staying ahead of competitors.
Our skilled analysts offer unparalleled competitive advantage with detailed insights on current and emerging markets, ensuring your strategic edge.
We offer an in-depth yet simplified presentation of industry insights and analysis to meet your specific requirements effectively.


