Explore Our Diverse Range Of Offerings
From detailed reports to experts services offered in 15+ Industry Domains
Report
Press Release
Blogs
Industry Statistics
Add 2 More Reports For 20% off

Webcam Market Report Overview

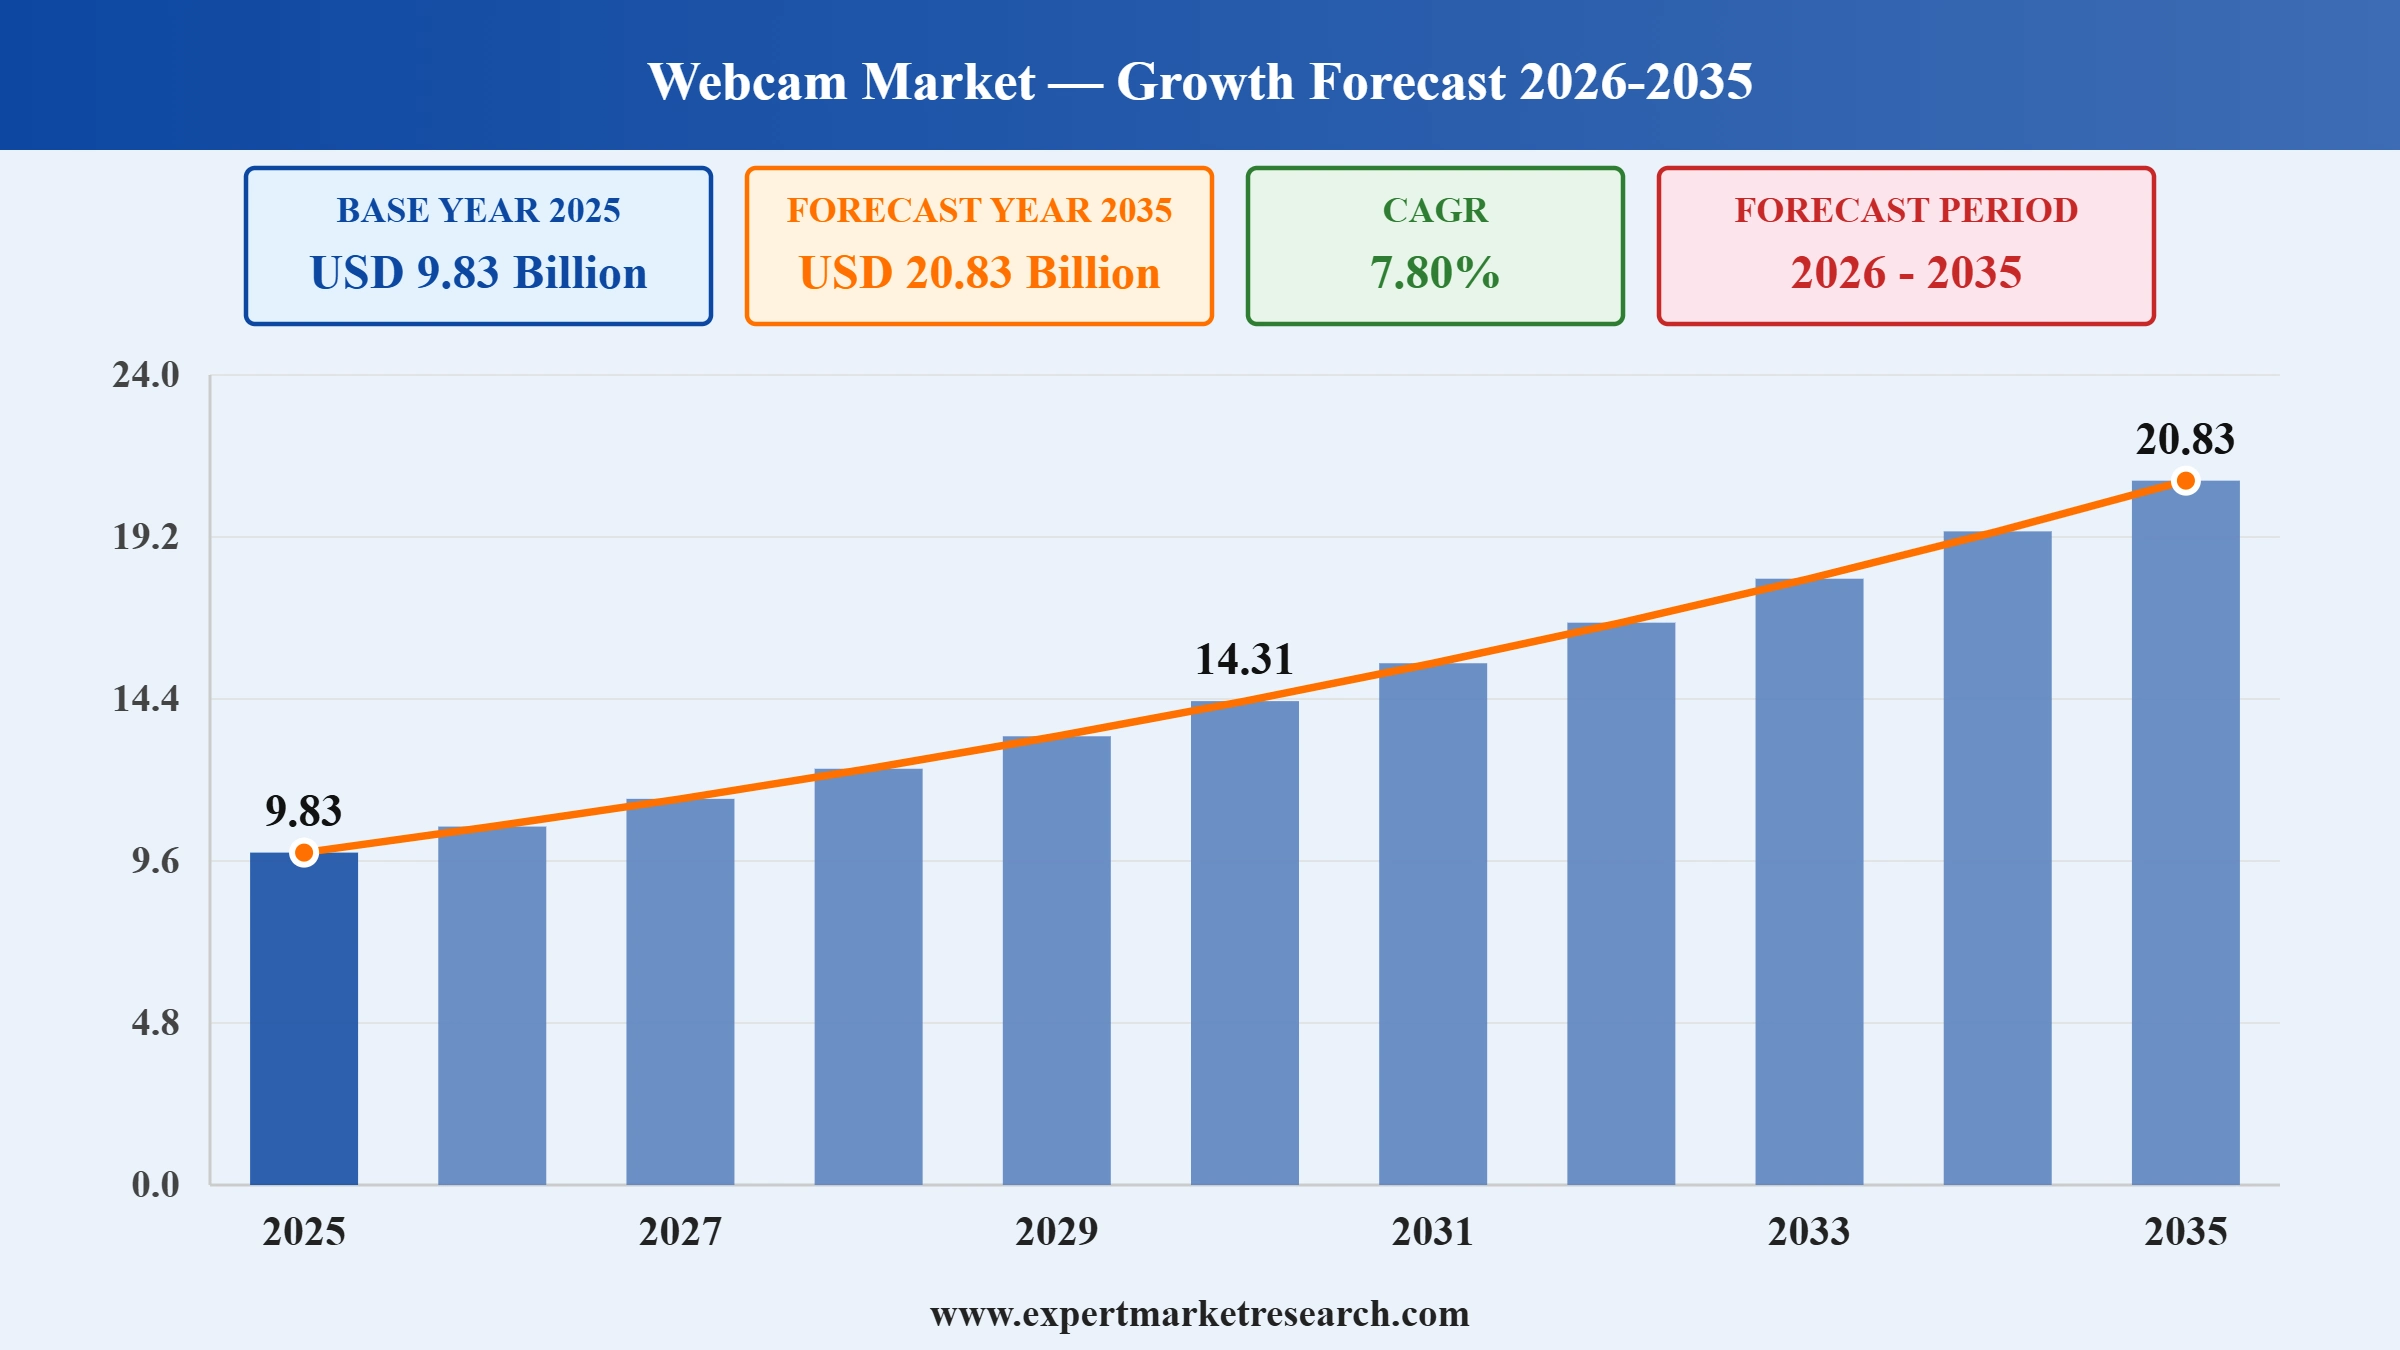
The global webcam market reached approximately USD 9.83 Billion in 2025. The market is projected to grow at a CAGR of 7.80% between 2026 and 2035, reaching a value of around USD 20.83 Billion by 2035.

Latest News on the Webcam Market (2026)

April 2026: OBSBOT Showcases AI Multi-Camera Webcam Workflows at NAB 2026

As reported by AV Network, AI-powered smart videography brands including OBSBOT and Insta360 expanded their 2026 hybrid-workflow line-ups, with flagship Tiny 3 and Link 2 Pro 4K webcams integrating spatial audio and AI meeting assistants. The shift toward intelligent auto-framing, gimbal-based tracking, and enterprise-grade features signals rising demand for professional-grade webcams across streaming, education, and hybrid work segments.

March 2026: Windows 11 Update Adds Pan-and-Tilt Webcam Controls

According to Windows Central, Microsoft's March 2026 Patch Tuesday update introduced native pan-and-tilt camera controls inside Windows 11 settings for supported webcams. The feature removes the need for third-party software, improving video-conferencing flexibility for hybrid workers and streamers, and underscoring accelerating integration of AI-driven webcam capabilities across consumer and enterprise devices globally.

Q1 2026 Market Updates

Geopolitical Impact of Iran, US, and Israel War on the Webcam Market

United States: The Webcam Market, a key segment of the global economy, is experiencing a complex operating environment in Q1 2026 as a direct consequence of the US-Israel-Iran war. 31 force majeure declarations by polymer suppliers, polypropylene and polyethylene price spikes, and chemical manufacturer surcharges of up to 30% are flowing through supply chains. U.S. consumer inflation is projected at 4.2% for 2026, above pre-war forecasts, with fuel costs above USD 4 per gallon compressing household discretionary budgets. Retail supply chains are absorbing the combined impact of 30% higher freight costs, 15-20% packaging material inflation, and rising transport fuel costs, compressing retailer margins. Consumer spending caution is growing as gasoline above USD 4 per gallon and 4.2% projected inflation compress household discretionary budgets.

Iran: Iran's domestic Webcam sector has been effectively suspended by the conflict. US-Israeli strikes on industrial and civilian infrastructure across Tehran, Mashhad, Isfahan, and other major cities have disrupted all commercial activity. Power outages from attacks on electricity generation facilities have halted manufacturing operations, and the collapse of the commercial banking and logistics system has eliminated any residual trade flows. The broader humanitarian crisis, with over 1,900 casualties and 4,000+ civilian buildings damaged, has redirected the entire Iranian economy toward survival rather than production or consumption.

Israel: Israel's Webcam sector is experiencing near-term disruption from wartime conditions. Consumer spending on non-essential categories has declined as millions of Israelis regularly shelter from missile and drone alerts. Supply chain logistics are disrupted by regional airspace closures, elevated war-risk insurance premiums, and the suspension of major carrier services through the region. International business partnerships with Israeli companies have been temporarily suspended. Post-conflict reconstruction and recovery demand is expected to provide meaningful demand acceleration across affected market segments once operational conditions normalise.

Key Takeaways

Government

  • Relevant consumer protection agencies should monitor retail pricing for evidence of disproportionate margin-taking on top of genuine supply cost increases, ensuring that conflict-related cost inflation is not being amplified by opportunistic pricing behaviour.
  • Governments should consider targeted consumer support measures for lower-income households most exposed to rising fuel and food costs, preventing conflict-driven inflation from creating acute hardship among economically vulnerable populations.
  • Trade authorities should work with the webcam industry to identify import diversification opportunities that reduce dependence on Gulf-disrupted supply chains, stabilising product availability and moderating consumer price inflation.

Market

  • U.S. consumer inflation projected at 4.2% for 2026, gasoline above USD 4 per gallon, and global food price increases from fertilizer and logistics inflation are creating the most challenging consumer spending environment since 2022.
  • Premium and essential categories within the webcam market show different demand trajectories: premium segments serving ultra-high-net-worth consumers remain resilient, while mass-market discretionary segments face meaningful softening.
  • Supply chain cost increases from 30% higher freight, 15-20% packaging inflation, and rising input material costs are compressing retailer and brand margins, creating pressure for pricing adjustments that may further moderate volume demand.

Procurement

  • Consumer goods procurement teams should review packaging material sourcing, building 60-90 day buffer inventory of petroleum-derived packaging materials before further feedstock cost increases from the Gulf supply shock are transmitted into manufacturing costs.
  • Logistics procurement managers should lock in freight contracts at current rates before further diesel cost increases are passed through by carriers, and evaluate route optimisation strategies that reduce fuel cost exposure.
  • Retail and brand buyers should update 2026 cost models to incorporate 30% higher freight costs, 15-20% packaging material inflation, and rising input material prices, ensuring that margin targets and pricing strategies reflect the new cost environment.

Market Size and Forecast

  • Market Size in 2025: USD 9.83 Billion
  • Projected Market Size in 2035: USD 20.83 Billion
  • CAGR from 2026 to 2035: 7.80%


2025

Base Year

2019-2025

Historical Period

2026-2035

Forecast Period

Compound Annual Growth Rate

7.8%

Value in USD Billion

2026-2035


*this image is indicative*

Global Webcam Market Report Summary Description Value
BillionBase Year USD Billion 2025
Historical Period USD Billion 2019-2025
Forecast Period USD Billion 2026-2035
Market Size 2025 USD Billion 9.83
Market Size 2035 USD Billion 20.83
CAGR 2019-2025 Percentage XX%
CAGR 2026-2035 Percentage 7.80%
CAGR 2026-2035 - Market by Region Asia Pacific 8.6%
CAGR 2026-2035 - Market by Country India 9.0%
CAGR 2026-2035 - Market by Country Canada 8.7%
CAGR 2026-2035 - Market by End Use Visual Marketing 8.9%
CAGR 2026-2035 - Market by Distribution Channel Online Channels 15.8%
Market Share by Country 2025 France 3.4%

Global Webcam Market Growth

The rise of online education platforms and virtual classrooms has led to an increased demand for webcams. Over 30% of American students have participated in at least one online course. 75% of undergraduates enrol in at least one online course during their academic career, while 71% of graduate students opt for the same. Moreover, more than three-quarters of public college students take at least one online course during their studies. The growing investments in educational technology (EdTech) are also driving the necessity for advanced webcams in educational environments. Reliable webcams are essential for effective communication and learning between students and educators.

The rise of e-commerce and online retail platforms has led to an increased demand for webcams for product demonstrations, customer service, and virtual shopping experiences. B2B e-commerce sales have been steadily increasing, with the global market projected to reach USD 36 trillion by 2026. The anticipated growth of global B2C ecommerce revenue is projected to reach USD 5.5 trillion by 2027, maintaining a consistent compound annual growth rate of 14.4%. The inclusion of webcams in the e-commerce environment has greatly changed the way customers engage with online merchants and merchandise. With the continuous expansion of online shopping, webcams are becoming more crucial in enriching the user experience, offering fresh avenues for customers to interact with products, and enhancing customer service.

Global Webcam Industry Segmentation

“Global Webcam Market Report and Forecast 2026-2035” offers a detailed analysis of the market based on the following segments:

Market Breakup by Webcam Type

  • External Webcam
  • Embedded Webcam

Market Breakup by Technology

  • Analogue
  • Digital

Market Breakup by End Use

  • Security and Surveillance
  • Entertainment
  • Video Conference
  • Live Events
  • Visual Marketing
  • Others

Market Breakup by Distribution Channel

  • Offline Stores
  • Online Channels

Market Breakup by Region

  • North America
  • Europe
  • Asia Pacific
  • Latin America
  • Middle East and Africa
CAGR 2026-2035 - Market by Country
India 9.0%
Canada 8.7%
China 8.2%
UK 8.1%
Mexico 8.0%
USA XX%
France XX%
Italy XX%
Japan XX%
Australia XX%
Saudi Arabia 7.6%
Brazil XX%
Germany 7.5%

Global Webcam Market Share

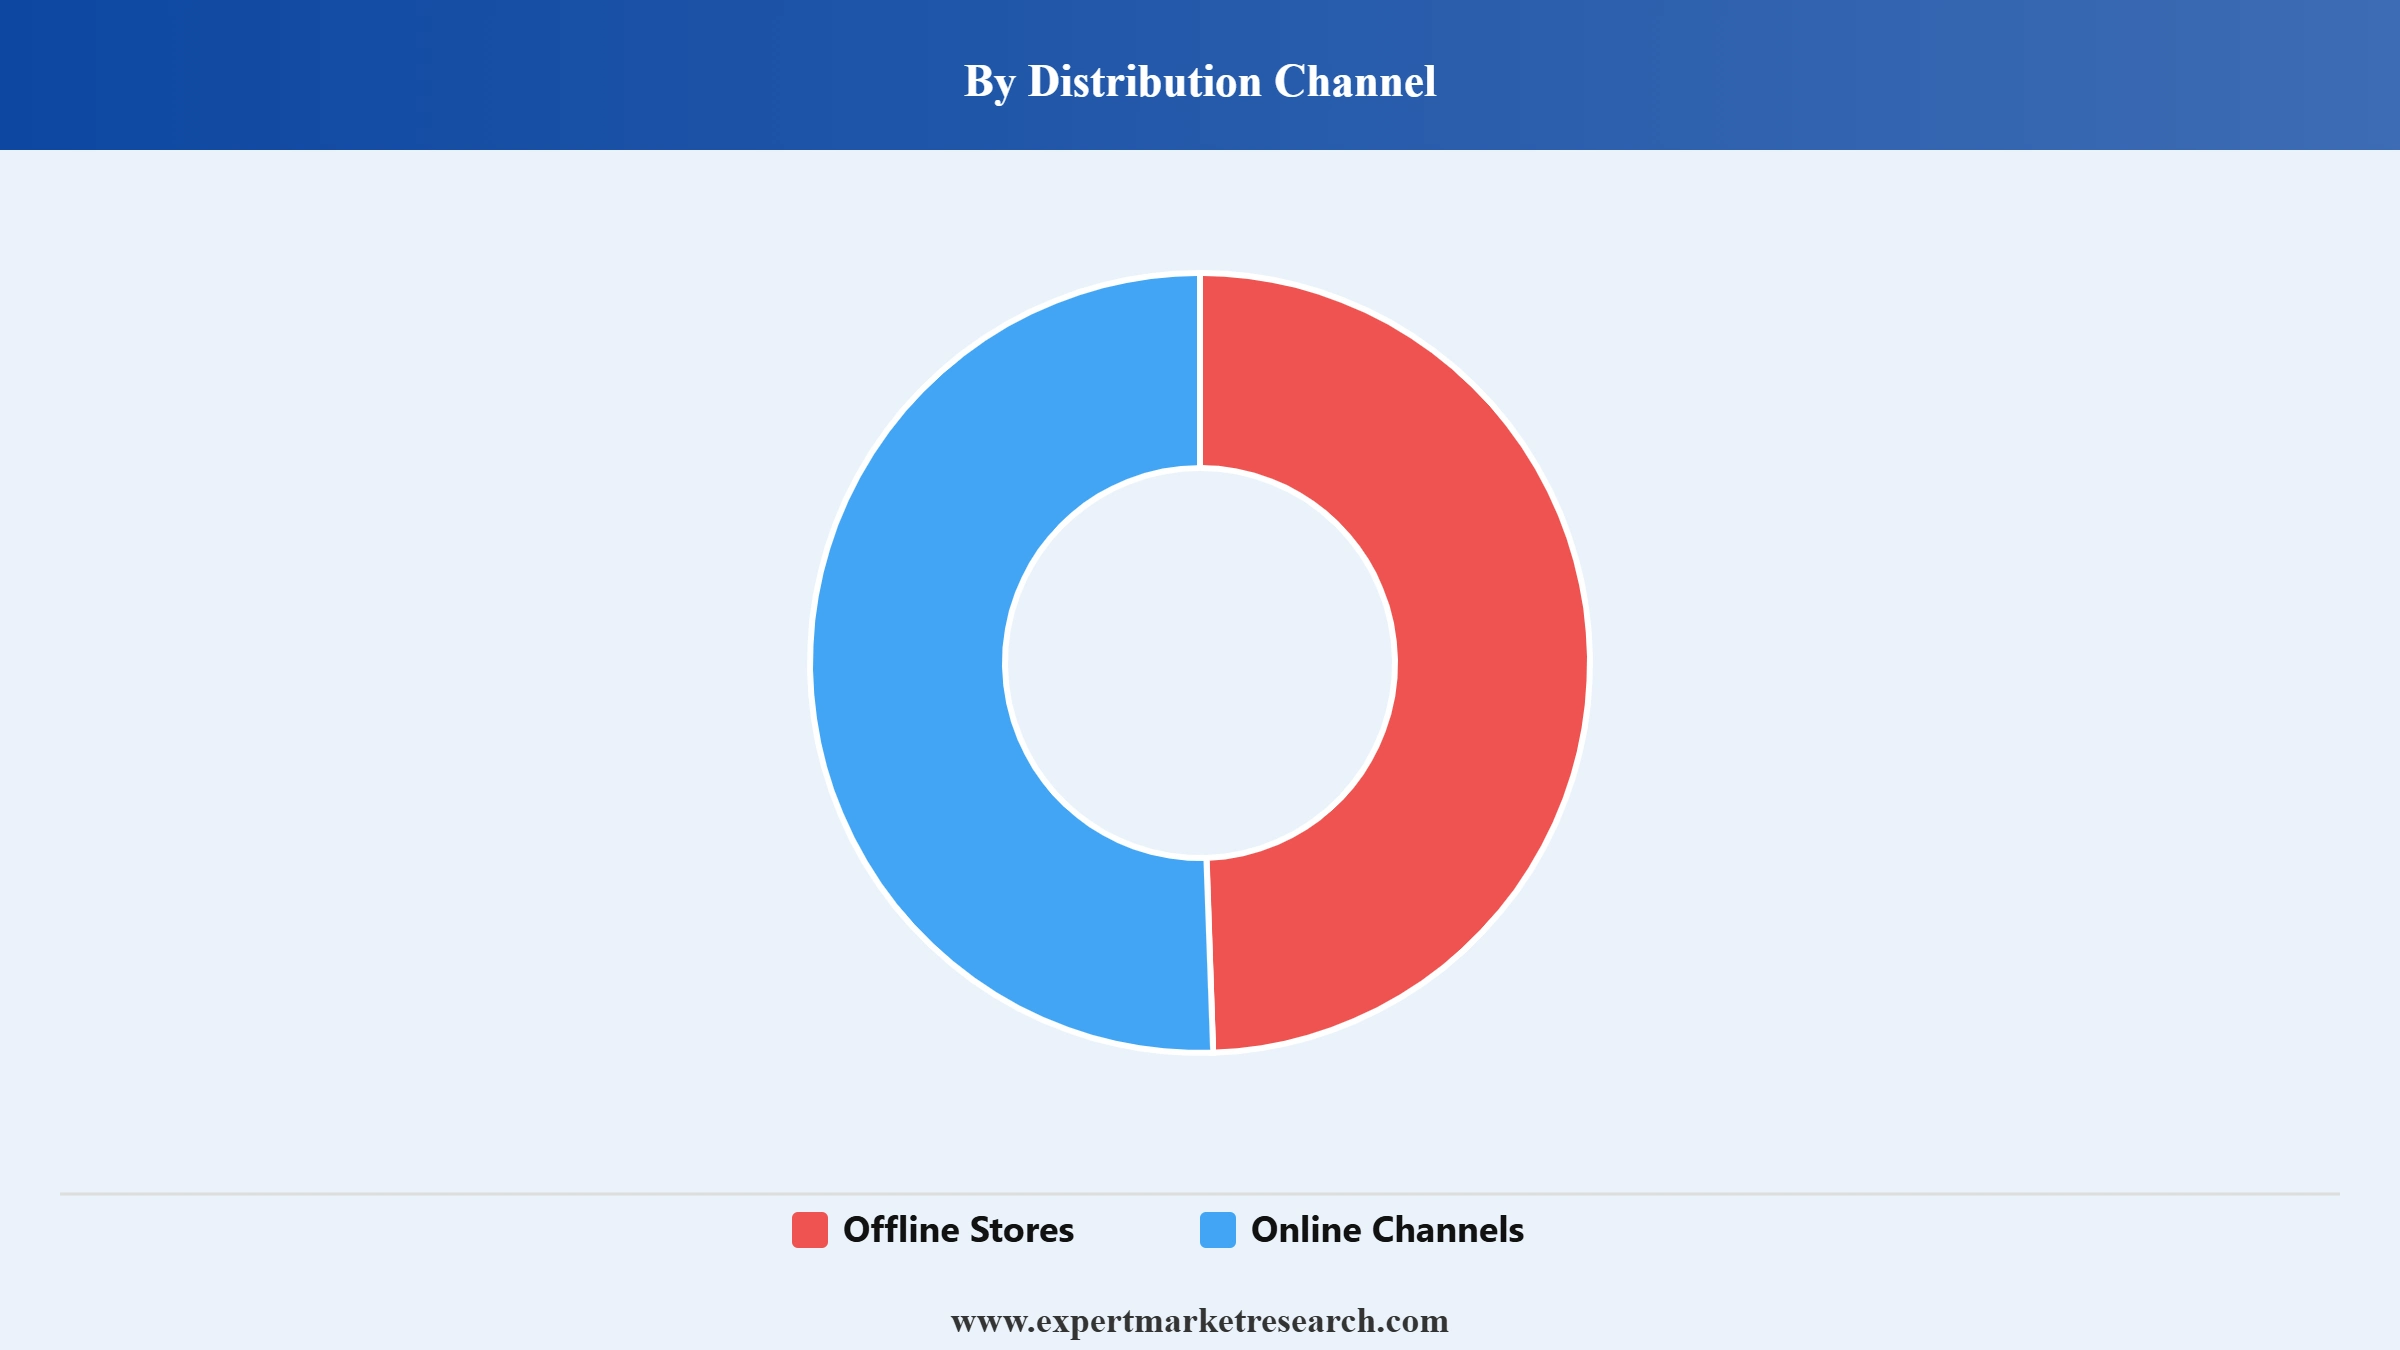
Based on distribution channels, the market is segmented into offline stores and online channels. Online channels are projected to grow at a CAGR of 15.8% during the forecast period of 2026-2035. The availability of webcams through online purchasing platforms offers a multitude of advantages for consumers, including a wide variety of products, 24x7 availability, and doorstep delivery, among others. This contributes significantly to their growing popularity among a diverse range of buyers.

Leading Companies in the Global Webcam Market

Major players are focusing on the adoption of advanced webcam technologies to gain a competitive edge in the market.

  • Logitech S.A.
  • Microsoft Corporation
  • Razer Inc.
  • Creative Technology Ltd.
  • AUSDOM
  • AVerMedia Technologies, Inc.
  • Arashi Vision Inc.
  • Papalook
  • Loocam Technology LLC 
  • Corsair Memory, Inc.
  • Others

*While we strive to always give you current and accurate information, the numbers depicted on the website are indicative and may differ from the actual numbers in the main report. At Expert Market Research, we aim to bring you the latest insights and trends in the market. Using our analyses and forecasts, stakeholders can understand the market dynamics, navigate challenges, and capitalize on opportunities to make data-driven strategic decisions.*

Looking for specific insights?

Get in touch with us for a customized solution tailored to your unique requirements and save upto 35%!

Key Questions Answered in the Report

In 2025, the market reached an approximate value of USD 9.83 Billion.

The market is estimated to grow at a CAGR of 7.80% between 2026 and 2035.

The market is estimated to witness a healthy growth during 2026-2035 to reach around USD 20.83 Billion by 2035.

The market is being driven by the increasing number of online learning platforms and the rising e-commerce sector.

The key trends aiding the market expansion include the growth in video conferencing solutions and the rising integration of webcams with smart home solutions.

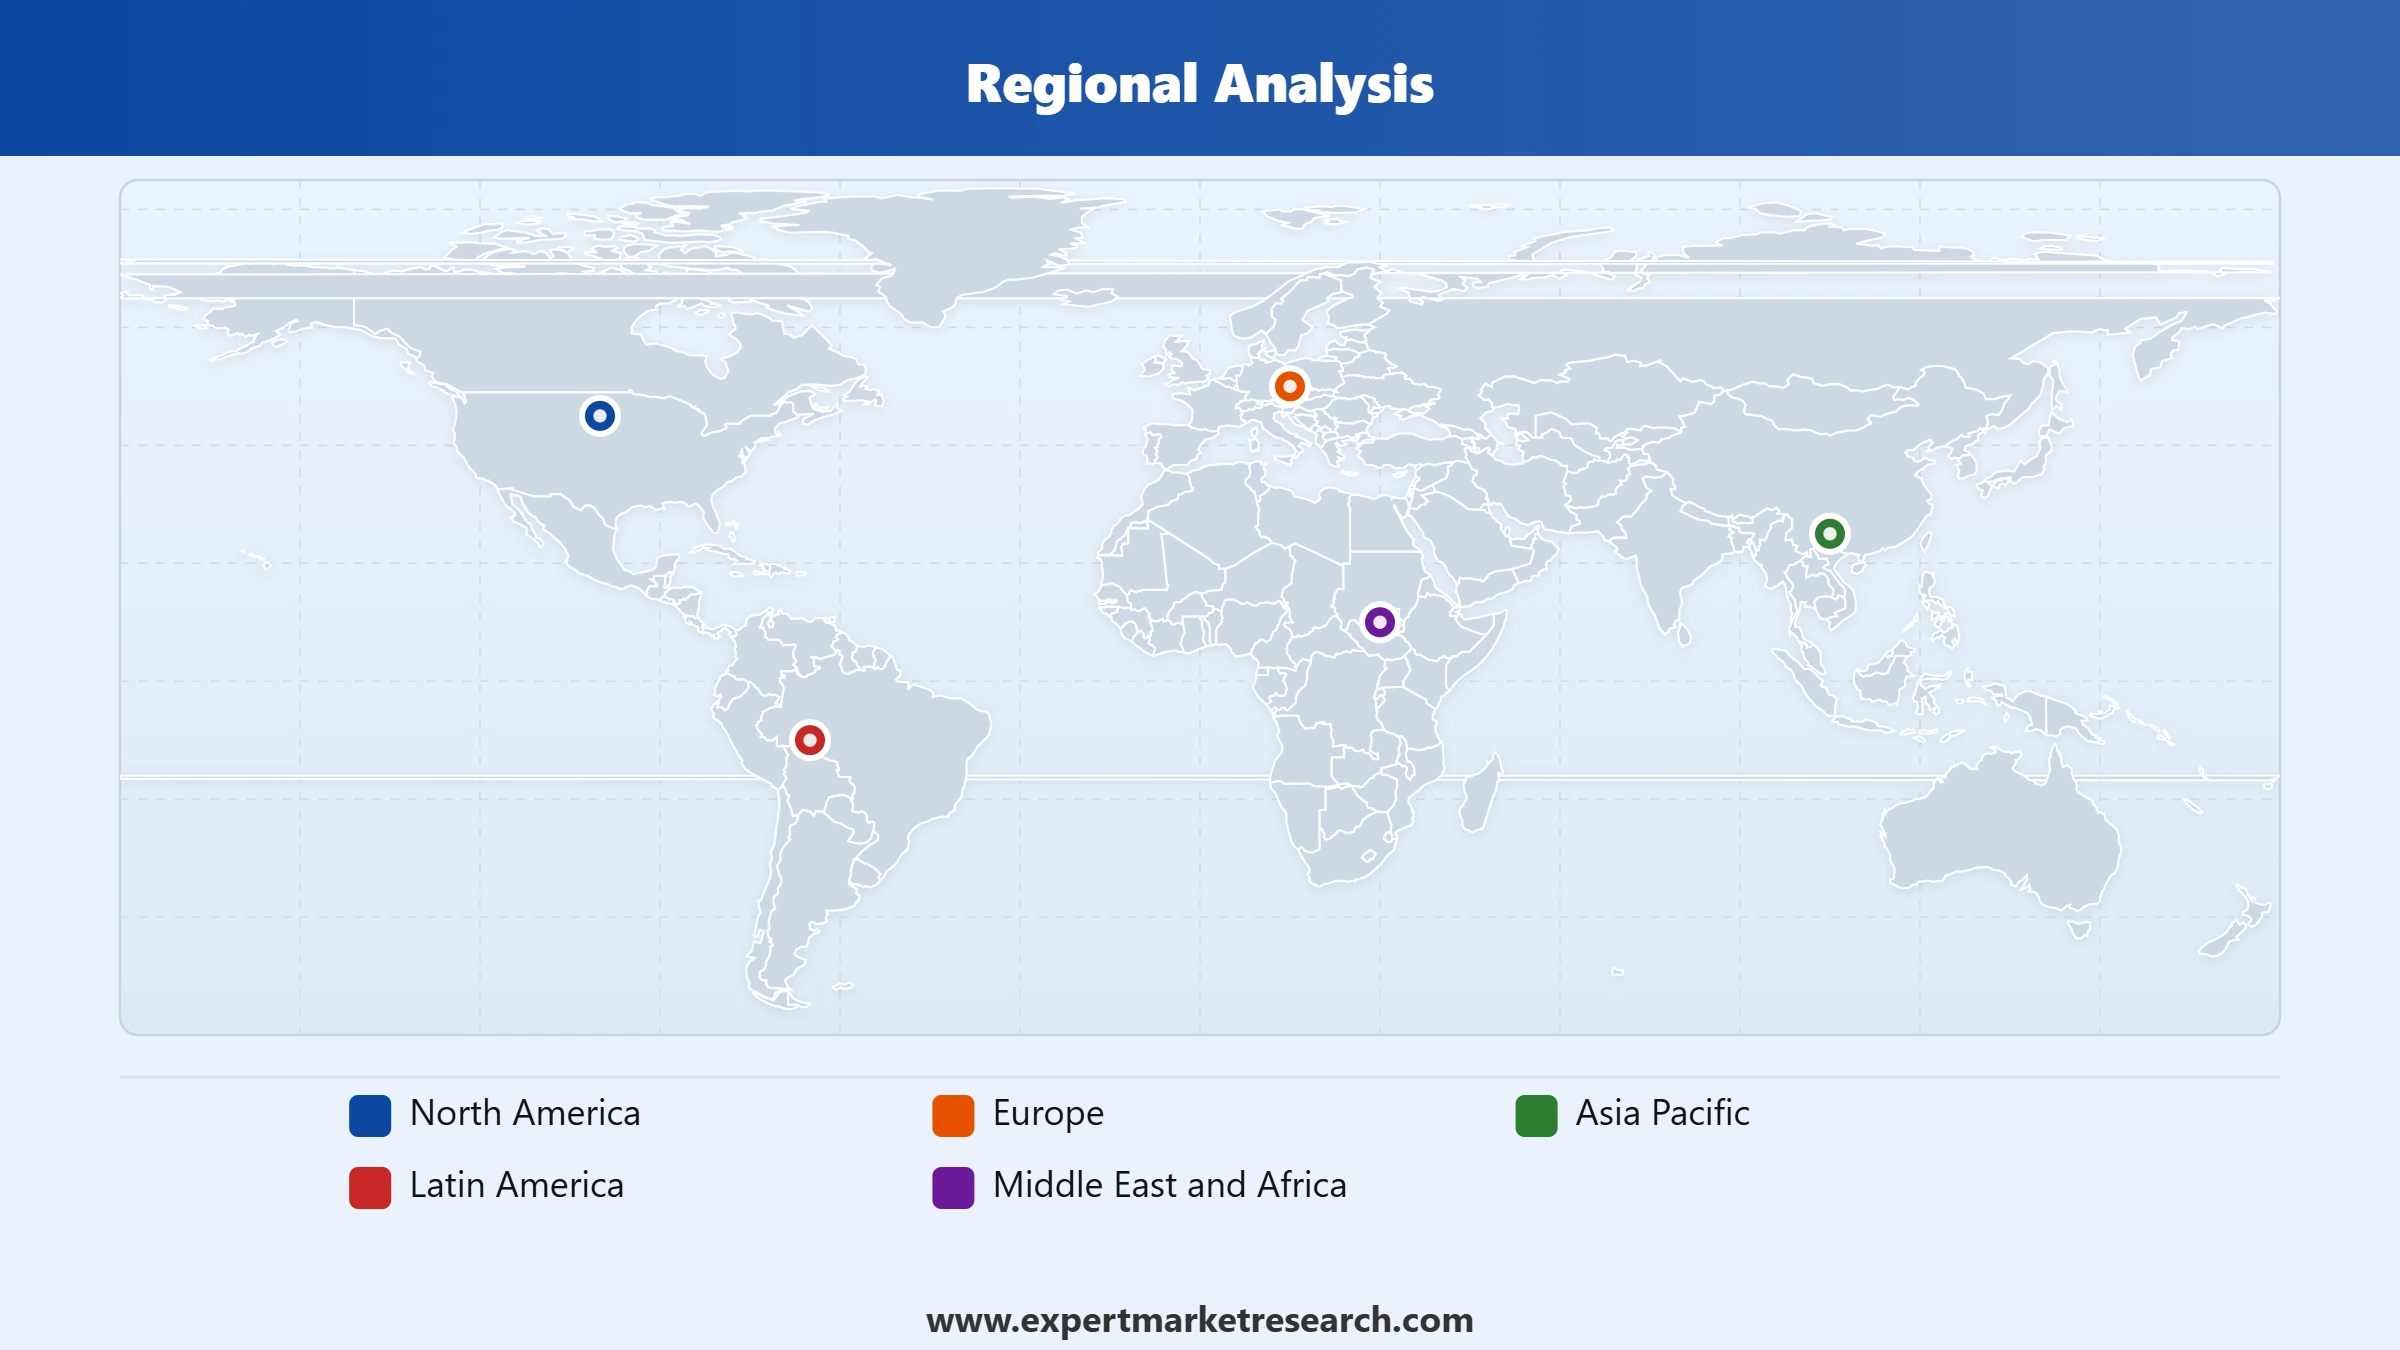
The major regions considered in the market are North America, Europe, the Asia Pacific, Latin America, and the Middle East and Africa.

The major distribution channels considered in the market are offline stores and online channels.

The major players in the market are Logitech S.A., Microsoft Corporation, Razer Inc., Creative Technology Ltd., AUSDOM, AVerMedia Technologies, Inc., Arashi Vision Inc., Papalook, Loocam Technology LLC, and Corsair Memory, Inc., among others.

Report Summary

Explore our key highlights of the report and gain a concise overview of key findings, trends, and actionable insights that will empower your strategic decisions.

Key Highlights of the Report

Please note that the figures mentioned in the description serve as estimates and may vary from the actual figures presented in the final report.

REPORT FEATURES DETAILS
Base Year 2025
Historical Period 2019-2025
Forecast Period 2026-2035
Scope of the Report

Historical and Forecast Trends, Industry Drivers and Constraints, Historical and Forecast Market Analysis by Segment:

  • Webcam Type
  • Technology
  • End Use
  • Distribution Channel
  • Region
Breakup by Webcam Type
  • External Webcam
  • Embedded Webcam
Breakup by Technology
  • Analogue
  • Digital
Breakup by End Use
  • Security and Surveillance
  • Entertainment
  • Video Conference
  • Live Events
  • Visual Marketing
  • Others
Breakup by Distribution Channel
  • Offline Stores
  • Online Channels
Breakup by Region
  • North America
    • United States of America 
    • Canada
  • Europe
    • United Kingdom
    • Germany
    • France
    • Italy
    • Others
  • Asia Pacific
    • China
    • Japan
    • India
    • ASEAN
    • Australia
    • Others
  • Latin America
    • Brazil
    • Argentina
    • Mexico
    • Others
  • Middle East and Africa
    • Saudi Arabia
    • United Arab Emirates
    • Nigeria
    • South Africa
    • Others
Market Dynamics
  • SWOT Analysis
  • Porter's Five Forces Analysis
  • Key Indicators for Demand
  • Key Indicators for Price
Competitive Landscape
  • Market Structure
  • Company Profiles
    • Company Overview
    • Product Portfolio
    • Demographic Reach and Achievements
    • Certifications
Companies Covered
  • Logitech S.A.
  • Microsoft Corporation
  • Razer Inc.
  • Creative Technology Ltd.
  • AUSDOM
  • AVerMedia Technologies, Inc.
  • Arashi Vision Inc.
  • Papalook
  • Loocam Technology LLC
  • Corsair Memory, Inc.
  • Others

Datasheet

10 % Off

USD

2,499

2,249

Single User License

10 % Off

USD

3,999

3,599

Five User License

15 % Off

USD

4,999

4,249

Corporate License

15 % Off

USD

5,999

5,099

Datasheet

One User

USD 2,499

USD 2,249

tax inclusive*

  • Selected Segments
  • Printing Restrictions
  • Excel Spreadsheet Delivered via Email
  • Full Report
  • Periodic Updates
  • Post Sales Analysts Support
  • Unlimited Prints

Single User License

One User

USD 3,999

USD 3,599

tax inclusive*

  • All Segments
  • Printing Restrictions
  • PDF Delivered via Email
  • Custom Report Layout
  • Post Sales Analysts Support
  • Periodic Updates
  • Unlimited Prints

Five User License

Five User

USD 4,999

USD 4,249

tax inclusive*

  • All Segments
  • Five Prints Available
  • PDF Delivered via Email
  • Limited Free Customization
  • Post Sales Analyst Support
  • Custom Report Layout
  • Periodic Updates
  • Unlimited Prints

Corporate License

Unlimited Users

USD 5,999

USD 5,099

tax inclusive*

  • All Segments
  • Unlimited Prints Available
  • PDF & Excel Delivery via Email
  • Limited Free Customization
  • Post Sales Analysts Support
  • Discount On Next Update
  • Custom Report Layout

*Please note that the prices mentioned below are starting prices for each bundle type. Kindly contact our team for further details.*

Bundle Type

Flash Bundle

20% OFF Number of Reports: 3

Small Business Bundle

25% OFF Number of Reports: 5

Growth Bundle

30% OFF Number of Reports: 8

Enterprise Bundle

35% OFF Number of Reports: 10
Overview
  • Life Time Access
  • Analyst Support Related to Report
  • PDF Version of the Report
  • Complimentary Excel Data Set
  • Free Analyst Hours
  • Complimentary Free 1 Month Subscription to Trade Data Base
  • Complimentary One Month Subscription to Price Database (Chemicals only)
  • Complimentary PPT Version of the Report
  • Complimentary License Upgrade
  • Complimentary Power BI Dashboards
  • Life Time Access
  • Analyst Support Related to Report
  • PDF Version of the Report
  • Complimentary Excel Data Set
  • Free Analyst Hours - 50 Hours
  • Complimentary Free 1 Month Subscription to Trade Data Base
  • Complimentary One Month Subscription to Price Database (Chemicals only)
  • Complimentary PPT Version of the Report
  • Complimentary License Upgrade
  • Complimentary Power BI Dashboards
  • Life Time Access
  • Analyst Support Related to Report
  • PDF Version of the Report
  • Complimentary Excel Data Set
  • Free Analyst Hours - 80 Hours
  • Complimentary Free 1 Month Subscription to Trade Data Base
  • Complimentary One Month Subscription to Price Database (Chemicals only)
  • Complimentary PPT Version of the Report
  • Complimentary License Upgrade
  • Complimentary Power BI Dashboards
  • Life Time Access
  • Analyst Support Related to Report
  • PDF Version of the Report
  • Complimentary Excel Data Set
  • Free Analyst Hours - 100 Hours
  • Complimentary Free 1 Month Subscription to Trade Data Base
  • Complimentary One Month Subscription to Price Database (Chemicals only)
  • Complimentary PPT Version of the Report
  • Complimentary License Upgrade
  • Complimentary Power BI Dashboards

*Please note that the prices mentioned below are starting prices for each bundle type. Kindly contact our team for further details.*

Flash Bundle

Number of Reports: 3

20%

tax inclusive*

  • 3 Reports Included
  • Life Time Acess
  • Analyst Support Related to Report
  • PDF Version of the Report
  • Free 1 Month Subscription to Trade Data Base
  • 1 Month Subscription to Price Database (Chemicals only)
  • Complimentary Excel Data Set
  • PPT Version of the Report
  • Power BI Dashboards
  • License Upgrade
  • Free Analyst Hours

Small Business Bundle

Number of Reports: 5

25%

tax inclusive*

  • 5 Reports Included
  • Life Time Acess
  • Analyst Support Related to Report
  • PDF Version of the Report
  • Complimentary Excel Data Set
  • Free Analyst Hours - 50 Hours
  • Free 1 Month Subscription to Trade Data Base
  • 1 Month Subscription to Price Database (Chemicals only)
  • Complimentary Excel Data Set
  • PPT Version of the Report
  • Power BI Dashboards
  • License Upgrade

Growth Bundle

Number of Reports: 8

30%

tax inclusive*

  • 8 Reports Included
  • Life Time Acess
  • Analyst Support Related to Report
  • PDF Version of the Report
  • Complimentary Excel Data Set
  • Free Analyst Hours - 50 Hours
  • Free 1 Month Subscription to Trade Data Base
  • 1 Month Subscription to Price Database (Chemicals only)
  • License Upgrade
  • Free Analyst Hours - 80 Hours
  • Power BI Dashboards

Enterprise Bundle

Number of Reports: 10

35%

tax inclusive*

  • 10 Reports Included
  • Life Time Acess
  • Analyst Support Related to Report
  • PDF Version of the Report
  • Complimentary Excel Data Set
  • Free Analyst Hours - 50 Hours
  • Free 1 Month Subscription to Trade Data Base
  • 1 Month Subscription to Price Database (Chemicals only)
  • License Upgrade
  • Power BI Dashboards
  • Free Analyst Hours - 100 Hours

How To Order

This is a collaborative report by Dikshant Arora and Ketan Gandhi reflecting perspectives and research-driven insights from Expert Market Research.

Our step-by-step guide will help you select, purchase, and access your reports swiftly, ensuring you get the information that drives your decisions, right when you need it.

License Type

Select License Type

Choose the right license for your needs and access rights.

shopping cart

Click on ‘Buy Now’

Add the report to your cart with one click and proceed to register.

Bookmark Icon

Select Mode of Payment

Choose a payment option for a secure checkout. You will be redirected accordingly.

Strategic Solutions for Informed Decision-Making

Connect For More Information

Our expert team of analysts will offer full support and resolve any queries regarding the report, before and after the purchase.

Our expert team of analysts will offer full support and resolve any queries regarding the report, before and after the purchase.

We employ meticulous research methods, blending advanced analytics and expert insights to deliver accurate, actionable industry intelligence, staying ahead of competitors.

Our skilled analysts offer unparalleled competitive advantage with detailed insights on current and emerging markets, ensuring your strategic edge.

We offer an in-depth yet simplified presentation of industry insights and analysis to meet your specific requirements effectively.

We’re here to help answer any questions about our products and services.

Contact us