Explore Our Diverse Range Of Offerings
From detailed reports to experts services offered in 15+ Industry Domains
Report
Press Release
Blogs
Industry Statistics
Add 2 More Reports For 20% off

Report Overview

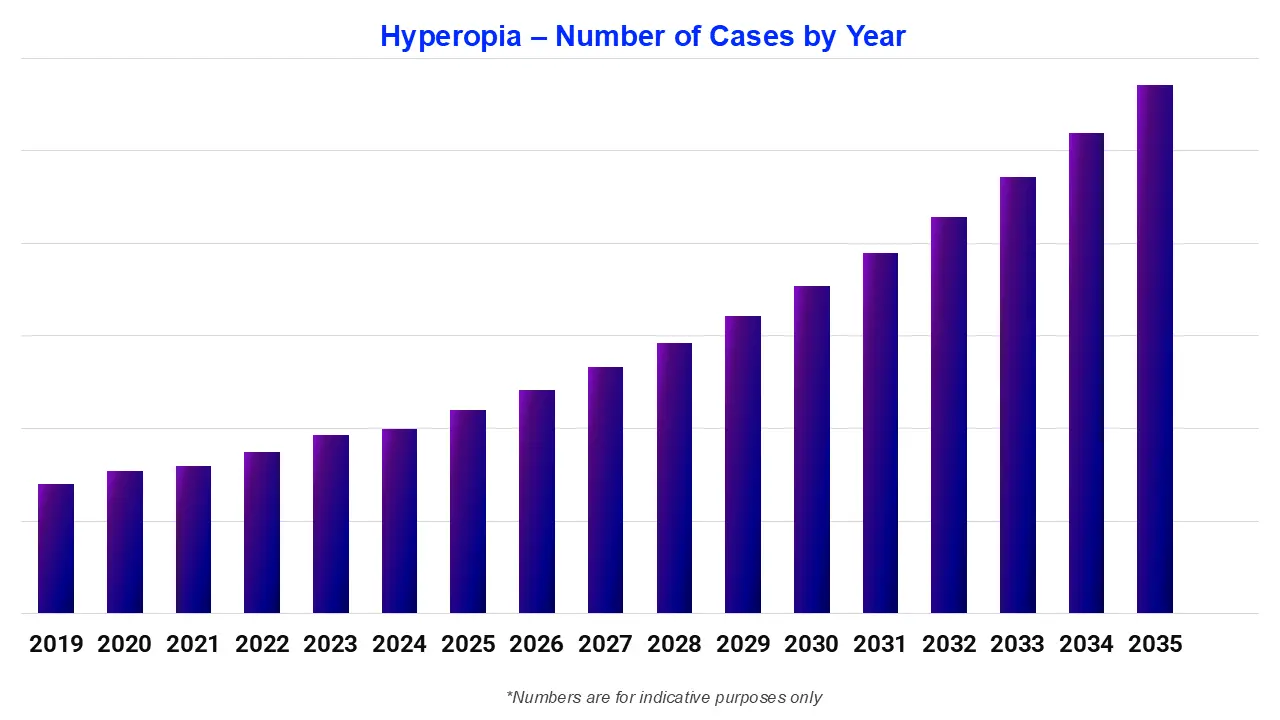
Hyperopia, or farsightedness, is a common refractive error affecting global vision health. According to Eye Health Central, up to 30.6% of adults worldwide may be affected by hyperopia, with prevalence rising significantly in older age groups due to ocular structural changes. It remains a leading refractive error impacting visual function and quality of life across all age groups. Strong epidemiological patterns highlight age-related progression and regional variation. The hyperopia epidemiology forecast by Expert Market Research underscores its growing clinical relevance in vision care globally.

2025

Base Year

2019-2025

Historical Period

2026-2035

Forecast Period

Hyperopia – Number of Cases by Year

Read more about this report - Request a Free Sample

Hyperopia Epidemiology Forecast Report Coverage

Expert Market Research's “Hyperopia Epidemiology Forecast Report 2026-2035” offers comprehensive information on the prevalence and demographics of hyperopia. It projects the future incidence and prevalence rates of hyperopia cases across various populations. The study covers age, gender, and type as major determinants of the hyperopia population. The report highlights patterns in the prevalence of hyperopia over time and projects future trends based on multiple variables.

The report provides a comprehensive overview of the disease, as well as historical and projected data on the epidemiology of hyperopia in the 8 major markets.

Regions Covered

  • The United States
  • Germany
  • France
  • Italy
  • Spain
  • The United Kingdom
  • Japan
  • India

Hyperopia Understanding: Disease Overview

Hyperopia (farsightedness) is a common refractive error of the eye where distant objects are seen more clearly than near objects due to light focusing behind the retina. It is primarily caused by a shorter axial length or reduced refractive power of the cornea and lens. The condition affects both children and adults, with prevalence increasing with age-related changes. Hyperopia epidemiology shows significant variation across populations, influencing vision quality, reading ability, and daily functioning. It is often underdiagnosed in mild cases, especially in younger individuals.

Hyperopia Epidemiology Perspective

The hyperopia epidemiology division offers information on the patient pool from history to the present as well as the projected trend for each of the 8 major markets. Expert Market Research provides both current and predicted trends for the hyperopia epidemiology scenario by examining a wide range of studies. Additionally, the report covers the diagnosed patient pool for hyperopia and their trends. The data is broken down into specific categories, such as total prevalent cases in males and females, and total diagnosed cases across different age groups and patient pools.

  • According to the American Academy of Ophthalmology, hyperopia prevalence in infants is common in early life, with most full-term newborns mildly affected. Prevalence declines from 4-9% at 6-9 months to approximately 3.6% at 12 months, consistent with normal visual maturation and the emmetropization process during early ocular development.
  • As per Eye Health Central and updated global analyses, global hyperopia prevalence varies widely by age and region, affecting approximately 8.4% of children at age six, declining to 1% by age fifteen, while adult prevalence rises from 9.9% in younger adults to 14.9% in older populations.
  • According to the Multi-Ethnic Pediatric Eye Disease Study, pediatric hyperopia by ethnicity reveals significant demographic variability, affecting 26.9% of Hispanic, 25% of non-Hispanic White, 20.8% of African American, and 13% of Asian American children, highlighting the importance of ethnicity-specific screening strategies within multiethnic pediatric populations across the United States.
  • According to the Samuel Otabor Wajuihian, et al., 2021, age-related farsightedness increases notably after age 40, with females consistently demonstrating higher prevalence rates than males across all age groups.
  • According to the American Academy of Ophthalmology, uncorrected hyperopia complications carry negligible mortality but significant morbidity. Hyperopia exceeding +3.50 diopters increases strabismus risk up to 13-fold by age four. Pooled pediatric data further confirm that moderate-to-high hyperopia (≥4.0 diopters) affects 3.2% of children aged 6-72 months, reinforcing the critical value of early detection and prompt correction.
  • Hyperopia – Number of Cases by Country

    Read more about this report - Request a Free Sample

Country-wise Hyperopia Epidemiology Segment

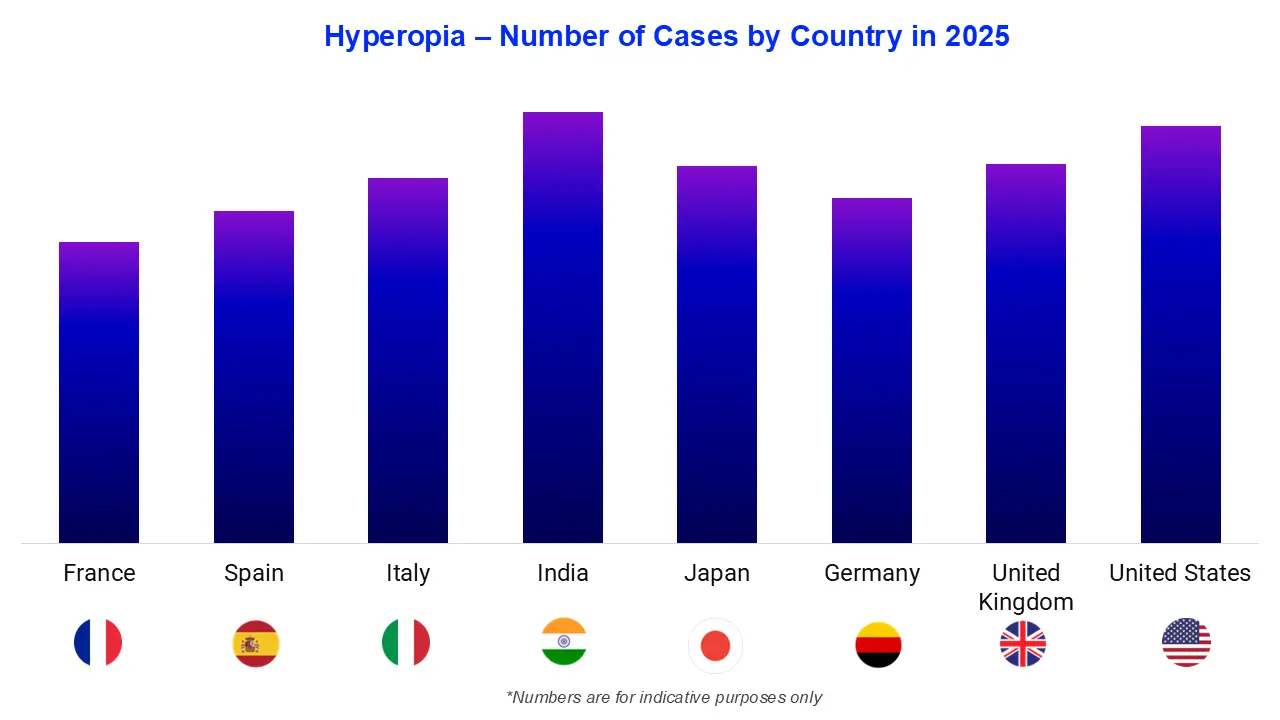
The hyperopia epidemiology data and findings for the United States, Germany, Spain, Italy, France, the United Kingdom, Japan, and India are also provided in the epidemiology section.

The United States and the United Kingdom together offer a well-documented representation of country-wise hyperopia epidemiology in high-income nations. According to the American Academy of Ophthalmology and Eye Health Central, in the United States, approximately 10% of the population, nearly 14 million individuals, are affected, with prevalence rising from 9.9% in adults aged 20-39 to 14.9% in those aged 60 and older. In Europe, prevalence is estimated at 23.1% of the population, according to Eye Health Central. In Japan, hyperopia prevalence reaches around 20% in older adults, whereas India reports a lower overall prevalence (approximately 12–18% regionally in Asia) due to a higher myopia burden, as per Eye Health Central, highlighting distinct regional epidemiological patterns.

Hyperopia: Treatment Overview

Treatment of hyperopia focuses on correcting refractive error to improve near vision and reduce eye strain. The primary management includes prescription convex corrective lenses (glasses or contact lenses), which adjust light focus onto the retina. Refractive surgery options such as LASIK and photorefractive keratectomy (PRK) are considered in eligible adults for long-term correction. Pediatric cases may require early optical correction to prevent amblyopia. Advances in refractive error management and ophthalmic diagnostics have improved treatment precision, enhancing visual outcomes and quality of life across affected populations globally.

Key Questions Answered

  • What are the key findings of hyperopia epidemiology in the 8 major markets?
  • What will be the total number of patients with hyperopia across the 8 major markets during the forecast period?
  • What was the country-wise hyperopia epidemiology scenario in the 8 major markets in the historical period?
  • Which country will have the highest number of hyperopia patients during the forecast period of 2026-2035?
  • Which key factors would influence the shift in the patient population of hyperopia during the forecast period of 2026-2035?
  • What are the currently available treatments for hyperopia?
  • What are the disease risks, signs, symptoms, and unmet needs of hyperopia?

Scope of the Hyperopia Epidemiology Report

  • The report covers a detailed analysis of signs and symptoms, causes, risk factors, pathophysiology, diagnosis, treatment options, and classification/types of hyperopia based on several factors.
  • Hyperopia Epidemiology Forecast Report covers data for the eight major markets (the US, France, Germany, Italy, Spain, the UK, Japan, and India).
  • The hyperopia report helps to identify the patient population, and the unmet needs are highlighted along with an assessment of the disease's risk and burden.

Related Reports

Refractive Surgery Devices Market

Refractive Errors Pipeline Analysis

*While we strive to always give you current and accurate information, the numbers depicted on the website are indicative and may differ from the actual numbers in the main report. At Expert Market Research, we aim to bring you the latest insights and trends in the market. Using our analyses and forecasts, stakeholders can understand the market dynamics, navigate challenges, and capitalize on opportunities to make data-driven strategic decisions.*

Looking for specific insights?

Get in touch with us for a customized solution tailored to your unique requirements and save upto 35%!

Report Summary

Explore our key highlights of the report and gain a concise overview of key findings, trends, and actionable insights that will empower your strategic decisions.

Key Highlights of the Report

Please note that the figures mentioned in the description serve as estimates and may vary from the actual figures presented in the final report.

Report Features

Details

Base Year

2025

Historical Period

2019-2025

Forecast Period

2026-2035

Epidemiology Statistics Provided

  • Diagnosed Prevalent Cases
  • Type-Specific Cases
  • Gender-Specific Cases
  • Age-Specific Cases

Segmentation Provided

  • Epidemiology by Age Group
  • Epidemiology by Gender
  • Epidemiology by Type of Disease
  • Epidemiology by Region

Geographies Covered

  • United States
  • Germany
  • Italy
  • France
  • Spain
  • United Kingdom
  • Japan
  • India

Datasheet

10 % Off

USD

1,999

1,799

Single User License

10 % Off

USD

2,999

2,699

Five User License

15 % Off

USD

4,399

3,739

Corporate License

15 % Off

USD

5,799

4,929

Datasheet

One User

USD 1,999

USD 1,799

tax inclusive*

  • Selected Segments
  • Printing Restrictions
  • Excel Spreadsheet Delivered via Email
  • Full Report
  • Periodic Updates
  • Post Sales Analysts Support
  • Unlimited Prints

Single User License

One User

USD 2,999

USD 2,699

tax inclusive*

  • All Segments
  • Printing Restrictions
  • PDF Delivered via Email
  • Custom Report Layout
  • Post Sales Analysts Support
  • Periodic Updates
  • Unlimited Prints

Five User License

Five User

USD 4,399

USD 3,739

tax inclusive*

  • All Segments
  • Five Prints Available
  • PDF Delivered via Email
  • Limited Free Customization
  • Post Sales Analyst Support
  • Custom Report Layout
  • Periodic Updates
  • Unlimited Prints

Corporate License

Unlimited Users

USD 5,799

USD 4,929

tax inclusive*

  • All Segments
  • Unlimited Prints Available
  • PDF & Excel Delivery via Email
  • Limited Free Customization
  • Post Sales Analysts Support
  • Discount On Next Update
  • Custom Report Layout

*Please note that the prices mentioned below are starting prices for each bundle type. Kindly contact our team for further details.*

Bundle Type

Flash Bundle

20% OFF Number of Reports: 3

Small Business Bundle

25% OFF Number of Reports: 5

Growth Bundle

30% OFF Number of Reports: 8

Enterprise Bundle

35% OFF Number of Reports: 10
Overview
  • Life Time Access
  • Analyst Support Related to Report
  • PDF Version of the Report
  • Complimentary Excel Data Set
  • Free Analyst Hours
  • Complimentary Free 1 Month Subscription to Trade Data Base
  • Complimentary One Month Subscription to Price Database (Chemicals only)
  • Complimentary PPT Version of the Report
  • Complimentary License Upgrade
  • Complimentary Power BI Dashboards
  • Life Time Access
  • Analyst Support Related to Report
  • PDF Version of the Report
  • Complimentary Excel Data Set
  • Free Analyst Hours - 50 Hours
  • Complimentary Free 1 Month Subscription to Trade Data Base
  • Complimentary One Month Subscription to Price Database (Chemicals only)
  • Complimentary PPT Version of the Report
  • Complimentary License Upgrade
  • Complimentary Power BI Dashboards
  • Life Time Access
  • Analyst Support Related to Report
  • PDF Version of the Report
  • Complimentary Excel Data Set
  • Free Analyst Hours - 80 Hours
  • Complimentary Free 1 Month Subscription to Trade Data Base
  • Complimentary One Month Subscription to Price Database (Chemicals only)
  • Complimentary PPT Version of the Report
  • Complimentary License Upgrade
  • Complimentary Power BI Dashboards
  • Life Time Access
  • Analyst Support Related to Report
  • PDF Version of the Report
  • Complimentary Excel Data Set
  • Free Analyst Hours - 100 Hours
  • Complimentary Free 1 Month Subscription to Trade Data Base
  • Complimentary One Month Subscription to Price Database (Chemicals only)
  • Complimentary PPT Version of the Report
  • Complimentary License Upgrade
  • Complimentary Power BI Dashboards

*Please note that the prices mentioned below are starting prices for each bundle type. Kindly contact our team for further details.*

Flash Bundle

Number of Reports: 3

20%

tax inclusive*

  • 3 Reports Included
  • Life Time Acess
  • Analyst Support Related to Report
  • PDF Version of the Report
  • Free 1 Month Subscription to Trade Data Base
  • 1 Month Subscription to Price Database (Chemicals only)
  • Complimentary Excel Data Set
  • PPT Version of the Report
  • Power BI Dashboards
  • License Upgrade
  • Free Analyst Hours

Small Business Bundle

Number of Reports: 5

25%

tax inclusive*

  • 5 Reports Included
  • Life Time Acess
  • Analyst Support Related to Report
  • PDF Version of the Report
  • Complimentary Excel Data Set
  • Free Analyst Hours - 50 Hours
  • Free 1 Month Subscription to Trade Data Base
  • 1 Month Subscription to Price Database (Chemicals only)
  • Complimentary Excel Data Set
  • PPT Version of the Report
  • Power BI Dashboards
  • License Upgrade

Growth Bundle

Number of Reports: 8

30%

tax inclusive*

  • 8 Reports Included
  • Life Time Acess
  • Analyst Support Related to Report
  • PDF Version of the Report
  • Complimentary Excel Data Set
  • Free Analyst Hours - 50 Hours
  • Free 1 Month Subscription to Trade Data Base
  • 1 Month Subscription to Price Database (Chemicals only)
  • License Upgrade
  • Free Analyst Hours - 80 Hours
  • Power BI Dashboards

Enterprise Bundle

Number of Reports: 10

35%

tax inclusive*

  • 10 Reports Included
  • Life Time Acess
  • Analyst Support Related to Report
  • PDF Version of the Report
  • Complimentary Excel Data Set
  • Free Analyst Hours - 50 Hours
  • Free 1 Month Subscription to Trade Data Base
  • 1 Month Subscription to Price Database (Chemicals only)
  • License Upgrade
  • Power BI Dashboards
  • Free Analyst Hours - 100 Hours

How To Order

This is a collaborative report by Vishakha Agrawal reflecting perspectives and research-driven insights from Expert Market Research.

Our step-by-step guide will help you select, purchase, and access your reports swiftly, ensuring you get the information that drives your decisions, right when you need it.

License Type

Select License Type

Choose the right license for your needs and access rights.

shopping cart

Click on ‘Buy Now’

Add the report to your cart with one click and proceed to register.

Bookmark Icon

Select Mode of Payment

Choose a payment option for a secure checkout. You will be redirected accordingly.

Strategic Solutions for Informed Decision-Making

Connect For More Information

Our expert team of analysts will offer full support and resolve any queries regarding the report, before and after the purchase.

Our expert team of analysts will offer full support and resolve any queries regarding the report, before and after the purchase.

We employ meticulous research methods, blending advanced analytics and expert insights to deliver accurate, actionable industry intelligence, staying ahead of competitors.

Our skilled analysts offer unparalleled competitive advantage with detailed insights on current and emerging markets, ensuring your strategic edge.

We offer an in-depth yet simplified presentation of industry insights and analysis to meet your specific requirements effectively.

We’re here to help answer any questions about our products and services.

Contact us