Navigating Sustainable, Profitable Growth in a Rapidly Changing World

With more people travelling for leisure and business, food service establishments are experiencing increased demand to meet the evolving needs of a diverse customer base. Significant international hotel chains are experiencing rapid growth throughout the region, propelling the Asia Pacific food service market expansion. Nearly half of the upcoming hotels in the region are being built in partnership with five major hotel companies, including Marriott (60,566 rooms), Accor (47,052 rooms), IHG (34,227 rooms), Hilton (31,606 rooms), and Wyndham (21,455 rooms).
India is a prominent market for food service, with a population of over 17% of the world. The current value of the food services market in India, covering both dining out and ordering in, is estimated at Rs 5.5 lakh crore. Projections indicate that the market will experience an annual growth rate of 10-12% over the next few years, reaching Rs 9 lakh crore to Rs 10 lakh crore by 2030. This growth is anticipated to be fuelled by strong fundamentals, such as an expanding customer base, increasing consumption occasions, and a rise in supply.
In India, online food delivery is anticipated to grow even faster at a CAGR of around 18%, contributing 20% to the overall food services market by 2030. Moreover, the surge in popularity of food delivery apps and online ordering systems has revolutionised the purchasing behaviour of consumers, ultimately contributing to the expansion of the market in Asia Pacific.
In January 2024, Westlife Foodworld (NSE: WESTLIFE), India’s McDonald’s franchisee operator, announced that it was planning to open 300 more outlets by 2027. Through the expansion, the company aims to double the number of stores in India. Similarly, in January 2024, Domino's (NYSE: DPZ) announced its plans to double its store count to 4,000 in the next 5-6 years in India. The company, through the expansion, aims to capitalise on the growing middle class in the country.
Market Analysis by Sector, System, Restaurant, and Region:
- The market on the basis of sector can be divided into commercial and non-commercial.
- Based on system, the market can be divided into conventional foodservice system, centralised foodservice system, ready prepared foodservice system, and assembly-serve foodservice system.
- By restaurants, the market is classified into fast food restaurants, full-service restaurants, limited-service restaurants, and special food services restaurants.
- The major countries of food service in the Asia Pacific include China, India, Japan, ASEAN, and Australia, among others.
Key Findings of the Report:
- By 2030, it is anticipated that the food services sector in India will grow to a value of Rs 10 lakh crore, while the potential customer base is projected to increase to 45 crores.
- The growing middle-class population, coupled with rapid urbanisation and healthy economic growth in the region, is aiding the Asia Pacific food service market growth.
- International brands and fast food chains in the region are adopting localisation strategies and developing menus that cater to local preferences, fuelling the market growth.
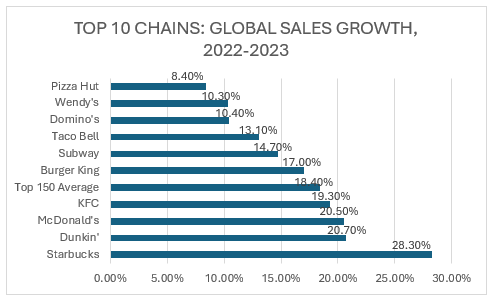
- On a global scale, there has been a rise in expansion efforts by leading food chains, with the QSR chain segment emerging as one of the fastest growing categories within the food service sector.
Leading Players in the Global Food Service Sector
Read more about this report - REQUEST FREE SAMPLE COPY IN PDF
- Key players in the market are adopting innovative technologies to streamline operations, expand revenue channels, and improve customer experiences.
Key Offerings of the Report:
- The EMR report gives an overview of the Asia Pacific food service market for the periods (2019-2025) and (2026-2035).
- The report also offers the historical (2019-2025) and forecast (2026-2035) markets for food service in the Asia Pacific, based on the sector, system, restaurant, and country.
- The report analyses the market dynamics, covering the key demand and price indicators in the market, along with an assessment of the SWOT and Porter’s Five Forces models.
Top Players:
The major players in the Asia Pacific food service market are:
- McDonald’s Corporation
- Domino’s Pizza Inc.
- Yum! Brands, Inc.
- Burger King Corporation
- DD IP Holder LLC (Golden Donuts Inc)
- Tim Hortons Restaurants International GmbH
- J.CO Donuts & Coffee’s
- Nando’s
- Subway IP LLC
- Starbucks Corporation
- Others
The comprehensive report by EMR looks into the market share, capacity, and latest developments like mergers and acquisitions, plant turnarounds, and capacity expansions of the major players.
About Us
Expert Market Research (EMR) is a leading market research and business intelligence company, ensuring its clients remain at the vanguard of their industries by providing them with exhaustive and actionable market data through its syndicated and custom market reports, covering over 15 major industry domains. The company's expansive and ever-growing database of reports, which are constantly updated, includes reports from industry verticals like chemicals and materials, food and beverages, energy and mining, technology and media, consumer goods, pharmaceuticals, agriculture, and packaging.
EMR leverages its state-of-the-art technological and analytical tools, along with the expertise of its highly skilled team of over a 100 analysts and more than 3000 consultants, to help its clients, ranging from Fortune 1000 companies to small and medium sized enterprises, easily grasp the expansive industry data and help them in formulating market and business strategies, which ensure that they remain ahead of the curve.
Contact Us
Expert Market Research
Website: www.expertmarketresearch.com
Email: [email protected]
US & Canada Phone no: +1-415-325-5166
UK Phone no: +44-702-402-5790


Pricing Plans
Upto 15% Off
USD
-
$3999 $3599
-
$2499 $2249
-
$4999 $4249
-
$5999 $5099
Request Sample
Report Summary
| REPORT FEATURES | DETAILS |
| Base Year | 2025 |
| Historical Period | 2019-2025 |
| Forecast Period | 2026-2035 |
| Scope of the Report |
Historical and Forecast Trends, Industry Drivers and Constraints, Historical and Forecast Market Analysis by Segment:
|
| Breakup by Sector |
|
| Breakup by Systems |
|
| Breakup by Restaurants |
|
| Breakup by Region |
|
| Market Dynamics |
|
| Competitive Landscape |
|
| Companies Covered |
|
How To Order
Our step-by-step guide will help you select, purchase, and access your reports swiftly, ensuring you get the information that drives your decisions, right when you need it.

Select License Type
Choose the right license for your needs and access rights.

Click on ‘Buy Now’
Add the report to your cart with one click and proceed to register.

Select Mode of Payment
Choose a payment option for a secure checkout. You will be redirected accordingly.
Single User License
USD 3,999
USD 3,599
tax inclusive*
- All Segments
- Printing Restrictions
- PDF Delivered via Email
- Custom Report Layout
- Post Sales Analysts Support
- Periodic Updates
- Unlimited Prints
Datasheet
USD 2,499
USD 2,249
tax inclusive*
- Selected Segments
- Printing Restrictions
- Excel Spreadsheet Delivered via Email
- Full Report
- Periodic Updates
- Post Sales Analysts Support
- Unlimited Prints
Five User License
USD 4,999
USD 4,249
tax inclusive*
- All Segments
- Five Prints Available
- PDF Delivered via Email
- Limited Free Customization
- Post Sales Analyst Support
- Custom Report Layout
- Periodic Updates
- Unlimited Prints
Corporate License
USD 5,999
USD 5,099
tax inclusive*
- All Segments
- Unlimited Prints Available
- PDF & Excel Delivery via Email
- Limited Free Customization
- Post Sales Analysts Support
- Discount On Next Update
- Custom Report Layout
*Please note that the prices mentioned below are starting prices for each bundle type. Kindly contact our team for further details.*
Flash Bundle
Small Business Bundle
Growth Bundle
Enterprise Bundle
- Life Time Access
- Analyst Support Related to Report
- PDF Version of the Report
- Complimentary Excel Data Set
- Free Analyst Hours
- Complimentary Free 1 Month Subscription to Trade Data Base
- Complimentary One Month Subscription to Price Database (Chemicals only)
- Complimentary PPT Version of the Report
- Complimentary License Upgrade
- Complimentary Power BI Dashboards
- Life Time Access
- Analyst Support Related to Report
- PDF Version of the Report
- Complimentary Excel Data Set
- Free Analyst Hours - 50 Hours
- Complimentary Free 1 Month Subscription to Trade Data Base
- Complimentary One Month Subscription to Price Database (Chemicals only)
- Complimentary PPT Version of the Report
- Complimentary License Upgrade
- Complimentary Power BI Dashboards
- Life Time Access
- Analyst Support Related to Report
- PDF Version of the Report
- Complimentary Excel Data Set
- Free Analyst Hours - 80 Hours
- Complimentary Free 1 Month Subscription to Trade Data Base
- Complimentary One Month Subscription to Price Database (Chemicals only)
- Complimentary PPT Version of the Report
- Complimentary License Upgrade
- Complimentary Power BI Dashboards
- Life Time Access
- Analyst Support Related to Report
- PDF Version of the Report
- Complimentary Excel Data Set
- Free Analyst Hours - 100 Hours
- Complimentary Free 1 Month Subscription to Trade Data Base
- Complimentary One Month Subscription to Price Database (Chemicals only)
- Complimentary PPT Version of the Report
- Complimentary License Upgrade
- Complimentary Power BI Dashboards
*Please note that the prices mentioned below are starting prices for each bundle type. Kindly contact our team for further details.*
Flash Bundle
Number of Reports: 3
20%
tax inclusive*
- 3 Reports Included
- Life Time Acess
- Analyst Support Related to Report
- PDF Version of the Report
- Free 1 Month Subscription to Trade Data Base
- 1 Month Subscription to Price Database (Chemicals only)
- Complimentary Excel Data Set
- PPT Version of the Report
- Power BI Dashboards
- License Upgrade
- Free Analyst Hours
Small Business Bundle
Number of Reports: 5
25%
tax inclusive*
- 5 Reports Included
- Life Time Acess
- Analyst Support Related to Report
- PDF Version of the Report
- Complimentary Excel Data Set
- Free Analyst Hours - 50 Hours
- Free 1 Month Subscription to Trade Data Base
- 1 Month Subscription to Price Database (Chemicals only)
- Complimentary Excel Data Set
- PPT Version of the Report
- Power BI Dashboards
- License Upgrade
Growth Bundle
Number of Reports: 8
30%
tax inclusive*
- 8 Reports Included
- Life Time Acess
- Analyst Support Related to Report
- PDF Version of the Report
- Complimentary Excel Data Set
- Free Analyst Hours - 50 Hours
- Free 1 Month Subscription to Trade Data Base
- 1 Month Subscription to Price Database (Chemicals only)
- License Upgrade
- Free Analyst Hours - 80 Hours
- Power BI Dashboards
Enterprise Bundle
Number of Reports: 10
35%
tax inclusive*
- 10 Reports Included
- Life Time Acess
- Analyst Support Related to Report
- PDF Version of the Report
- Complimentary Excel Data Set
- Free Analyst Hours - 50 Hours
- Free 1 Month Subscription to Trade Data Base
- 1 Month Subscription to Price Database (Chemicals only)
- License Upgrade
- Power BI Dashboards
- Free Analyst Hours - 100 Hours


