Navigating Sustainable, Profitable Growth in a Rapidly Changing World

The global octopus market is primarily propelled by the increasing global demand for seafoods and innovative dishes. The production of fish and seafood stands at nearly 200 million tons annually, with octopus harvests estimated between 350,000 to 500,000 tons per year, covering 20 to 100 species. Octopuses are rich in nutrients like iron, vitamin B12, and selenium, which is boosting their global consumption.
The trend towards exotic foods is driving the demand, especially in regions like Japan, South Korea, and the Mediterranean, where octopus is a staple in many dishes. Countries such as Spain and Portugal also export octopus within Europe. There is a growing emphasis on sustainable fishing practices, with two octopus fisheries currently certified by the Marine Stewardship Council. Additionally, innovative product forms, such as frozen or smoked octopus, along with strict quality standards, are expanding market opportunities while ensuring food safety and sustainability.
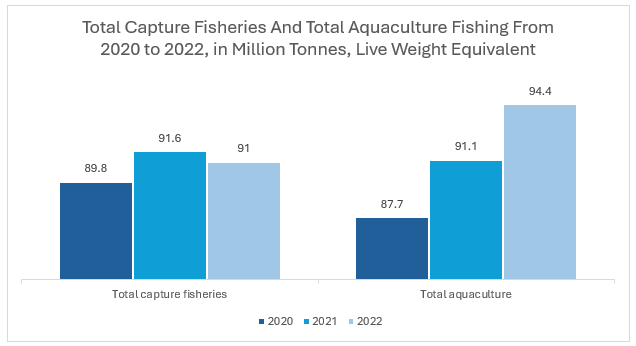
According to the FAO data, the trend of aquaculture is increasing, which reached 94.4 million tonnes in 2022 which was only 87.7 million tonnes in 2020. The same trend can be observed for octopus production. Octopus farming is gaining traction in the aquaculture industry due to the biological advantages of octopuses. They grow quickly and have short lifespans of one to two years, allowing for faster harvest cycles and a steady supply to meet the rising demand.
Read more about this report - REQUEST FREE SAMPLE COPY IN PDF
Market Breakup by Product Type, Distribution Channel, and Region:
- Based on product type, the market is divided into fresh, frozen, and others (smocked, dried, or salted).
- The market by distribution channel is segmented into direct and indirect.
- Region-wise, the market is divided into North America, Europe, the Asia Pacific, Latin America, and the Middle East and Africa.
Key Findings of the Report:
Nutritional benefits associated with the consumption of octopus are driving its consumption. Octopuses are low in fat and high in nutrients like iron, vitamin B12, and selenium, making it popular among health-conscious consumers.
The octopus market growth is driven by rising demand for exotic seafood and increased production through aquaculture.
Octopus farming is becoming more prominent due to its biological characteristics, such as rapid growth and short lifespans. Innovations in product forms like frozen and smoked octopus-based foods provide opportunities to food manufacturers, further ensuring food safety and quality.
There is an increased focus on sustainable and ethical fishing practices in the market, compelling suppliers to adopt sustainable practices.
Key Offerings of the Report:
The EMR report gives an overview of the global octopus market for the periods (2019-2025) and (2026-2035).
The report also offers historical (2019-2025) and forecast (2026-2035) market information for the product type, distribution channel, and major regions of the market.
The report analyses the market dynamics, covering the key demand and price indicators in the market, along with providing an assessment of the SWOT and Porter’s Five Forces models.
Top Players:
The major players in the global octopus market are:
- Frigorificos De Camarinas S.L.
- Mackay Reef Fish Supplies Pty Ltd.
- Amigo Sea Food Co.
- Siam Canadian Foods Co. Ltd.
- Nueva Pescanova, S.L.
- Others
The comprehensive report by EMR looks into the market share, capacity, and latest developments like mergers and acquisitions, plant turnarounds, and capacity expansions of the major players.
About Us
Expert Market Research (EMR) is a leading market research and business intelligence company, ensuring its clients remain at the vanguard of their industries by providing them with exhaustive and actionable market data through its syndicated and custom market reports, covering over 15 major industry domains. The company's expansive and ever-growing database of reports, which are constantly updated, includes reports from industry verticals like chemicals and materials, food and beverages, energy and mining, technology and media, consumer goods, pharmaceuticals, agriculture, and packaging.
EMR leverages its state-of-the-art technological and analytical tools, along with the expertise of its highly skilled team of over a 100 analysts and more than 3000 consultants, to help its clients, ranging from Fortune 1000 companies to small and medium sized enterprises, easily grasp the expansive industry data and help them in formulating market and business strategies, which ensure that they remain ahead of the curve.
Contact Us
Expert Market Research
Website: www.expertmarketresearch.com
Email: sales@expertmarketresearch.com
US & Canada Phone no: +1-415-325-5166
UK Phone no: +44-702-402-5790


Pricing Plans
Upto 15% Off
USD
-
$2499 $2249
-
$3999 $3599
-
$4999 $4249
-
$5999 $5099
Request Sample
Report Summary
| REPORT FEATURES | DETAILS |
| Base Year | 2025 |
| Historical Period | 2019-2025 |
| Forecast Period | 2026-2035 |
| Scope of the Report |
Historical and Forecast Trends, Industry Drivers and Constraints, Historical and Forecast Market Analysis by Segment:
|
| Breakup by Product Type |
|
| Breakup by Distribution Channel |
|
| Breakup by Region |
|
| Market Dynamics |
|
| Trade Data Analysis |
|
| Competitive Landscape |
|
| Companies Covered |
|
How To Order
Our step-by-step guide will help you select, purchase, and access your reports swiftly, ensuring you get the information that drives your decisions, right when you need it.

Select License Type
Choose the right license for your needs and access rights.

Click on ‘Buy Now’
Add the report to your cart with one click and proceed to register.

Select Mode of Payment
Choose a payment option for a secure checkout. You will be redirected accordingly.
Datasheet
USD 2,499
USD 2,249
tax inclusive*
- Selected Segments
- Printing Restrictions
- Excel Spreadsheet Delivered via Email
- Full Report
- Periodic Updates
- Post Sales Analysts Support
- Unlimited Prints
Single User License
USD 3,999
USD 3,599
tax inclusive*
- All Segments
- Printing Restrictions
- PDF Delivered via Email
- Custom Report Layout
- Post Sales Analysts Support
- Periodic Updates
- Unlimited Prints
Five User License
USD 4,999
USD 4,249
tax inclusive*
- All Segments
- Five Prints Available
- PDF Delivered via Email
- Limited Free Customization
- Post Sales Analyst Support
- Custom Report Layout
- Periodic Updates
- Unlimited Prints
Corporate License
USD 5,999
USD 5,099
tax inclusive*
- All Segments
- Unlimited Prints Available
- PDF & Excel Delivery via Email
- Limited Free Customization
- Post Sales Analysts Support
- Discount On Next Update
- Custom Report Layout
*Please note that the prices mentioned below are starting prices for each bundle type. Kindly contact our team for further details.*
Flash Bundle
Small Business Bundle
Growth Bundle
Enterprise Bundle
- Life Time Access
- Analyst Support Related to Report
- PDF Version of the Report
- Complimentary Excel Data Set
- Free Analyst Hours
- Complimentary Free 1 Month Subscription to Trade Data Base
- Complimentary One Month Subscription to Price Database (Chemicals only)
- Complimentary PPT Version of the Report
- Complimentary License Upgrade
- Complimentary Power BI Dashboards
- Life Time Access
- Analyst Support Related to Report
- PDF Version of the Report
- Complimentary Excel Data Set
- Free Analyst Hours - 50 Hours
- Complimentary Free 1 Month Subscription to Trade Data Base
- Complimentary One Month Subscription to Price Database (Chemicals only)
- Complimentary PPT Version of the Report
- Complimentary License Upgrade
- Complimentary Power BI Dashboards
- Life Time Access
- Analyst Support Related to Report
- PDF Version of the Report
- Complimentary Excel Data Set
- Free Analyst Hours - 80 Hours
- Complimentary Free 1 Month Subscription to Trade Data Base
- Complimentary One Month Subscription to Price Database (Chemicals only)
- Complimentary PPT Version of the Report
- Complimentary License Upgrade
- Complimentary Power BI Dashboards
- Life Time Access
- Analyst Support Related to Report
- PDF Version of the Report
- Complimentary Excel Data Set
- Free Analyst Hours - 100 Hours
- Complimentary Free 1 Month Subscription to Trade Data Base
- Complimentary One Month Subscription to Price Database (Chemicals only)
- Complimentary PPT Version of the Report
- Complimentary License Upgrade
- Complimentary Power BI Dashboards
*Please note that the prices mentioned below are starting prices for each bundle type. Kindly contact our team for further details.*
Flash Bundle
Number of Reports: 3
20%
tax inclusive*
- 3 Reports Included
- Life Time Acess
- Analyst Support Related to Report
- PDF Version of the Report
- Free 1 Month Subscription to Trade Data Base
- 1 Month Subscription to Price Database (Chemicals only)
- Complimentary Excel Data Set
- PPT Version of the Report
- Power BI Dashboards
- License Upgrade
- Free Analyst Hours
Small Business Bundle
Number of Reports: 5
25%
tax inclusive*
- 5 Reports Included
- Life Time Acess
- Analyst Support Related to Report
- PDF Version of the Report
- Complimentary Excel Data Set
- Free Analyst Hours - 50 Hours
- Free 1 Month Subscription to Trade Data Base
- 1 Month Subscription to Price Database (Chemicals only)
- Complimentary Excel Data Set
- PPT Version of the Report
- Power BI Dashboards
- License Upgrade
Growth Bundle
Number of Reports: 8
30%
tax inclusive*
- 8 Reports Included
- Life Time Acess
- Analyst Support Related to Report
- PDF Version of the Report
- Complimentary Excel Data Set
- Free Analyst Hours - 50 Hours
- Free 1 Month Subscription to Trade Data Base
- 1 Month Subscription to Price Database (Chemicals only)
- License Upgrade
- Free Analyst Hours - 80 Hours
- Power BI Dashboards
Enterprise Bundle
Number of Reports: 10
35%
tax inclusive*
- 10 Reports Included
- Life Time Acess
- Analyst Support Related to Report
- PDF Version of the Report
- Complimentary Excel Data Set
- Free Analyst Hours - 50 Hours
- Free 1 Month Subscription to Trade Data Base
- 1 Month Subscription to Price Database (Chemicals only)
- License Upgrade
- Power BI Dashboards
- Free Analyst Hours - 100 Hours


