Navigating Sustainable, Profitable Growth in a Rapidly Changing World

The growth of the United States footwear market is fueled by the increasing demand for comfortable footwear for everyday usage that offers features such as cushioned insoles, padding on sandals, and flexible outsoles, among others. Footwear, made from materials like leather, plastic, rubber, and synthetics, serves purposes ranging from protection and comfort to aesthetic appeal. Encompassing shoes, boots, sandals, and slippers, footwear protects feet from injuries and harsh environments. Modern footwear integrates advanced technology for support and comfort, catering to activities like running and hiking, while also playing a key role in fashion and individual style.
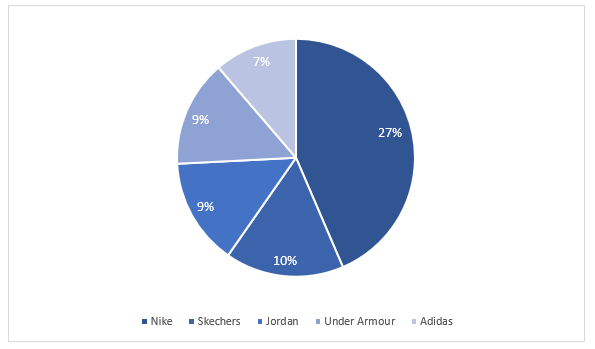
Fig.: Top Five Athletic Footwear Brands with the Largest Revenue Shares, 2023
The rising demand for vibrant colours like neon and hot pink, along with bold patterns, adds a fun and expressive element to footwear, driving growth in the US market. These trends allow individuals to showcase their personality through their choice of shoes.
Amid the rising trend of sustainable fashion, many footwear manufacturers are incorporating eco-friendly materials like natural fibers, ethically sourced leather, vegan leather, and recycled polyester into their products. This shift towards renewable resources reflects a commitment to environmental responsibility and resonates with consumers seeking sustainable options.
Increased investments in online and print advertising by footwear brands are boosting market visibility and driving growth in the U.S. footwear market. Additionally, there is a growing demand for athletic footwear with cushioned insoles and other supportive features to enhance the performance of sports professionals. These trends highlight the focus of footwear manufacturers on both effective promotion and offering improved comfort to consumers.
Read more about this report - REQUEST FREE SAMPLE COPY IN PDF
Market Breakup by Material, Product, Pricing, End Use, Distribution Channel, and Region:
- The market is segmented based on material into rubber, plastic, leather, and fabric, among others.
- On the basis of product, the market can be categorised into athletic footwear and non-athletic footwear.
- The market is segmented on the basis of pricing into mass and premium.
- Based on end use, the market can be divided into men, women, and kids.
- The market is further categorized on the basis of distribution channel into hypermarkets/supermarkets, speciality stores, and online channels, among others.
- By region, the market is categorised into New England, Mideast, Great Lakes, Plains, Southeast, Southwest, Rocky Mountain, and Far West.
Key Findings of the Report:
- Athletic footwear dominates the U.S. market due to its use in running, walking, and sports. This segment's growth is bolstered by the casual use of sports shoes and increasing partnerships between professional sports teams and shoe brands.
- Rising health and fitness trends drive the demand for men’s athletic shoes while evolving fashion boosts the popularity of casual footwear. Women's footwear is set to experience significant demand, fueled by increased purchasing power and celebrity endorsements.
- Expansion into emerging markets and collaboration with international brands present new opportunities for footwear manufacturers. Brands are focusing on offering various footwear options, supporting innovation and diversification. This strategic move enables U.S. footwear companies to broaden their reach and strengthen their position in the global market.
- Regulations and standards on quality and sustainability are reshaping industry practices. Compliance ensures products meet set criteria, enhancing consumer trust.
Key Offerings of the Report:
- The EMR report gives an overview of the footwear market in the United States for the periods (2019-2025) and (2026-2035).
- The report also offers historical (2019-2025) and forecast (2026-2035) market information for the material, product, pricing, end use, distribution channel, and region of the United States footwear market.
- The report analyses the market dynamics, covering the key demand and price indicators in the market, along with providing an assessment of the SWOT and Porter’s Five Forces models.
Top Players:
The major players in the United States footwear market are:
- Nike, Inc.
- adidas AG
- PUMA SE
- New Balance Athletics, Inc.
- ASICS Corporation
- Skechers U.S.A., Inc.
- Under Armour, Inc.
- FILA Luxembourg, S.a.r.l.
- Okabashi Brands, Inc.
- The Aldo Group Inc.
- Others
The comprehensive report by EMR looks into the market share, capacity, and latest developments like mergers and acquisitions, plant turnarounds, and capacity expansions of the major players.
About Us
Expert Market Research (EMR) is a leading market research and business intelligence company, ensuring its clients remain at the vanguard of their industries by providing them with exhaustive and actionable market data through its syndicated and custom market reports, covering over 15 major industry domains. The company's expansive and ever-growing database of reports, which are constantly updated, includes reports from industry verticals like chemicals and materials, food and beverages, energy and mining, technology and media, consumer goods, pharmaceuticals, agriculture, and packaging.
EMR leverages its state-of-the-art technological and analytical tools, along with the expertise of its highly skilled team of over a 100 analysts and more than 3000 consultants, to help its clients, ranging from Fortune 1000 companies to small and medium sized enterprises, easily grasp the expansive industry data and help them in formulating market and business strategies, which ensure that they remain ahead of the curve.
Contact Us
Expert Market Research
Website: www.expertmarketresearch.com
Email: [email protected]
US & Canada Phone no: +1-415-325-5166
UK Phone no: +44-702-402-5790


Pricing Plans
Upto 15% Off
USD
-
$3999 $3599
-
$2499 $2249
-
$4999 $4249
-
$5999 $5099
Request Sample
Report Summary
| REPORT FEATURES | DETAILS |
| Base Year | 2025 |
| Historical Period | 2019-2025 |
| Forecast Period | 2026-2035 |
| Scope of the Report |
Historical and Forecast Trends, Industry Drivers and Constraints, Historical and Forecast Market Analysis by Segment:
|
| Breakup by Material |
|
| Breakup by Product |
|
| Breakup by Pricing |
|
| Breakup by End Use |
|
| Breakup by Distribution Channel |
|
| Breakup by Region |
|
| Market Dynamics |
|
| Competitive Landscape |
|
| Companies Covered |
|
How To Order
Our step-by-step guide will help you select, purchase, and access your reports swiftly, ensuring you get the information that drives your decisions, right when you need it.

Select License Type
Choose the right license for your needs and access rights.

Click on ‘Buy Now’
Add the report to your cart with one click and proceed to register.

Select Mode of Payment
Choose a payment option for a secure checkout. You will be redirected accordingly.
Single User License
USD 3,999
USD 3,599
tax inclusive*
- All Segments
- Printing Restrictions
- PDF Delivered via Email
- Custom Report Layout
- Post Sales Analysts Support
- Periodic Updates
- Unlimited Prints
Datasheet
USD 2,499
USD 2,249
tax inclusive*
- Selected Segments
- Printing Restrictions
- Excel Spreadsheet Delivered via Email
- Full Report
- Periodic Updates
- Post Sales Analysts Support
- Unlimited Prints
Five User License
USD 4,999
USD 4,249
tax inclusive*
- All Segments
- Five Prints Available
- PDF Delivered via Email
- Limited Free Customization
- Post Sales Analyst Support
- Custom Report Layout
- Periodic Updates
- Unlimited Prints
Corporate License
USD 5,999
USD 5,099
tax inclusive*
- All Segments
- Unlimited Prints Available
- PDF & Excel Delivery via Email
- Limited Free Customization
- Post Sales Analysts Support
- Discount On Next Update
- Custom Report Layout
*Please note that the prices mentioned below are starting prices for each bundle type. Kindly contact our team for further details.*
Flash Bundle
Small Business Bundle
Growth Bundle
Enterprise Bundle
- Life Time Access
- Analyst Support Related to Report
- PDF Version of the Report
- Complimentary Excel Data Set
- Free Analyst Hours
- Complimentary Free 1 Month Subscription to Trade Data Base
- Complimentary One Month Subscription to Price Database (Chemicals only)
- Complimentary PPT Version of the Report
- Complimentary License Upgrade
- Complimentary Power BI Dashboards
- Life Time Access
- Analyst Support Related to Report
- PDF Version of the Report
- Complimentary Excel Data Set
- Free Analyst Hours - 50 Hours
- Complimentary Free 1 Month Subscription to Trade Data Base
- Complimentary One Month Subscription to Price Database (Chemicals only)
- Complimentary PPT Version of the Report
- Complimentary License Upgrade
- Complimentary Power BI Dashboards
- Life Time Access
- Analyst Support Related to Report
- PDF Version of the Report
- Complimentary Excel Data Set
- Free Analyst Hours - 80 Hours
- Complimentary Free 1 Month Subscription to Trade Data Base
- Complimentary One Month Subscription to Price Database (Chemicals only)
- Complimentary PPT Version of the Report
- Complimentary License Upgrade
- Complimentary Power BI Dashboards
- Life Time Access
- Analyst Support Related to Report
- PDF Version of the Report
- Complimentary Excel Data Set
- Free Analyst Hours - 100 Hours
- Complimentary Free 1 Month Subscription to Trade Data Base
- Complimentary One Month Subscription to Price Database (Chemicals only)
- Complimentary PPT Version of the Report
- Complimentary License Upgrade
- Complimentary Power BI Dashboards
*Please note that the prices mentioned below are starting prices for each bundle type. Kindly contact our team for further details.*
Flash Bundle
Number of Reports: 3
20%
tax inclusive*
- 3 Reports Included
- Life Time Acess
- Analyst Support Related to Report
- PDF Version of the Report
- Free 1 Month Subscription to Trade Data Base
- 1 Month Subscription to Price Database (Chemicals only)
- Complimentary Excel Data Set
- PPT Version of the Report
- Power BI Dashboards
- License Upgrade
- Free Analyst Hours
Small Business Bundle
Number of Reports: 5
25%
tax inclusive*
- 5 Reports Included
- Life Time Acess
- Analyst Support Related to Report
- PDF Version of the Report
- Complimentary Excel Data Set
- Free Analyst Hours - 50 Hours
- Free 1 Month Subscription to Trade Data Base
- 1 Month Subscription to Price Database (Chemicals only)
- Complimentary Excel Data Set
- PPT Version of the Report
- Power BI Dashboards
- License Upgrade
Growth Bundle
Number of Reports: 8
30%
tax inclusive*
- 8 Reports Included
- Life Time Acess
- Analyst Support Related to Report
- PDF Version of the Report
- Complimentary Excel Data Set
- Free Analyst Hours - 50 Hours
- Free 1 Month Subscription to Trade Data Base
- 1 Month Subscription to Price Database (Chemicals only)
- License Upgrade
- Free Analyst Hours - 80 Hours
- Power BI Dashboards
Enterprise Bundle
Number of Reports: 10
35%
tax inclusive*
- 10 Reports Included
- Life Time Acess
- Analyst Support Related to Report
- PDF Version of the Report
- Complimentary Excel Data Set
- Free Analyst Hours - 50 Hours
- Free 1 Month Subscription to Trade Data Base
- 1 Month Subscription to Price Database (Chemicals only)
- License Upgrade
- Power BI Dashboards
- Free Analyst Hours - 100 Hours


