Consumer Insights
Uncover trends and behaviors shaping consumer choices today
Procurement Insights
Optimize your sourcing strategy with key market data
Industry Stats
Stay ahead with the latest trends and market analysis.
Germany paid the most for Electricity Endex in Q3 2026: USD 134/MWh, up 31.4% from USD 102/MWh in Q2. Prices there follow the deepest and most liquid market, where gas sets the margin. Worldwide, the average rose 27.7% to USD 120/MWh from USD 94/MWh, mostly because gas and carbon costs rose and hedgers paid higher premiums. What about Q4 2026? We expect a global average somewhere in the USD 119-139/MWh range, with gas prices, carbon costs and weather doing most of the work.
Electricity Endex refers to baseload power futures cleared on the Endex exchange, where utilities, industrial buyers and traders lock in the price of power for later periods. This report tracks the front-year baseload contract for the main northwest European markets, quoted in US dollars per megawatt-hour. Prices follow expectations for gas and carbon, nuclear and renewable output, weather and the risk premiums that hedgers pay.
Futures are traded for the Netherlands, Belgium, Germany and France, and most power buyers hedge a share of their needs a year or more ahead. The German front-year contract settled near 128 euros per megawatt-hour at the end of September 2026, against about 104 at the end of July, while the French contract rose from about 65 to about 91 euros. Contracts for later years were lower, which shows the market expects the current gas squeeze to ease.
Prices should rise through the rest of 2026. Firm gas prices and winter risk premiums support the curve. Year on year, the global average has moved from USD 88/MWh to USD 120/MWh, an increase of 36.4%.
For Q4, the risks are weighted toward higher prices. What could push prices higher? Higher gas prices, a cold winter or outages at nuclear plants would lift prices. What could pull them lower? Falling gas prices, mild weather or strong wind and solar output would lower prices.
| Region | 2026 Price Range (USD/MWh) | Outlook |
| Global Average | 119 - 139 | Gas costs lift the curve |
| Germany | 131 - 153 | Gas costs keep the curve high |
| Netherlands | 127 - 149 | Gas hub pricing lifts the curve |
| Belgium | 126 - 148 | Nuclear outages lift the curve |
| France | 91 - 107 | Nuclear availability sets the curve |
In Q3 2026, the average price in Germany firmed 31.4% to USD 134/MWh, compared with USD 102/MWh in Q2. Prices rose sharply as gas prices climbed and carbon costs rose. Compared with Q3 2025, when Germany averaged USD 98/MWh, the current price is 36.7% higher. The gap to the four-market average of USD 120/MWh was 11.7% above for Germany.
Why did the price of Electricity Endex change in Q3 2026 in Germany?
Germany rose sharply. Gas prices climbed and carbon costs rose. Buyers kept orders close to immediate needs. At USD 134/MWh, Germany is 39.6% higher than in Q4 2025, when the average was USD 96/MWh, and the global average is 36.4% higher over the same period.
The Netherlands' average gained 30.0% in Q3 2026, to USD 130/MWh from USD 100/MWh in Q2. Prices rose sharply as gas prices climbed and hedging demand picked up. The current level is 35.4% above the Q3 2025 average of USD 96/MWh. Against the four-market average of USD 120/MWh, the Netherlands stood 8.3% above in the quarter.
Why did the price of Electricity Endex change in Q3 2026 in Netherlands?
The Netherlands rose sharply. Gas prices climbed and hedging demand picked up. Traders checked stock levels before committing to larger volumes. Since Q4 2025 the price in the Netherlands has gone up 38.3%, from USD 94/MWh to USD 130/MWh, while the global average has gone up 36.4%.
Prices in Belgium rose 30.3% in Q3 2026 to USD 129/MWh, against USD 99/MWh in Q2. Prices rose sharply as gas prices climbed and nuclear availability stayed uncertain. Compared with Q3 2025, when Belgium averaged USD 95/MWh, the current price is 35.8% higher. The gap to the four-market average of USD 120/MWh was 7.5% above for Belgium.
Why did the price of Electricity Endex change in Q3 2026 in Belgium?
Belgium rose sharply. Gas prices climbed and nuclear availability stayed uncertain. Offers were reviewed weekly as contract talks went on. Compared with the Q4 2025 average of USD 93/MWh, the price in Belgium has changed by +38.7%, against +36.4% for the global average.
France recorded a 17.6% gain in Q3 2026, with the average rising to USD 87/MWh from USD 74/MWh in Q2. Prices rose sharply as heatwaves and nuclear curtailments raised winter risk premiums. The current level is 38.1% above the Q3 2025 average of USD 63/MWh. Against the four-market average of USD 120/MWh, France stood 27.5% below in the quarter.
Why did the price of Electricity Endex change in Q3 2026 in France?
France rose sharply. Heatwaves and nuclear curtailments raised winter risk premiums. Most deals were settled on short notice. At USD 87/MWh, France is 29.9% higher than in Q4 2025, when the average was USD 67/MWh, and the global average is 36.4% higher over the same period.
Prices in Germany climbed 4.1% in Q2 2026 to USD 102/MWh, against USD 98/MWh in Q1. Prices rose as gas prices firmed. Compared with Q2 2025, when Germany averaged USD 96/MWh, the current price is 6.2% higher. The gap to the four-market average of USD 94/MWh was 8.5% above for Germany.
Why did the price of Electricity Endex change in Q2 2026 in Germany?
Germany rose. Gas prices firmed. Order sizes stayed modest through the quarter. Q1 had brought a 2.1% gain, and by the end of Q2 the price was 6.2% above the Q2 2025 average of USD 96/MWh. Q3 then extended the move, taking the price to USD 134/MWh.
The Netherlands recorded a 4.2% gain in Q2 2026, with the average rising to USD 100/MWh from USD 96/MWh in Q1. Prices rose as hedging demand picked up. The current level is 6.4% above the Q2 2025 average of USD 94/MWh. Against the four-market average of USD 94/MWh, the Netherlands stood 6.4% above in the quarter.
Why did the price of Electricity Endex change in Q2 2026 in Netherlands?
The Netherlands rose. Hedging demand picked up. Contract talks were mostly settled before the quarter began. After +2.1% in Q1, the quarter closed 6.4% above its year-earlier level of USD 94/MWh, and in Q3 the move was extended, to USD 130/MWh.
In Q2 2026, the average price in Belgium gained 4.2% to USD 99/MWh, compared with USD 95/MWh in Q1. Prices rose as gas prices firmed. Compared with Q2 2025, when Belgium averaged USD 93/MWh, the current price is 6.5% higher. The gap to the four-market average of USD 94/MWh was 5.3% above for Belgium.
Why did the price of Electricity Endex change in Q2 2026 in Belgium?
Belgium rose. Gas prices firmed. Sellers adjusted offers in small steps. Year on year the price is 6.5% higher than the USD 93/MWh of Q2 2025, following +2.2% in Q1. Q3 extended the move, with the price at USD 129/MWh.
France's average rose 5.7% in Q2 2026, to USD 74/MWh from USD 70/MWh in Q1. Prices rose as hedging demand picked up. The current level is 25.4% above the Q2 2025 average of USD 59/MWh. Against the four-market average of USD 94/MWh, France stood 21.3% below in the quarter.
Why did the price of Electricity Endex change in Q2 2026 in France?
France rose. Hedging demand picked up. Buyers worked through existing stock before placing new orders. Q1 had brought a 4.5% gain, and by the end of Q2 the price was 25.4% above the Q2 2025 average of USD 59/MWh. Q3 then extended the move, taking the price to USD 87/MWh.
Electricity Endex prices rose through 2025 and rose in 2026. The global average moved from USD 85/MWh in Q1 2025 to 86 in Q2, 88 in Q3, 88 in Q4, then 90 in Q1 2026, 94 in Q2 and 120 in Q3, a net gain of roughly 41.2% across the window. Gas prices, carbon costs and weather set the direction.
| Quarter | Price (USD/MWh) | QoQ Change | Direction |
| Q3 2026 | 120 | +27.7% | ↑ Rising |
| Q2 2026 | 94 | +4.4% | ↑ Rising |
| Q1 2026 | 90 | +2.3% | ↑ Rising |
| Q4 2025 | 88 | +0.0% | - Stable |
| Q3 2025 | 88 | +2.3% | ↑ Rising |
| Q4 2026 | In Progress | - | - In Progress |
2025 was a year of modest gains for Electricity Endex. Starting near USD 85/MWh in Q1, the global average finished the year at 88 in Q4, a gain of about 3.5%. Gas prices, carbon costs and weather set the direction.
In Germany, prices moved from about USD 94/MWh in Q1 2025 to USD 96/MWh by Q4, up roughly 2.1%. Prices rose in Q2 and Q3, then fell in Q4 as expectations for gas and carbon shifted through the year. Relative to the end of 2025, the price in Germany is 39.6% higher at USD 134/MWh.
In the Netherlands, prices moved from about USD 92/MWh in Q1 2025 to USD 94/MWh by Q4, up roughly 2.2%. Prices rose in Q2 and Q3, then fell in Q4 as hedging demand and weather expectations changed through the year. Since the 2025 close of USD 94/MWh, the price in the Netherlands has moved up 38.3%, reaching USD 130/MWh in Q3 2026.
In Belgium, prices moved from about USD 91/MWh in Q1 2025 to USD 93/MWh by Q4, up roughly 2.2%. Prices rose in Q2 and Q3, then fell in Q4 as expectations for gas and carbon shifted through the year. Relative to the end of 2025, the price in Belgium is 38.7% higher at USD 129/MWh.
In France, prices moved from about USD 63/MWh in Q1 2025 to USD 67/MWh by Q4, up roughly 6.3%. Prices fell in Q2, then rose in Q3 and Q4 as hedging demand and weather expectations changed through the year. Since the 2025 close of USD 67/MWh, the price in France has moved up 29.9%, reaching USD 87/MWh in Q3 2026.
Expert Market Research: Your Source for Real-Time Electricity Endex Price Intelligence
We follow Electricity Endex prices in the main producing and consuming countries, and trace each move back to gas prices, carbon costs, weather and demand. Our forecasts draw on gas prices, carbon costs and hedging demand across all reporting regions, so subscribers see why a price moved and not just that it did. Need pricing data, bespoke market analysis, or procurement advisory? Reach out to our team.


Upto 15% Off
USD
$799 $699


*While we strive to always give you current and accurate information, the numbers depicted on the website are indicative and may differ from the actual numbers in the main report. At Expert Market Research, we aim to bring you the latest insights and trends in the market. Using our analyses and forecasts, stakeholders can understand the market dynamics, navigate challenges, and capitalize on opportunities to make data-driven strategic decisions.*
Used by utilities, industrial buyers and traders to lock in the price of power ahead of delivery.
In Q3 2026, it averaged USD 134/MWh in Germany, USD 130/MWh in the Netherlands, USD 129/MWh in Belgium and USD 87/MWh in France. Germany was the priciest market.
The global average went from USD 88/MWh in Q4 2025 to 90 in Q1, 94 in Q2 and 120 in Q3, up 36.4% overall. Prices rose in Q1, rose in Q2 and rose sharply in Q3.
Higher gas and carbon prices and stronger hedging demand lifted the front-year contracts.
We expect a global average somewhere in the USD 119-139/MWh range. Gas prices and carbon costs point to a higher range.
Germany sits at the top and France at the bottom. Germany is dearest because of deep trading and gas-driven pricing, while France is cheapest on cheaper nuclear supply.
Monthly. Need something more current? The Expert Market Research team is available directly.
Gas prices, carbon costs, weather and freight drive the volatility.
Germany, France, the Netherlands and Belgium are the core markets for these contracts.
Hedge in stages and set price triggers rather than buying all cover at once.
One Year Subscription
One Year Subscription
USD 799
USD 699
tax inclusive*
*Please note that the prices mentioned below are starting prices for each bundle type. Kindly contact our team for further details.*
Flash Bundle
Small Business Bundle
Growth Bundle
Enterprise Bundle
*Please note that the prices mentioned below are starting prices for each bundle type. Kindly contact our team for further details.*
Flash Bundle
Number of Reports: 3
20%
tax inclusive*
Small Business Bundle
Number of Reports: 5
25%
tax inclusive*
Growth Bundle
Number of Reports: 8
30%
tax inclusive*
Enterprise Bundle
Number of Reports: 10
35%
tax inclusive*
How To Order

Select License Type
Choose the right license for your needs and access rights.

Click on ‘Buy Now’
Add the report to your cart with one click and proceed to register.

Select Mode of Payment
Choose a payment option for a secure checkout. You will be redirected accordingly.
Strategic Solutions for Informed Decision-Making
Gain insights to stay ahead and seize opportunities.
Get insights & trends for a competitive edge.
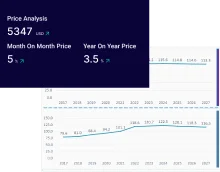
Track prices with detailed trend reports.

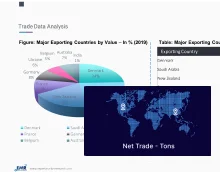
Analyse trade data for supply chain insights.
Leverage cost reports for smart savings
Enhance supply chain with partnerships.
Connect For More Information
Our expert team of analysts will offer full support and resolve any queries regarding the report, before and after the purchase.
Our expert team of analysts will offer full support and resolve any queries regarding the report, before and after the purchase.
We employ meticulous research methods, blending advanced analytics and expert insights to deliver accurate, actionable industry intelligence, staying ahead of competitors.
Our skilled analysts offer unparalleled competitive advantage with detailed insights on current and emerging markets, ensuring your strategic edge.
We offer an in-depth yet simplified presentation of industry insights and analysis to meet your specific requirements effectively.