

Consumer Insights
Uncover trends and behaviors shaping consumer choices today
Procurement Insights
Optimize your sourcing strategy with key market data
Industry Stats
Stay ahead with the latest trends and market analysis.
The global accounts receivable automation market is expected to reach a value of more than USD 4.73 Billion in 2025. The industry is expected to grow at a CAGR of 13.90% during the forecast period of 2026-2035. The growing need for real-time financial transparency and improved cash flow management is driving the accounts receivable automation industry, enabling businesses to streamline invoice processing, reduce payment delays, and enhance operational efficiency, thus aiding the market to attain a valuation of USD 17.38 Billion by 2035.
The increase in online sales volumes transactions that businesses have to process has, therefore created a need for automated invoice processing. Automating these invoices reduces the chances of human error and ensures timely payment reminders, among other factors, that facilitate cash flow, hence business stability. For instance, e-commerce giants like Amazon use automated accounts receivable systems to handle millions of transactions every day; this indicates how automation aids in the scaling of business operations, thereby propelling the growth of the accounts receivable automation market.
The integration of AI, ML, and cloud computing into AR systems enhances invoice processing through intelligent data extraction, fraud detection, and automated payment reconciliation. These technologies reduce manual intervention, lower operational costs, and improve accuracy. For example, AI-powered platforms such as Billtrust and HighRadius help enterprises automate their AR workflows, driving the market forward.
The flexibility, scalability, and cost-effectiveness of cloud-based AR solutions make them increasingly popular among businesses. Cloud platforms allow remote access, real-time data synchronization, and seamless collaboration of finance teams. Companies such as QuickBooks and Xero provide cloud-based AR services that support businesses of all sizes in managing invoices and ensuring smooth financial operations. This continues to drive the accounts receivable automation market around the world.
Compound Annual Growth Rate
13.9%
Value in USD Billion
2026-2035
The accounts receivable (AR) automation market is rapidly growing because businesses are in need of improving cash flow, reducing manual processes, and enhancing financial transparency. The companies within this sector strive to simplify invoice processing, payment tracking, and reconciliation with the use of AI, ML, and cloud-based platforms. Automated AR solutions minimize human errors, reduce operational costs, and enhance payment cycles by allowing real-time invoice management and predictive payment analysis.
Scale-wise, companies are focusing on AI-powered platforms for data extraction, fraud detection, and automated payment reminders. In addition, they integrate advanced analytics to improve cash flow forecasting. Emerging markets, with growth in e-commerce and digital payments, represent huge growth opportunities. Strategic partnerships with ERP providers, financial institutions, and payment gateways further expand the accounts receivable automation market expansion.
For example, HighRadius and Billtrust are scalable cloud-based AR platforms that support any size of business. Moreover, the growing interest in Software-as-a-Service models allows easy subscription-based scaling for enterprises. With an increase in remote work and digital transformation initiatives, the market for AR automation is sure to grow in the long term. Companies that innovate and adapt to the new payment ecosystems will remain competitive and capture a larger share of this expanding market.
One of the major growth drivers has been the overall demand by consumers to reduce the time consumed in financial processes-mostly in the industries such as e-commerce and manufacturing-in that drive growth of accounts receivable automation market. Automated solutions streamline invoicing, payment tracking, and collections to reduce manual errors and maximize cash flow. Such leaders would be companies such as SAP, offering the SAP S/4HANA platform and encompassing AI-powered tools for automation while dealing with invoice processing speeds or accuracy to optimize working capital as well as minimize DSO.
The accounts receivable automation industry is also influenced by the increasing importance of compliance with changing financial regulations and data security standards. Organizations are compelled to maintain detailed reporting and auditing standards, thus adopting automated AR systems that will ensure accurate financial records, timely audits, and fewer regulatory risks. The solutions have built-in compliance features such as real-time monitoring, audit trails, and data encryption. As examples, even Sarbanes-Oxley compliance in the U.S. puts a demand on organizations for healthy financial management, while staying away from expensive penalty provisions and legal troubles by applying automated AR platforms in companies. This regulatory-led need also increases demand for AR automation in secure and transparent methods exponentially.


The accounts receivable automation market is driven by AI integration, blockchain adoption, embedded finance solutions, and cloud-based platforms enhancing transparency, efficiency, and financial management across industries.
Paymerang launched a new Receivables Automation product, enhancing AR processes and offering real-time cash flow insights.
BlackLine expanded its accounts receivable automation offerings by adding e-Invoice Presentment and Payment features after acquiring Data Interconnect, enhancing its digital invoicing and payment processing capabilities.
Mastercard launched Receivables Manager, an automated platform developed with Billtrust, simplifying virtual card payment processing and improving cash flow management for businesses through advanced accounts receivable automation.
BlackLine partnered with Kofax to integrate Tungsten Network's e-invoicing into its AR automation solutions, enhancing electronic invoice capabilities.
Artificial intelligence (AI) and machine learning (ML) are revolutionizing the accounts receivable automation market, as it empowers predictive analytics, fraud detection, and intelligent cash flow forecasting. With the help of AI, powered systems can analyze the patterns of payments and thus, predict customer payment behavior for businesses. The use of ML algorithms by HighRadius in platforms enables processes like credit scoring and payment reconciliation to be automated, which reduces the manual workload and errors. With data-driven insights and faster decision-making, AI adoption continues to reshape AR processes, allowing enterprises to scale operations efficiently while maintaining financial accuracy and transparency, thus augmenting the accounts receivable automation demand growth.
Blockchain technology now represents one of the major themes in AR automation, promising secure, tamper-proof records of transactions. As a decentralized ledger, transparency is ensured, fraud reduction is enhanced, and settlements are faster. For example, blockchain-based platforms, such as PayStand, simplify invoice processing for easy cross-border transactions that come with more safety and better efficiency. Blockchain's feature of immutable transaction history protects businesses from keeping wrong account records while reducing administrative difficulties, thus making it acceptable in the AR ecosystem.
Embedded finance is revolutionizing AR processes by embedding payment services directly into enterprise platforms. Companies automate billing, payment reconciliation, and credit approvals within their systems, thereby improving the customer experience and reducing the cycles of payment. Providers like Stripe and Square offer APIs that allow the embedding of payment functions into ERP tools, allowing for seamless, automated AR management. This trend makes cash management easier, thus helping businesses focus on growth and reducing time-to-cash delays, thus boosting the accounts receivable automation market revenue.
Cloud-based AR automation platforms are becoming a necessity as they are scalable, flexible, and accessible remotely. Cloud-native solutions such as QuickBooks and Xero allow businesses to manage invoices, payments, and reconciliations from anywhere. They provide real-time collaboration, secure data storage, and automatic updates, thereby reducing IT costs. With remote work and digital transformation, cloud-native platforms are offering enterprises operational efficiency and cost savings, which in turn fuels market growth and encourages wider adoption.
The growing e-commerce sector has created demand for accounts receivable (AR) automation as businesses process more online transactions. Automated systems provide efficient invoice processing, tracking of payments, and real-time reconciliation, reducing errors and accelerating cash flow. This trend supports seamless order-to-cash processes, which are essential for the growth of e-commerce, thus supporting the trends in the accounts receivable automation market.
Technological advancements in AI, ML, and cloud computing further propel the adoption of AR automation. AI systems provide predictive payment analytics, automated credit scoring, and intelligent invoice matching, eliminating the possibility of human errors and tedious work. Scalability, real-time data, and multiple device compatibility from cloud-based platforms enable businesses to function seamlessly. All of these factors combine to transform the AR processes, allowing organizations to manage higher volumes of transactions, customer experience, and financial transparency within a competitive digital marketplace.
The emergence of FinTech platforms opens up opportunities for AR automation providers to integrate payment gateways, lending services, and invoice financing solutions. For instance, Billtrust's partnership with Visa streamlines B2B payments through automated invoice management, boosting payment efficiency and reducing delays, thus bolstering the accounts receivable automation market opportunities.
Small and medium-sized enterprises are increasingly embracing AR automation to cut operational costs and improve cash flow management. SaaS platforms such as QuickBooks and FreshBooks offer affordable, scalable solutions that enable small businesses to automate invoicing, payment tracking, and reconciliation without requiring large upfront investments.
Globalization has necessitated the need for automatic international payment processing. Automated compliance checks and real-time currency conversion features help companies expand globally while ensuring regulatory adherence and operational transparency. The AR automation platforms such as PayStand and Tipalti support multi-currency payments, reducing complexities associated with cross-border transactions.
Read more about this report - REQUEST FREE SAMPLE COPY IN PDF
“Accounts Receivable Automation Market Report and Forecast 2026-2035” offers a detailed analysis of the market based on the following segments:
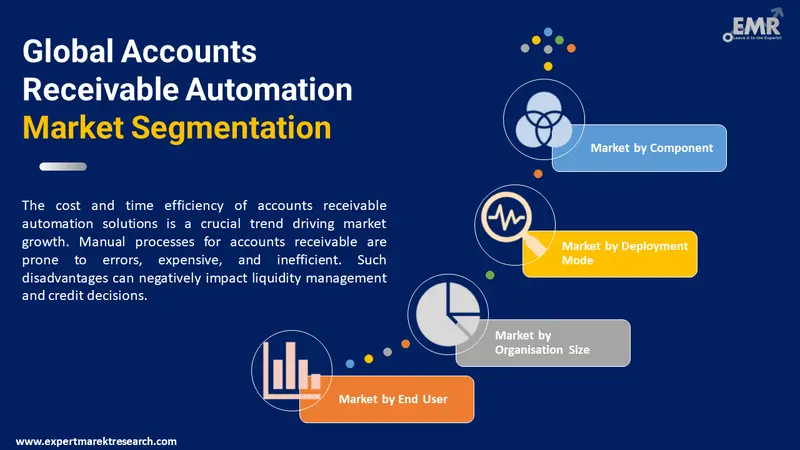
On the basis of component, the market can be divided into the following:
On the basis of deployment mode, the market can be divided into the following:
On the basis of organisation size, the market can be divided into the following:
On the basis of end user, the market can be divided into the following:
Based on region, the market can be segregated into:
By Component Analysis
In the global accounts receivable automation industry, solutions are emerging as in high demand by organisations to improve efficiency in processing invoices, reducing inaccuracies in transactional processes, and ensuring efficient cash flow governance. With AI and machine learning-based solutions, improvements in accuracy and speed are what can be expected by the market players to process numerous transactions. The service component will also grow in demand, as organisations are increasingly seeking day-in and day-out support, integration, and consultancy to ensure they implement smoothly, maximise their performance, and keep up with the evolution of technologies.
Market Analysis by Deployment Mode
According to the global accounts receivable automation market analysis, companies have been increasingly favouring cloud-based deployment over on-premise solutions. Cloud-based solutions generally require a lower upfront investment compared to on-premise systems. Cloud solutions offer more robust data recovery and business continuity options. Data is stored off-site and can be backed up regularly, reducing the risk of data loss due to local hardware failures or disasters.
Despite these advantages, some larger enterprises and organisations in highly regulated industries (like finance or healthcare) may still prefer on-premise solutions due to their specific requirements for control, security, and compliance.
Analysis by Organisation Size
SMEs are increasingly adopting AR automation services. The key reasons include the need for efficiency, cost savings, and the ability to compete with larger companies. SMEs are more inclined towards cloud-based AR automation solutions due to lower upfront costs, scalability, and ease of implementation.
As per accounts receivable automation industry analysis, large enterprises typically have more complex financial systems and therefore require AR automation solutions that can integrate seamlessly with their existing ERP and CRM systems. These organisations often need more customisable solutions to fit their unique processes and compliance requirements.
Market Insights by End User
The demand for accounts receivable automation will go up among all forms of end-users. In BFSI, automation safeguards financial transactions and averts unhealthy cash management. IT and telecom are possible beneficiaries through fast billing and payment reconciliation. For manufacturing companies, automation facilitates proper invoicing with better cash cycles. In healthcare, there must be automation of complex billing processes along with accuracy. Retail and Consumer Goods industries streamline the customer invoice and payment collection process, whereas Transportation and Logistics industries optimise billing processes, which contribute to lowering administrative costs.
North America Accounts Receivable Automation Market Opportunities
The North America accounts receivable automation industry is experiencing significant opportunities driven by the increasing adoption of digital finance solutions. Companies like HighRadius and Yooz are leading the charge by offering AI-powered platforms that streamline invoice processing and payment reconciliation. As e-commerce and digital transactions grow, the demand for efficient and scalable automation solutions is rising. Additionally, cloud-based services are boosting operational efficiency and collaboration, further driving market growth in industries like BFSI, retail, and healthcare.
Europe Accounts Receivable Automation Market Dynamics
The Europe accounts receivable automation market share is being driven by the region's focus on digital transformation and financial efficiency. According to the European Central Bank, the adoption of automated financial systems is crucial for improving cash flow management and reducing operational costs. As businesses across sectors like BFSI, retail, and manufacturing seek to enhance financial processes, automation technologies, including AI and machine learning, are gaining traction. The increasing regulatory focus on digital finance also supports market growth in Europe.
Asia Pacific Accounts Receivable Automation Market Trends
The Asia Pacific accounts receivable automation market is experiencing robust growth, driven by government initiatives supporting digitalization. For example, the Indian government’s "Digital India" campaign promotes the adoption of technology across industries, including financial services, improving the adoption of automated solutions in accounts receivable. Similarly, China’s emphasis on financial sector modernization and the integration of AI technologies has fostered increased demand for automation. According to the Asia Development Bank, automation enhances efficiency in managing cross-border transactions, further boosting market expansion.
Latin America Accounts Receivable Automation Market Insights
In Latin America, the accounts receivable automation market is growing rapidly due to increasing digital transformation across industries. Companies in Brazil and Mexico are adopting automated solutions to streamline financial processes, reduce operational costs, and improve cash flow management. The rise of e-commerce and the push for better regulatory compliance are further driving demand for automation in the region. According to market reports, automation is helping businesses in Latin America manage large transaction volumes, enhance customer experience, and improve liquidity management.
Middle East and Africa Accounts Receivable Automation Market Drivers
In the Middle East and Africa, the demand for accounts receivable automation is driven by the region’s growing adoption of digital transformation. Government initiatives, such as Saudi Arabia's Vision 2030, aim to modernise financial systems and promote automation across industries. The UAE's push towards a cashless economy also fuels the need for efficient invoice processing. As businesses expand, especially in sectors like BFSI, retail, and healthcare, automation solutions are becoming essential to enhance cash flow, reduce manual errors, and improve efficiency.
Cloud-based solutions enable accounts receivable automation market players to scale up easily and integrate various types of businesses and industries. Accounts receivable automation companies can improve accuracy, speed, and efficiency with advanced technology such as AI and machine learning. In addition, offering customizable, modular solutions that match the diversity of needs across various industries, with a robust customer support system and analytics, can help businesses scale their operations efficiently and cost-effectively.
SAP SE, established in 1972, headquartered in Walldorf, Germany, is a multinational specialising in enterprise software for business operations and customer relationship management, known for its ERP solutions.
Oracle Corporation, an American tech giant, established in 1977, renowned for database software, cloud solutions, and enterprise software products, with a strong focus on database management systems.
Kofax, Inc, established in 1985, headquartered in Irvine, California, USA, is a leading provider of intelligent automation software for digital workflow transformation, specialising in document management, robotic process automation, and cognitive capture.
Quadient (Yaypay, Inc), founded in 1924 (as Neopost, rebranded in 2019), headquartered in Bagneux, France, with Yaypay based in New York, United States, is an international company offering digital communication, shipping, and billing solutions, with Yaypay focusing on AI-driven accounts receivable automation.
*Please note that this is only a partial list; the complete list of key players is available in the full report. Additionally, the list of key players can be customized to better suit your needs.*
Other key players in the global accounts receivable automation market are SK Global Software, Corcentric, LLC, HighRadius Corporation, Qvalia Group AB, MHC Software Holdings, Inc, and Bill.com, LLC, among others.
Startups in the accounts receivable automation market are focused on cost-effective, user-friendly solutions for small and medium-sized enterprises. They will automate the process of invoicing and cash flow management by utilizing cloud-based platforms and AI-powered tools to minimize manual intervention. Companies are developing customized AR automation systems that will help companies adapt these solutions into their existing workflows to increase efficiency and accuracy.
HighRadius
HighRadius is an AI-driven AR automation startup. It streamlines the order-to-cash process by automating invoicing, collections, and payments. This platform offers enhanced cash flow management and improved operational efficiency.
Zoho
Zoho provides a range of AR automation solutions for SMEs. Its solutions include cheap, cloud-based invoicing, payment tracking, and reconciliation tools. Zoho designed its software to help optimize business financial processes.
Upto 15% Off
USD
$2499 $2249
$3999 $3599
$4999 $4249
$5999 $5099


*While we strive to always give you current and accurate information, the numbers depicted on the website are indicative and may differ from the actual numbers in the main report. At Expert Market Research, we aim to bring you the latest insights and trends in the market. Using our analyses and forecasts, stakeholders can understand the market dynamics, navigate challenges, and capitalize on opportunities to make data-driven strategic decisions.*
In 2025, the market reached an approximate value of USD 4.73 Billion.
The accounts receivable automation market is assessed to grow at a CAGR of 13.90% between 2026 and 2035.
The market is estimated to witness healthy growth in the forecast period of 2026-2035 to reach a value of around USD 17.38 Billion by 2035.
The major market drivers include optimisation of invoice processing and increasing adoption of accounts receivable automation so as to simplify bill management.
The key trends fuelling the growth of the market include increased focus on reduction DSO, cost and time efficient nature of accounts receivable automation, and rising demand for cloud-based accounts receivable automation.
The major regions in the market are North America, Europe, the Asia Pacific, Latin America, and the Middle East and Africa.
The various end users in the market include BFSI, IT and telecom, manufacturing, healthcare, retail and consumer goods, and transportation and logistics, among others.
The accounts receivable automation ensures enhanced efficiency and security along with improved management oversight.
The significant components in the market include solutions and services.
The key players in the global accounts receivable automation market are SAP SE, Oracle Corporation, Kofax, Inc, Quadient (Yaypay, Inc), SK Global Software, Corcentric, LLC, HighRadius Corporation, Qvalia Group AB, MHC Software Holdings, Inc, and Bill.com, LLC, among others.
Explore our key highlights of the report and gain a concise overview of key findings, trends, and actionable insights that will empower your strategic decisions.
| REPORT FEATURES | DETAILS |
| Base Year | 2025 |
| Historical Period | 2019-2025 |
| Forecast Period | 2026-2035 |
| Scope of the Report |
Historical and Forecast Trends, Industry Drivers and Constraints, Historical and Forecast Market Analysis by Segment:
|
| Breakup by Component |
|
| Breakup by Deployment Mode |
|
| Breakup by Organisation Size |
|
| Breakup by End User |
|
| Breakup by Region |
|
| Market Dynamics |
|
| Competitive Landscape |
|
| Companies Covered |
|
Datasheet
One User
USD 2,499
USD 2,249
tax inclusive*
Single User License
One User
USD 3,999
USD 3,599
tax inclusive*
Five User License
Five User
USD 4,999
USD 4,249
tax inclusive*
Corporate License
Unlimited Users
USD 5,999
USD 5,099
tax inclusive*
*Please note that the prices mentioned below are starting prices for each bundle type. Kindly contact our team for further details.*
Flash Bundle
Small Business Bundle
Growth Bundle
Enterprise Bundle
*Please note that the prices mentioned below are starting prices for each bundle type. Kindly contact our team for further details.*
Flash Bundle
Number of Reports: 3
20%
tax inclusive*
Small Business Bundle
Number of Reports: 5
25%
tax inclusive*
Growth Bundle
Number of Reports: 8
30%
tax inclusive*
Enterprise Bundle
Number of Reports: 10
35%
tax inclusive*
How To Order

Select License Type
Choose the right license for your needs and access rights.

Click on ‘Buy Now’
Add the report to your cart with one click and proceed to register.

Select Mode of Payment
Choose a payment option for a secure checkout. You will be redirected accordingly.
Strategic Solutions for Informed Decision-Making
Gain insights to stay ahead and seize opportunities.

Get insights & trends for a competitive edge.

Track prices with detailed trend reports.

Analyse trade data for supply chain insights.

Leverage cost reports for smart savings

Enhance supply chain with partnerships.

Connect For More Information
Our expert team of analysts will offer full support and resolve any queries regarding the report, before and after the purchase.
Our expert team of analysts will offer full support and resolve any queries regarding the report, before and after the purchase.
We employ meticulous research methods, blending advanced analytics and expert insights to deliver accurate, actionable industry intelligence, staying ahead of competitors.
Our skilled analysts offer unparalleled competitive advantage with detailed insights on current and emerging markets, ensuring your strategic edge.
We offer an in-depth yet simplified presentation of industry insights and analysis to meet your specific requirements effectively.


