

Consumer Insights
Uncover trends and behaviors shaping consumer choices today
Procurement Insights
Optimize your sourcing strategy with key market data
Industry Stats
Stay ahead with the latest trends and market analysis.
The global active pharmaceutical ingredients (API) market was valued at USD 183.69 Billion in 2025, driven by the rising proliferation of chronic conditions resulting in a rise in demand for drugs across the globe. The market is anticipated to grow at a CAGR of 7.80% during the forecast period of 2026-2035 to achieve a value of USD 389.29 Billion by 2035.
The rising prevalence of chronic diseases and increasing demand for personalised medicines are driving innovation and expanding the market.
Technological advancements in active pharmaceutical ingredient production, such as green chemistry and continuous manufacturing, are improving efficiency and enhancing the market growth globally.
Growing regulatory support for generic drug manufacturing and increasing outsourcing of active pharmaceutical ingredients to cost-effective regions are significantly boosting market development.
Compound Annual Growth Rate
7.8%
Value in USD Billion
2026-2035
Active Pharmaceutical Ingredients (APIs) are the biologically active components in pharmaceutical drugs responsible for their therapeutic effects. They are meticulously manufactured through chemical synthesis, fermentation, or biotechnology and play a crucial role in treating specific medical conditions. APIs are combined with excipients (inactive substances) to create the final drug formulation. Stringent regulatory standards govern their production to ensure quality, safety, and efficacy. APIs are classified into synthetic and biological, with the latter gaining prominence due to advancements in biotechnology. They are integral to the pharmaceutical industry, addressing diverse therapeutic needs and driving innovations in modern medicine.
Diversification of Pharmaceutical Supply Chain Driving the Market
Growing investments in enhancing manufacturing capabilities and improving supply chain resilience are significant drivers of the market. For instance, In May 2024, the United States Agency for International Development (USAID) launched a project aimed at diversifying Asia’s pharmaceutical supply chain by providing USD 5 million to improve the production, regulation, and export of APIs in Uzbekistan and Kazakhstan. The initiative will strengthen critical sectors such as manufacturing, governance, regulatory systems, and workforce development. By boosting local production and reducing reliance on imports, this project is set to enhance competitiveness in Central Asia, improve supply chain stability, and reduce disruptions, thereby supporting growth in the API market over the forecast period.
Domestic Pharmaceutical Supply Chain Enhancement to Drive Active Pharmaceutical Ingredients (API) Market Demand
The growing need for robust domestic pharmaceutical supply chains and quality assurance drives the expansion of the market. For instance, in March 2024, Noramco announced the creation of Noramco Group, which integrates its subsidiaries Halo Pharma and Purisys. This strategic move aims to address drug shortages and quality concerns in the United States by enhancing supply chain reliability and boosting domestic production. With the current challenges of unreliable foreign supply and insufficient local manufacturing capacity, this initiative is set to strengthen the US pharmaceutical sector. The integration of these companies is expected to improve supply chain performance, reduce costs, and ensure greater market stability, positioning the API market for significant growth in the forecast period.
The market is witnessing several trends and developments to improve the current scenario. Some of the notable trends are as follows:
The rising focus on stringent regulatory standards and government initiatives supporting local API manufacturing are pivotal market drivers. Recent policy changes in major markets aim to reduce reliance on imports and encourage domestic production of active pharmaceutical ingredients. These regulatory shifts are expected to enhance supply chain resilience and stimulate investment in modern manufacturing facilities. As a result, the market is poised for substantial growth, particularly in regions investing heavily in building self-sufficient pharmaceutical supply chains to ensure the uninterrupted availability of critical medications.
The increasing prevalence of chronic diseases and the demand for personalised medicine are major drivers in the market. Emerging technologies, such as biocatalysis and flow chemistry, are transforming the production of active pharmaceutical ingredients, enabling cost-effective and efficient manufacturing processes. These advancements enhance the quality and scalability of the production of active pharmaceutical ingredients while meeting regulatory requirements. In the forecast period, these innovations are likely to foster greater adoption of advanced active pharmaceutical ingredients across diverse therapeutic areas, thereby driving market development and addressing the growing demand for innovative treatments.
Growing investments by pharmaceutical companies in active pharmaceutical ingredient development, supported by increased funding for drug discovery, are significant market drivers. Companies are expanding their manufacturing capacities and adopting advanced techniques to cater to the rising demand for high-quality APIs. This trend reflects the growing emphasis on innovation and competitive pricing. The anticipated impact on the market includes enhanced API value, driven by high demand for advanced therapeutic applications, ultimately boosting revenue and creating new opportunities across the global pharmaceutical landscape.
The surging demand for biologics, driven by advancements in biotechnology and the rise of targeted therapies, is transforming the market. Biologic active pharmaceutical ingredients (APIs), including monoclonal antibodies and vaccines, are gaining prominence due to their efficacy and specificity in treating complex conditions. This shift has led to increased investments in R&D and production facilities tailored to biologic APIs. The market is expected to witness significant growth as biologics dominate the therapeutic pipeline, offering lucrative opportunities for manufacturers and contributing to improved healthcare outcomes globally.
"Active Pharmaceutical Ingredients (API) Market Report and Forecast 2026-2035” offers a detailed analysis of the market based on the following segments:
Market Breakup by Molecule
Market Breakup by Type
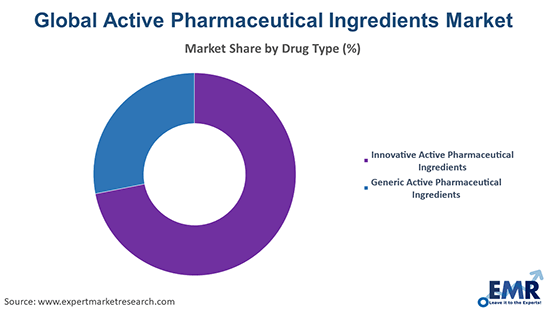
Market Breakup by Type of Drug
Market Breakup by Therapeutic Application
Market Breakup by End User
Market Breakup by Region
Read more about this report - REQUEST FREE SAMPLE COPY IN PDF
Small Molecule APIs to Lead the Segmentation by Molecule
Small molecule APIs are likely to dominate the market due to their widespread use in treating chronic and infectious diseases. As per the analysis by Expert Market Research, the global small molecule API market is anticipated to grow at a CAGR of 6.8% during the forecast period of 2025-2034. Their high oral bioavailability, cost-effectiveness, and compatibility with various drug formulations make them a preferred choice. Increasing demand for generic drugs and advancements in chemical synthesis techniques are key drivers for their growth. In the forecast period, the small molecule segment is poised to sustain its leadership, supported by rising investments in drug discovery and expanding therapeutic applications, ensuring its pivotal role in driving market growth.
Active Pharmaceutical Ingredients (API) Market Segmentation by Type to Witness Growth
Generic APIs are poised to hold the largest market share due to their affordability and high demand in emerging economies. The expiration of patents for major drugs and governmental initiatives promoting generic medicines significantly contribute to their growth. Manufacturers increasingly focus on scaling up production to meet the global demand for cost-effective treatments. This segment is expected to drive market growth as healthcare providers prioritise affordability and accessibility, ensuring continued expansion in both developed and developing regions during the forecast period.
Prescription Drugs Driving the Market Segment by Type of Drug
Prescription drugs will likely lead the market due to their crucial role in managing complex and chronic conditions. The increasing prevalence of lifestyle-related diseases and rising healthcare expenditure are significant drivers. Advancements in targeted drug delivery and personalised medicine further enhance the importance of prescription APIs. During the forecast period, this segment is poised to grow steadily as demand for high-quality treatments rises, supported by ongoing innovations and the growing adoption of advanced therapeutic solutions globally.
Oncology to Leading the Active Pharmaceutical Ingredients (API) Market by Therapeutic Application
Oncology is likely to reserve the largest share in the market due to the growing global incidence of cancer. Innovations in targeted therapies and biologic drugs, along with increasing research funding, are driving demand. As per the analysis by Expert Market Research, the oncology drugs market is expected to grow at a CAGR of 13.2% during the forecast period of 2025-2034. Governments and pharmaceutical companies are heavily investing in cancer treatment solutions to address unmet needs. This segment is expected to experience substantial growth as advancements in precision medicine and immunotherapies continue to expand therapeutic possibilities, positioning oncology APIs as a critical driver of the market during the forecast period.
Pharmaceutical and Biotechnology Industry Dominating the Segment by End User
The pharmaceutical and biotechnology industry is poised to lead the market as the primary consumer of high-quality APIs. Growing R&D investments, particularly in biologics and specialty drugs, are significant market drivers. Increasing collaborations and partnerships between pharma companies and research organisations further accelerate API adoption. This segment is expected to grow robustly during the forecast period, driven by rising demand for innovative drug formulations, regulatory compliance needs, and expansion of manufacturing capabilities, solidifying its dominance in the market.


The Asia Pacific region is poised to dominate the market due to its well-established manufacturing infrastructure, cost-efficient production capabilities, and robust talent pool. Countries like India and China lead with strong raw material availability, favourable policies, and significant export activities. North America is likely to hold a substantial market share driven by advanced R&D capabilities, stringent regulatory standards, and increasing demand for high-value APIs. Europe is a key player, leveraging its pharmaceutical innovations and high-quality standards. Latin America is emerging with growing local production and regional partnerships, while the Middle East and Africa demonstrate gradual growth with rising healthcare investments and increased focus on generics. Collectively, each region contributes distinctively to the global API landscape.
The key features of the market report comprise patent analysis, clinical trials analysis, funding and investment analysis, and strategic initiatives by the leading players. The major companies in the market are as follows:
Headquartered in Basel, Switzerland, Novartis AG was established in 1996 following the merger of Ciba-Geigy and Sandoz. A global leader in the pharmaceutical sector, Novartis specialises in innovative medicines, generics, and biosimilars. The company’s active pharmaceutical ingredient (API) portfolio includes small molecules, biologics, and advanced therapies addressing critical diseases such as cancer, cardiovascular conditions, and immunological disorders. Novartis leverages cutting-edge technologies and a strong research network to meet global API market demands while maintaining a focus on sustainability and healthcare accessibility.
Founded in 1863 and headquartered in Leverkusen, Germany, Bayer AG is a global leader in pharmaceuticals, consumer health, and agriculture. In the API market, Bayer is recognised for its innovative ingredients used in treatments targeting cardiovascular diseases, oncology, and women’s health. For instance, In March 2024, Bayer showcased its transformation at Pharma Media Day 2024, highlighting its strengthened innovation engine and focus on four core therapeutic areas: cardiovascular diseases, oncology, immunology, and neurology & rare diseases. With the advancement of its pipeline, including eight Investigational New Drug (IND) applications in 2023, Bayer continues to support advancements in healthcare, delivering high-quality, sustainable APIs to global markets.
Established in 1977 and headquartered in Mumbai, India, Glenmark Pharmaceuticals Ltd. is a global pharmaceutical company specialising in innovative and generic drugs. Its API portfolio covers diverse therapeutic areas, including dermatology, oncology, and respiratory disorders. The company focuses on developing complex molecules and leveraging advanced manufacturing technologies to maintain high-quality standards. With a strong presence in over 80 countries, Glenmark continues to contribute significantly to the API market through its robust research capabilities and commitment to addressing unmet medical needs.
GlaxoSmithKline plc (GSK), headquartered in Brentford, England, was founded in 2000 following a merger between Glaxo Wellcome and SmithKline Beecham. A leader in the global API market, GSK’s portfolio encompasses vaccines, biologics, and small-molecule APIs addressing infectious diseases, oncology, and respiratory conditions. With a focus on research and development, the company consistently delivers innovative, high-quality pharmaceutical solutions. GSK’s commitment to improving global health, coupled with its strong manufacturing capabilities, reinforces its pivotal role in addressing worldwide healthcare challenges.
*Please note that this is only a partial list; the complete list of key players is available in the full report. Additionally, the list of key players can be customized to better suit your needs.*
Other key players in the market include Merck KGaA, Aurobindo Pharma, AstraZeneca Plc, Elam Pharma Pvt. Ltd., Teva Pharmaceutical Industries Ltd., and Sanofi SA.
Upto 15% Off
USD
$5499 $4949
$3299 $2969
$6999 $5949
$8199 $6969


*While we strive to always give you current and accurate information, the numbers depicted on the website are indicative and may differ from the actual numbers in the main report. At Expert Market Research, we aim to bring you the latest insights and trends in the market. Using our analyses and forecasts, stakeholders can understand the market dynamics, navigate challenges, and capitalize on opportunities to make data-driven strategic decisions.*
Explore our key highlights of the report and gain a concise overview of key findings, trends, and actionable insights that will empower your strategic decisions.
| REPORT FEATURES | DETAILS |
| Base Year | 2025 |
| Historical Period | 2019-2025 |
| Forecast Period | 2026-2035 |
| Scope of the Report |
Historical and Forecast Trends, Industry Drivers and Constraints, Historical and Forecast Market Analysis by Segment:
|
| Breakup by Molecule |
|
| Breakup by Type |
|
| Breakup by Type of Drug |
|
| Breakup by Therapeutic Application |
|
| Breakup by End User |
|
| Breakup by Region |
|
| Market Dynamics |
|
| Supplier Landscape |
|
| Companies Covered |
|
Single User License
One User
USD 5,499
USD 4,949
tax inclusive*
Datasheet
One User
USD 3,299
USD 2,969
tax inclusive*
Five User License
Five User
USD 6,999
USD 5,949
tax inclusive*
Corporate License
Unlimited Users
USD 8,199
USD 6,969
tax inclusive*
*Please note that the prices mentioned below are starting prices for each bundle type. Kindly contact our team for further details.*
Flash Bundle
Small Business Bundle
Growth Bundle
Enterprise Bundle
*Please note that the prices mentioned below are starting prices for each bundle type. Kindly contact our team for further details.*
Flash Bundle
Number of Reports: 3
20%
tax inclusive*
Small Business Bundle
Number of Reports: 5
25%
tax inclusive*
Growth Bundle
Number of Reports: 8
30%
tax inclusive*
Enterprise Bundle
Number of Reports: 10
35%
tax inclusive*
How To Order

Select License Type
Choose the right license for your needs and access rights.

Click on ‘Buy Now’
Add the report to your cart with one click and proceed to register.

Select Mode of Payment
Choose a payment option for a secure checkout. You will be redirected accordingly.
Strategic Solutions for Informed Decision-Making
Gain insights to stay ahead and seize opportunities.

Get insights & trends for a competitive edge.

Track prices with detailed trend reports.

Analyse trade data for supply chain insights.

Leverage cost reports for smart savings

Enhance supply chain with partnerships.

Connect For More Information
Our expert team of analysts will offer full support and resolve any queries regarding the report, before and after the purchase.
Our expert team of analysts will offer full support and resolve any queries regarding the report, before and after the purchase.
We employ meticulous research methods, blending advanced analytics and expert insights to deliver accurate, actionable industry intelligence, staying ahead of competitors.
Our skilled analysts offer unparalleled competitive advantage with detailed insights on current and emerging markets, ensuring your strategic edge.
We offer an in-depth yet simplified presentation of industry insights and analysis to meet your specific requirements effectively.


