Sale

Africa Electric Bus Market

Africa Electric Bus Market Size, Share, Trends, Demand, Growth, Forecast: By Propulsion Type: Battery Electric Vehicle, Plug-in Hybrid Electric Vehicle, Fuel Cell Electric Vehicle; By Battery Type; By Battery Capacity; By Bus Length; By Range; By Power Output; By Application; By End Use; Regional Analysis; Competitive Landscape; 2024-2032

Africa Electric Bus Market Outlook

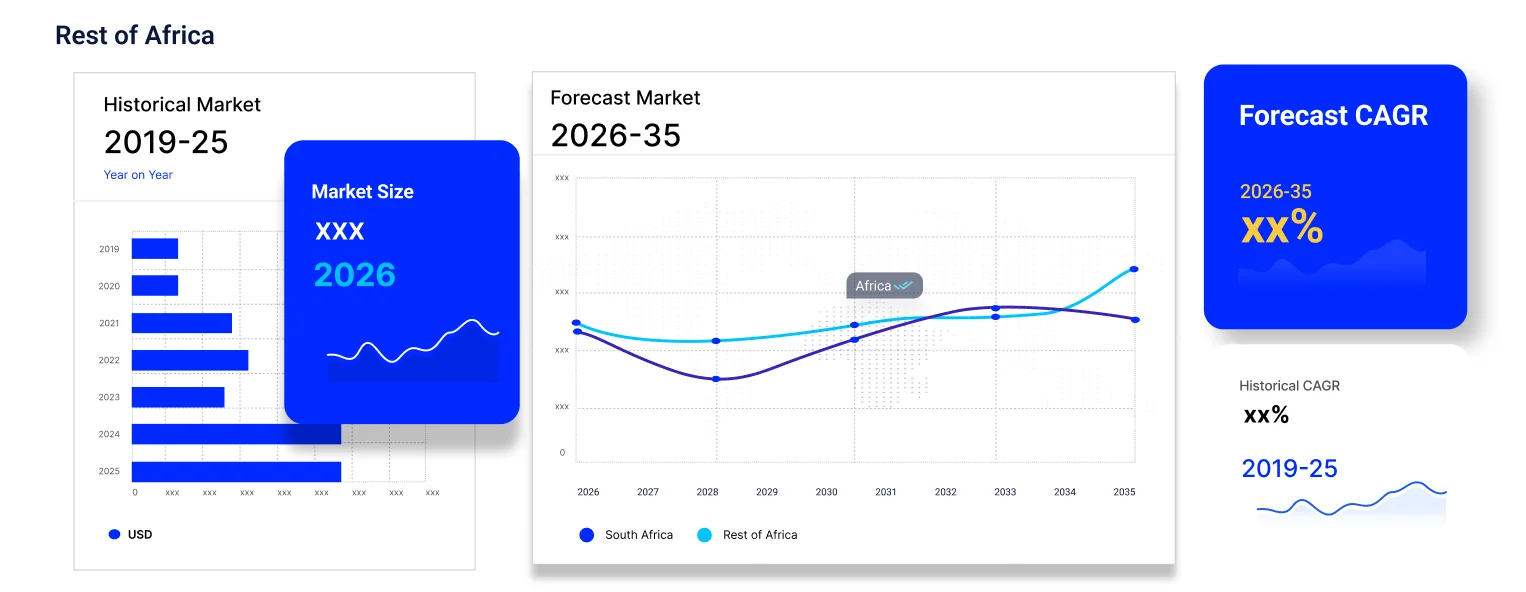
The Africa electric bus market size reached approximately USD 1.60 billion in 2023. The market is further projected to grow at a CAGR of 14.1% between 2024 and 2032, reaching a value of USD 5.24 billion by 2032.


Key Trends in the Market

An electric bus is a vehicle whose accessory and propulsion systems are powered by zero emission electricity sources. The fuel tank and the internal combustion engine are replaced with battery and an electric motor in electric buses. The electricity can be sourced from hydrogen fuel cells, batteries, and ground based non-contact conductors, among others.


  • Increased environmental awareness is a key trend aiding the Africa electric bus market growth. The exhaust fumes released by diesel buses are unpleasant to breath and are a health hazard. Electric buses have no tailpipe emissions and are helpful towards providing cleaner air.
  • The community and social benefits offered by electric buses are further boosting their adoption in Africa. A sustainable and efficient mode of public transportation reduces noise pollution and improves the quality of the air, enhancing the living conditions of the city.
  • The economic benefits offered by electric buses are encouraging the African governments to adopt the vehicle. Electric buses have fewer components, lower fuel costs, longer life cycle, and require less maintenance, making them more economically viable than their fuel consuming counterparts.


Africa Electric Bus Market Analysis

On the basis of propulsion type, the market is divided into battery electric vehicle, plug-in hybrid electric vehicle, and fuel cell electric vehicle. Based on battery type, the market is categorised into lithium nickel manganese cobalt oxide and lithium iron phosphate. On the basis of battery capacity, the market is bifurcated into up to 400 kWh and above 400 kWh.


Based on bus length, the market is classified into less than 9 meters, 9 to 14 meters, and above 14 meters. On the basis of range, the market is segregated into less than 150 miles, 150 to 300 miles, and above 300 miles. Based on power output, the market is divided into up to 250 kW and above 250 kW.


On the basis of application, the market is bifurcated into intercity and intracity. Based on end use, the market is categorised into public and private. On the basis of country, the Africa electric bus market segmentation includes South Africa, Egypt, Nigeria, and Algeria, among others.


The comprehensive EMR report provides an in-depth assessment of the market based on the Porter's five forces model along with giving a SWOT analysis. The report gives a detailed analysis of the following key players in the market, covering their competitive landscape and latest developments like mergers, acquisitions, investments, and expansion plans.


  • Mercedes-Benz Group AG 
  • Kiira Motors Corporation
  • BYD Motors, Inc. 
  • MiPower Electric Bus (Masala Ramabulana Holdings) 
  • Yutong Bus Co., Ltd. 
  • Xiamen King Long International Trading Co.,Ltd. 
  • Volvo Group 
  • Tata Sons Private Limited
  • Roam
  • BasiGo 
  • Others


Market Share by Propulsion Type

Battery electric vehicles are anticipated to account for a significant Africa electric bus market share owing to the various advantages offered by the vehicles as opposed to plug-in hybrid electric vehicles and fuel cell electric vehicles. Battery electric buses produce zero tailpipe emission and are also aiding the governments in Africa in reducing operational costs for public transports. Presence of various key market players and their increased efforts towards the development of battery electric buses is further supporting the segment growth.


Market Share by Country

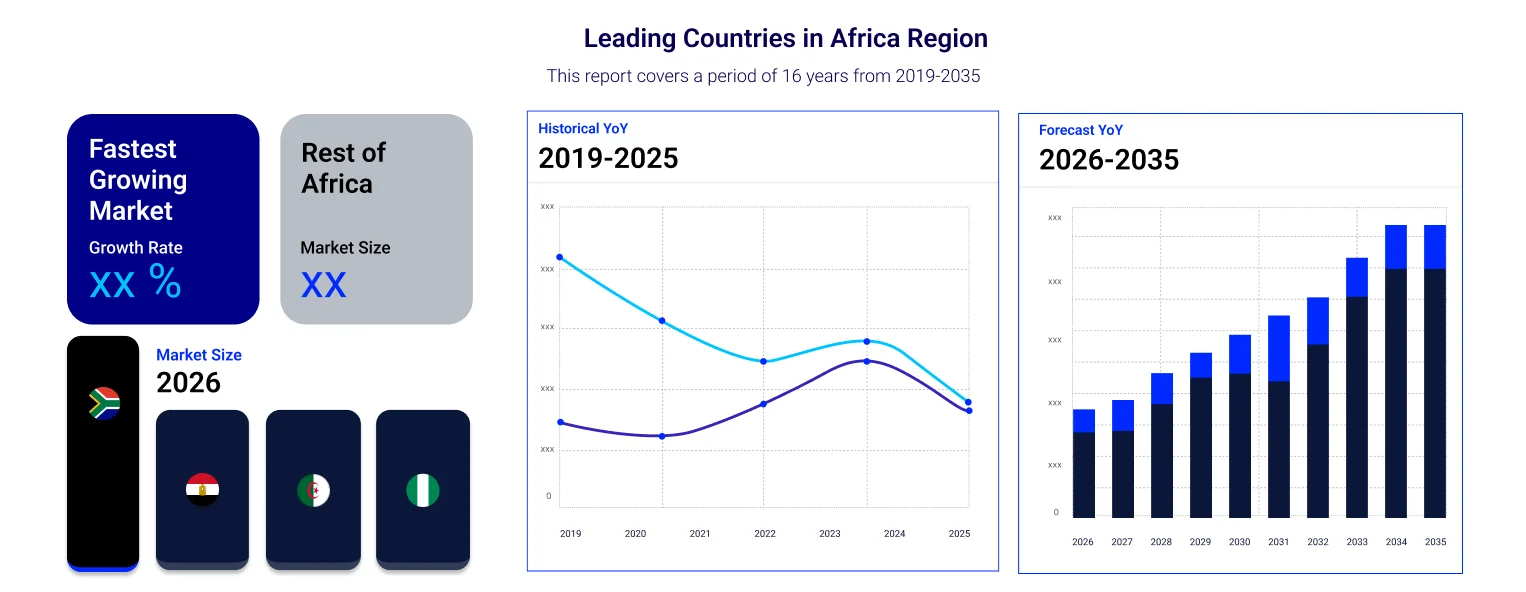
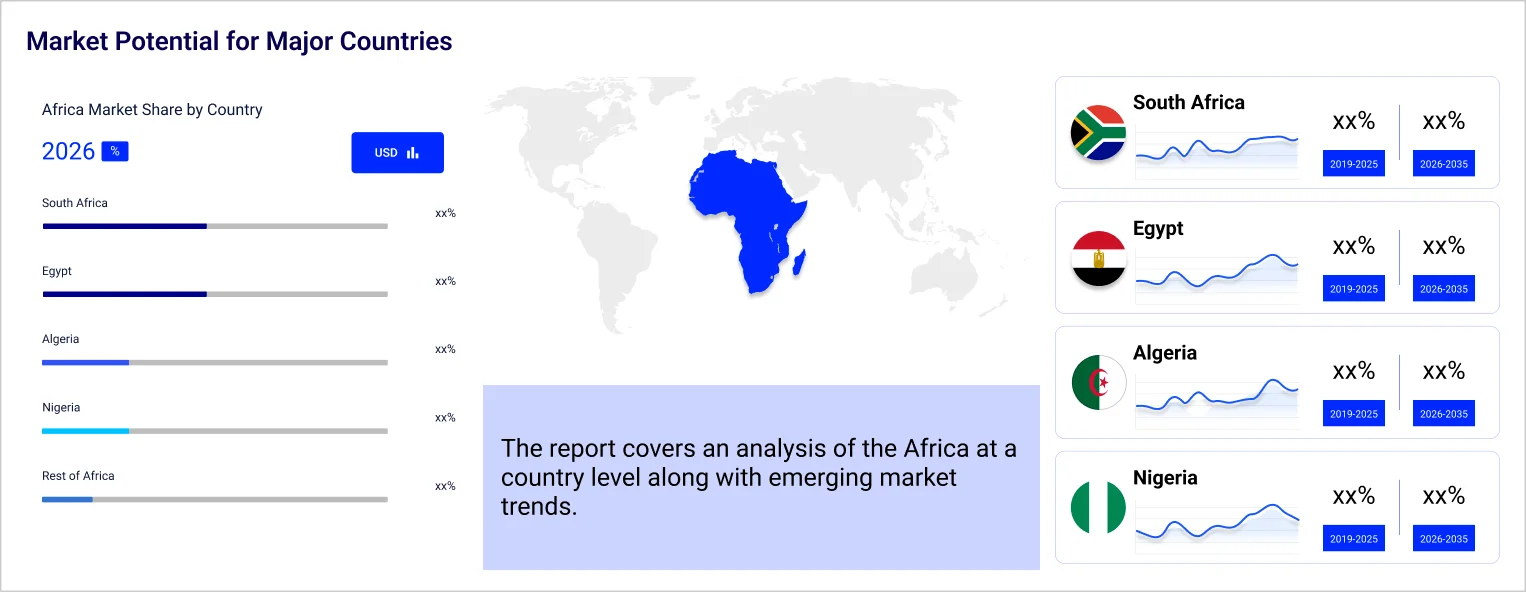
South Africa is expected to account for significant share of the electric bus market in Africa in the coming years. This growth can be attributed to the increased governmental efforts towards boosting connectivity within the country in a cost efficient and environment friendly manner. Electric buses help in lowering the operational costs for public transportation systems and assist in creating local jobs. Such buses have maximum torque which enables the driver to accelerate more responsively. These advantages are boosting the Africa electric bus market demand.


Competitive Landscape

Mercedes-Benz Group AG is an automobile company that delevops and distributes luxury and premium vans and cars and electric vehicles including buses. The company also offers a wide range of services such as fleet management, car subscription, and car rental.


Volvo Group, headquarterd in Sweden, is one of the leading manufacturers of buses, marine and construction equipment, industrial engines, and trucks. The company’s brand portfolio consists of Prevost, Volvo Penta, Nova Bus, and Renault Trucks, among others.


Tata Sons Private Limited, headquarterd in Mumbai, Mahrashtra, encompasses various primary business sectors including engineering, materials, energy, chemicals, and consumer products, among others.


Other Africa electric bus market key players include Kiira Motors Corporation, BYD Motors, Inc., MiPower Electric Bus (Masala Ramabulana Holdings), Yutong Bus Co., Ltd., Xiamen King Long International Trading Co.,Ltd., Roam, and BasiGo, among others.


Key Highlights of the Report

REPORT FEATURES DETAILS
Base Year 2023
Historical Period 2018-2023
Forecast Period 2024-2032
Scope of the Report

Historical and Forecast Trends, Industry Drivers and Constraints, Historical and Forecast Market Analysis by Segment:

  • Propulsion Type
  • Battery Type
  • Battery Capacity
  • Bus Length
  • Range
  • Power Output
  • Application
  • End Use
  • Region
Breakup by Propulsion Type
  • Battery Electric Vehicle
  • Plug-in Hybrid Electric Vehicle
  • Fuel Cell Electric Vehicle
Breakup by Battery Type
  • Lithium Nickel Manganese Cobalt Oxide
  • Lithium Iron Phosphate
Breakup by Battery Capacity
  • Up to 400 kWh
  • Above 400 kWh
Breakup by Bus Length
  • Less Than 9 meters
  • 9 To 14 meters
  • Above 14 meters
Breakup by Range
  • Less Than 150 Miles
  • 150 To 300 Miles
  • Above 300 Miles
Breakup by Power Output
  • Up to 250 kW
  • Above 250 kW
Breakup by Application
  • Intercity
  • Intracity
Breakup by End Use
  • Public
  • Private
Breakup by Region
  • South Africa
  • Egypt
  • Nigeria
  • Algeria
  • Others
Market Dynamics
  • SWOT Analysis
  • Porter's Five Forces Analysis
  • Key Indicators for Demand
  • Key Indicators for Price
Competitive Landscape
  • Market Structure
  • Company Profiles
    • Company Overview
    • Product Portfolio
    • Demographic Reach and Achievements
    • Certifications
Companies Covered
  • Mercedes-Benz Group AG 
  • Kiira Motors Corporation
  • BYD Motors, Inc. 
  • MiPower Electric Bus (Masala Ramabulana Holdings) 
  • Yutong Bus Co., Ltd. 
  • Xiamen King Long International Trading Co.,Ltd. 
  • Volvo Group 
  • Tata Sons Private Limited
  • Roam
  • BasiGo 
  • Others


*At Expert Market Research, we strive to always give you current and accurate information. The numbers depicted in the description are indicative and may differ from the actual numbers in the final EMR report.

1    Preface  
2    Report Coverage – Key Segmentation and Scope
3    Report Description

    3.1    Market Definition and Outlook
    3.2    Properties and Applications
    3.3    Market Analysis
    3.4    Key Players
4    Key Assumptions
5    Executive Summary

    5.1    Overview
    5.2    Key Drivers    
    5.3    Key Developments
    5.4    Competitive Structure
    5.5    Key Industrial Trends
6    Market Snapshot
7    Opportunities and Challenges in the Market
8    Global Electric Bus Market Overview

    8.1    Key Industry Highlights
    8.2    Global Electric Bus Historical Market (2018-2023) 
    8.3    Global Electric Bus Market Forecast (2024-2032)
    8.4    Global Electric Bus Market Share by Region
        8.4.1    North America
        8.4.2    Europe
        8.4.3    Asia Pacific
        8.4.4    Latin America
        8.4.5    Middle East and Africa
9    Africa Electric Bus Market Overview
    9.1    Key Industry Highlights
    9.2    Africa Electric Bus Historical Market (2018-2023) 
    9.3    Africa Electric Bus Market Forecast (2024-2032)
10    Africa Electric Bus Market by Propulsion Type
    10.1    Battery Electric Vehicle
        10.1.1    Historical Trend (2018-2023)
        10.1.2    Forecast Trend (2024-2032)
    10.2    Plug-in Hybrid Electric Vehicle
        10.2.1    Historical Trend (2018-2023)
        10.2.2    Forecast Trend (2024-2032)
    10.3    Fuel Cell Electric Vehicle
        10.3.1    Historical Trend (2018-2023)
        10.3.2    Forecast Trend (2024-2032)
11    Africa Electric Bus Market by Battery Type
    11.1    Lithium Nickel Manganese Cobalt Oxide
        11.1.1    Historical Trend (2018-2023)
        11.1.2    Forecast Trend (2024-2032)
    11.2    Lithium Iron Phosphate
        11.2.1    Historical Trend (2018-2023)
        11.2.2    Forecast Trend (2024-2032)
12    Africa Electric Bus Market by Battery Capacity
    12.1    Up to 400 kWh
        12.1.1    Historical Trend (2018-2023)
        12.1.2    Forecast Trend (2024-2032)
    12.2    Above 400 kWh
        12.2.1    Historical Trend (2018-2023)
        12.2.2    Forecast Trend (2024-2032)
13    Africa Electric Bus Market by Bus Length
    13.1    Less Than 9 meters
        13.1.1    Historical Trend (2018-2023)
        13.1.2    Forecast Trend (2024-2032)
    13.2    9 To 14 meters 
        13.2.1    Historical Trend (2018-2023)
        13.2.2    Forecast Trend (2024-2032)
    13.3    Above 14 meters
        13.3.1    Historical Trend (2018-2023)
        13.3.2    Forecast Trend (2024-2032)
14    Africa Electric Bus Market by Range
    14.1    Less Than 150 Miles
        14.1.1    Historical Trend (2018-2023)
        14.1.2    Forecast Trend (2024-2032)
    14.2    150 To 300 Miles
        14.2.1    Historical Trend (2018-2023)
        14.2.2    Forecast Trend (2024-2032)
    14.3    Above 300 Miles
        14.3.1    Historical Trend (2018-2023)
        14.3.2    Forecast Trend (2024-2032)
15    Africa Electric Bus Market by Power Output
    15.1    Up to 250 kW
        15.1.1    Historical Trend (2018-2023)
        15.1.2    Forecast Trend (2024-2032)
    15.2    Above 250 kW 
        15.2.1    Historical Trend (2018-2023)
        15.2.2    Forecast Trend (2024-2032)
16    Africa Electric Bus Market by Application
    16.1    Intercity
        16.1.1    Historical Trend (2018-2023)
        16.1.2    Forecast Trend (2024-2032)
    16.2    Intracity
        16.2.1    Historical Trend (2018-2023)
        16.2.2    Forecast Trend (2024-2032)
17    Africa Electric Bus Market by End Use 
    17.1    Public
        17.1.1    Historical Trend (2018-2023)
        17.1.2    Forecast Trend (2024-2032)
    17.2    Private
        17.2.1    Historical Trend (2018-2023)
        17.2.2    Forecast Trend (2024-2032)
18    Africa Electric Bus Market by Country
    18.1    South Africa
        18.1.1    Historical Trend (2018-2023)
        18.1.2    Forecast Trend (2024-2032)
    18.2    Egypt 
        18.2.1    Historical Trend (2018-2023)
        18.2.2    Forecast Trend (2024-2032)
    18.3    Nigeria
        18.3.1    Historical Trend (2018-2023)
        18.3.2    Forecast Trend (2024-2032)
    18.4    Algeria 
        18.4.1    Historical Trend (2018-2023)
        18.4.2    Forecast Trend (2024-2032)
    18.5    Others
19    Market Dynamics
    19.1    SWOT Analysis
        19.1.1    Strengths
        19.1.2    Weaknesses
        19.1.3    Opportunities
        19.1.4    Threats
    19.2    Porter’s Five Forces Analysis
        19.2.1    Supplier’s Power
        19.2.2    Buyer’s Power
        19.2.3    Threat of New Entrants
        19.2.4    Degree of Rivalry
        19.2.5    Threat of Substitutes
    19.3    Key Indicators for Demand
    19.4    Key Indicators for Price
20    Competitive Landscape
    20.1    Market Structure
    20.2    Company Profiles
        20.2.1    Mercedes-Benz Group AG 
            20.2.1.1    Company Overview
            20.2.1.2    Product Portfolio
            20.2.1.3    Demographic Reach and Achievements
            20.2.1.4    Certifications
        20.2.2    Kiira Motors Corporation
            20.2.2.1    Company Overview
            20.2.2.2    Product Portfolio
            20.2.2.3    Demographic Reach and Achievements
            20.2.2.4    Certifications
        20.2.3    BYD Motors, Inc. 
            20.2.3.1    Company Overview
            20.2.3.2    Product Portfolio
            20.2.3.3    Demographic Reach and Achievements
            20.2.3.4    Certifications
        20.2.4    MiPower Electric Bus (Masala Ramabulana Holdings) 
            20.2.4.1    Company Overview
            20.2.4.2    Product Portfolio
            20.2.4.3    Demographic Reach and Achievements
            20.2.4.4    Certifications
        20.2.5    Yutong Bus Co., Ltd. 
            20.2.5.1    Company Overview
            20.2.5.2    Product Portfolio
            20.2.5.3    Demographic Reach and Achievements
            20.2.5.4    Certifications
        20.2.6    Xiamen King Long International Trading Co.,Ltd. 
            20.2.6.1    Company Overview
            20.2.6.2    Product Portfolio
            20.2.6.3    Demographic Reach and Achievements
            20.2.6.4    Certifications
        20.2.7    Volvo Group 
            20.2.7.1    Company Overview
            20.2.7.2    Product Portfolio
            20.2.7.3    Demographic Reach and Achievements
            20.2.7.4    Certifications
        20.2.8    Tata Sons Private Limited 
            20.2.8.1    Company Overview
            20.2.8.2    Product Portfolio
            20.2.8.3    Demographic Reach and Achievements
            20.2.8.4    Certifications
        20.2.9    Roam 
            20.2.9.1    Company Overview
            20.2.9.2    Product Portfolio
            20.2.9.3    Demographic Reach and Achievements
            20.2.9.4    Certifications
        20.2.10    BasiGo 
            20.2.10.1    Company Overview
            20.2.10.2    Product Portfolio
            20.2.10.3    Demographic Reach and Achievements
            20.2.10.4    Certifications
        20.2.11    Others
21    Key Trends and Developments in the Market


List of Key Figures and Tables

1.    Global Electric Bus Market: Key Industry Highlights, 2018 and 2032
2.    Africa Electric Bus Market: Key Industry Highlights, 2018 and 2032
3.    Africa Electric Bus Historical Market: Breakup by Vehicle Type (USD Billion), 2018-2023
4.    Africa Electric Bus Market Forecast: Breakup by Vehicle Type (USD Billion), 2024-2032
5.    Africa Electric Bus Historical Market: Breakup by Battery Type (USD Billion), 2018-2023
6.    Africa Electric Bus Market Forecast: Breakup by Battery Type (USD Billion), 2024-2032
7.    Africa Electric Bus Historical Market: Breakup by Battery Capacity (USD Billion), 2018-2023
8.    Africa Electric Bus Market Forecast: Breakup by Battery Capacity (USD Billion), 2024-2032
9.    Africa Electric Bus Historical Market: Breakup by Bus Length (USD Billion), 2018-2023
10.    Africa Electric Bus Market Forecast: Breakup by Bus Length (USD Billion), 2024-2032
11.    Africa Electric Bus Historical Market: Breakup by Range (USD Billion), 2018-2023
12.    Africa Electric Bus Market Forecast: Breakup by Range (USD Billion), 2024-2032
13.    Africa Electric Bus Historical Market: Breakup by Power Output (USD Billion), 2018-2023
14.    Africa Electric Bus Market Forecast: Breakup by Power Output (USD Billion), 2024-2032
15.    Africa Electric Bus Historical Market: Breakup by Application (USD Billion), 2018-2023
16.    Africa Electric Bus Market Forecast: Breakup by Application (USD Billion), 2024-2032
17.    Africa Electric Bus Historical Market: Breakup by End Use (USD Billion), 2018-2023
18.    Africa Electric Bus Market Forecast: Breakup by End Use (USD Billion), 2024-2032
19.    Africa Electric Bus Historical Market: Breakup by Country (USD Billion), 2018-2023
20.    Africa Electric Bus Market Forecast: Breakup by Country (USD Billion), 2024-2032
21.    Africa Electric Bus Market Structure

Key Questions Answered in the Report

The market reached a value of approximately USD 1.60 billion in 2023.

The market is projected to grow at a CAGR of 14.1% between 2024 and 2032.

The market is estimated to witness a healthy growth in the forecast period of 2024-2032 to reach USD 5.24 billion by 2032.

The major market drivers include increased adoption of electric buses due to no tailpipe emissions and economic efficiency of the vehicle.

The key trends fuelling the growth of the market include social and community benefits offered by adoption of electric buses and requirement for less maintenance due to presence of fewer components.

The major countries in the market are South Africa, Egypt, Nigeria, and Algeria, among others.

The significant propulsion types available in the market include battery electric vehicle, plug-in hybrid electric vehicle, and fuel cell electric vehicle.

The key players in the market are Mercedes-Benz Group AG, Kiira Motors Corporation, BYD Motors, Inc., MiPower Electric Bus (Masala Ramabulana Holdings), Yutong Bus Co., Ltd., Xiamen King Long International Trading Co.,Ltd., Volvo Group, Tata Sons Private Limited, Roam, and BasiGo, among others.

Purchase Full Report

Mini Report

$ 2199     $1999
  • Selected Sections, One User
  • Printing Not Allowed
  • Email Delivery in PDF
  • Free Limited Customisation
  • Post Sales Analyst Support
  • 50% Discount on Next Update

Single User License

$ 3299     $2999
  • All Sections, One User
  • One Print Allowed
  • Email Delivery in PDF
  • Free Limited Customisation
  • Post Sales Analyst Support
  • 50% Discount on Next Update
most popular

Five User License

$ 4399     $3999
  • All Sections, Five Users
  • Five Prints Allowed
  • Email Delivery in PDF
  • Free Limited Customisation
  • Post Sales Analyst Support
  • 50% Discount on Next Update

Corporate License

$ 5499     $4999
  • All Sections, Unlimited Users
  • Unlimited Prints Allowed
  • Email Delivery in PDF + Excel
  • Free Limited Customisation
  • Post Sales Analyst Support
  • 50% Discount on Next Update

Any Question? Speak With An Analyst

Contact Analyst

View A Sample

Request Sample

Did You Miss Anything, Ask Now

Request Customisation
Why Expert Market Research?

Right People

We are technically excellent, strategic, practical, experienced and efficient; our analysts are hand-picked based on having the right attributes to work successfully and execute projects based on your expectations.

Right Methodology

We leverage our cutting-edge technology, our access to trusted databases, and our knowledge of the current models used in the market to deliver you research solutions that are tailored to your needs and put you ahead of the curve.

Right Price

We deliver in-depth and superior quality research in prices that are reasonable, unmatchable, and shows our understanding of your resource structure. We, additionally, offer attractive discounts on our upcoming reports.

Right Support

Our team of expert analysts are at your beck and call to deliver you optimum results that are customised to meet your precise needs within the specified timeframe and help you form a better understanding of the industry.

NEWSLETTER