

Consumer Insights
Uncover trends and behaviors shaping consumer choices today
Procurement Insights
Optimize your sourcing strategy with key market data
Industry Stats
Stay ahead with the latest trends and market analysis.
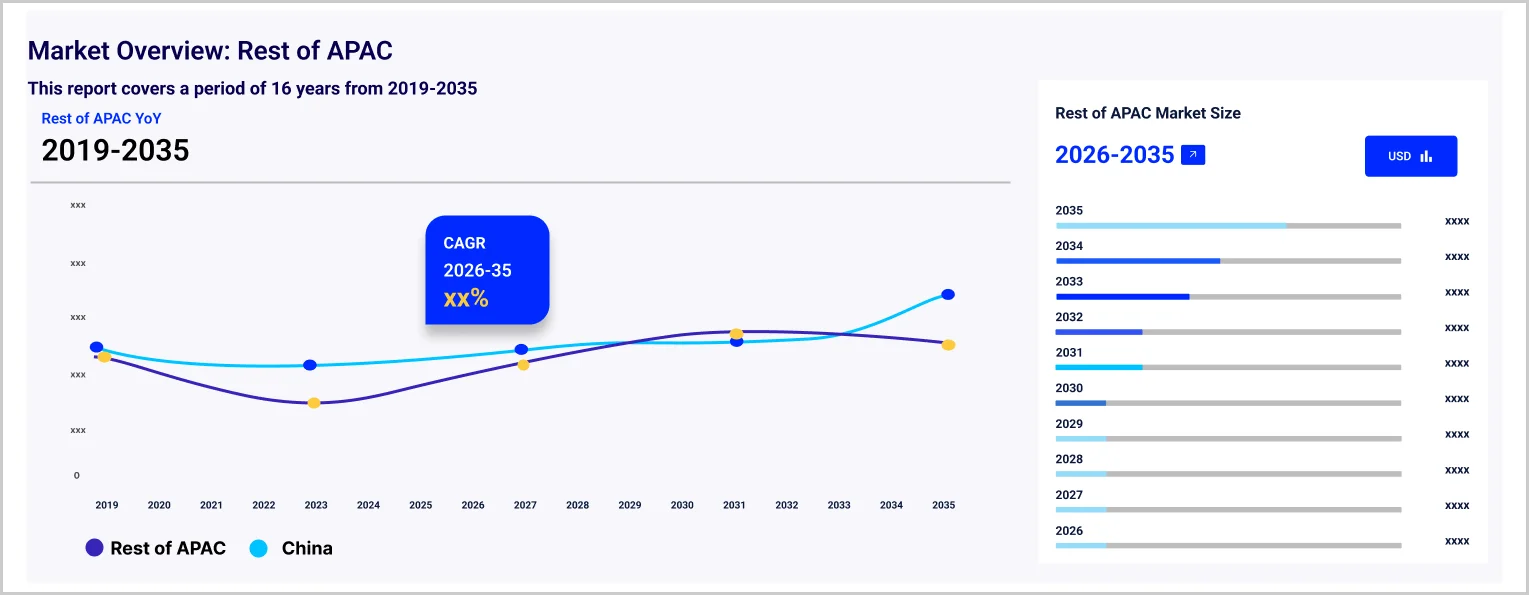
The Asia Pacific e-commerce market value reached approximately USD 3.27 Trillion in 2025. The market is projected to grow at a CAGR of 12.80% between 2026 and 2035, reaching a value of around USD 10.91 Trillion by 2035.
Compound Annual Growth Rate
12.8%
Value in USD Trillion
2026-2035
| Asia Pacific E-Commerce Market Report Summary | Description | Value |
| Base Year | USD Trillion | 2025 |
| Historical Period | USD Trillion | 2019-2025 |
| Forecast Period | USD Trillion | 2026-2035 |
| Market Size 2025 | USD Trillion | 3.27 |
| Market Size 2035 | USD Trillion | 10.91 |
| CAGR 2019-2025 | Percentage | XX% |
| CAGR 2026-2035 | Percentage | 12.80% |
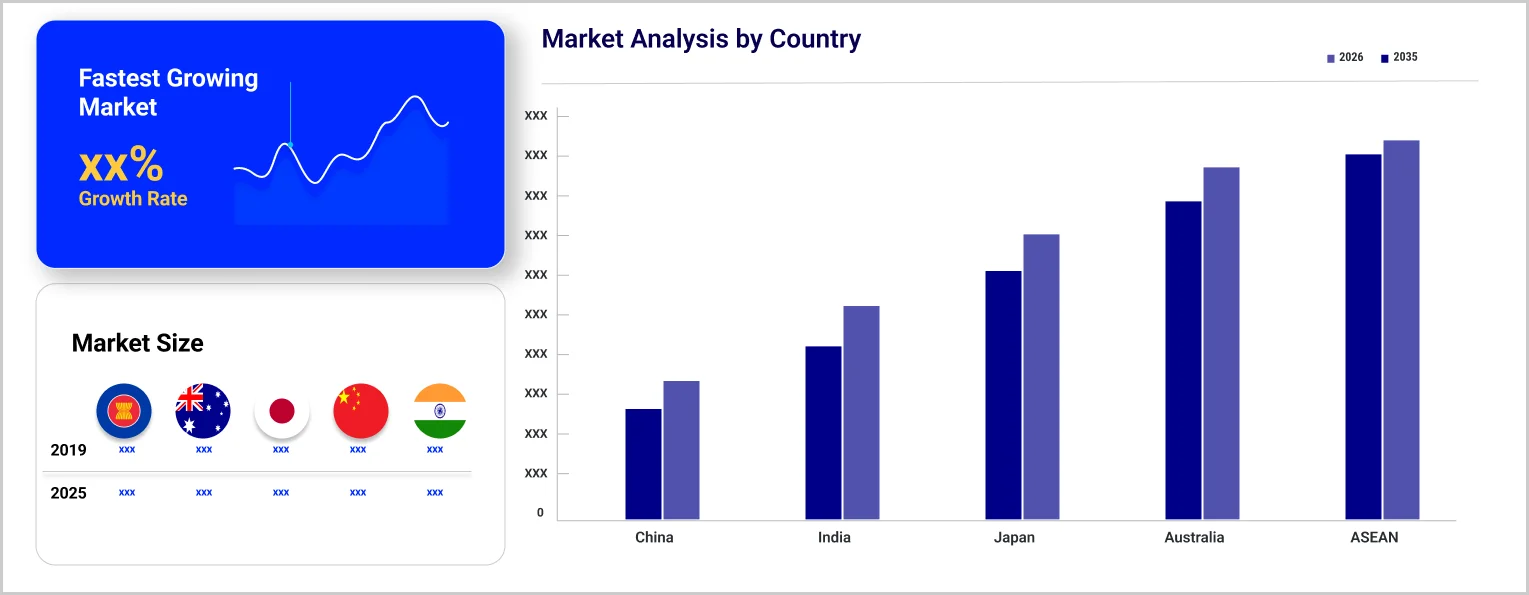
| CAGR 2026-2035 - Market by Country | India | 13.4% |
| CAGR 2026-2035 - Market by Country | China | 11.4% |
| CAGR 2026-2035 - Market by Type | Business to Consumer (B2C) | 15.7% |
| CAGR 2026-2035 - Market by Industry | Beauty and Personal Care | 14.6% |
E-commerce offers numerous benefits for businesses and customers alike. For businesses, it provides global reach, lowers operational costs, enables 24/7 operations, facilitates data-driven decisions, increases efficiency, ensures scalability, allows for personalised shopping experiences, and grants access to niche markets.
The Asia Pacific e-commerce market dynamics and trends are being enhanced as customers enjoy the convenience of shopping at any time and from any location, easy price comparisons, a broad range of products, time savings, detailed product information, home delivery services, and access to exclusive online discounts and promotions.
Rapid technological advancements such as voice recognition, augmented reality, and artificial intelligence are significantly contributing to the growth of the Asia Pacific e-commerce market. In 2022, Alibaba’s retail sales exceeded EUR 440 billion, positioning itself as the leading retailer in the region. Furthermore, cross-border B2C e-commerce is becoming increasingly popular in the Asia-Pacific region due to the convenience, diverse product selection, and competitive pricing it provides to consumers, further boosting Asia Pacific e-commerce market revenue.
According to the International Telecommunication Union, in 2023, Asia Pacific exhibited substantial internet usage, with 66% of its population online, indicating strong growth in digital connectivity. Asia-Pacific reported 69% of males and 63% of females as internet users, reflecting ongoing efforts to enhance digital access across diverse populations.
According to the Reserve Bank of India (RBI), the National Payments Corporation of India (NPCI), and the DIGIDHAN Portal, digital payment transactions in India have shown significant growth in recent years. In the financial year 2017-18, the volume of digital transactions was 20.7 billion. This trend continued to expand, with transactions totalling 134.6 billion in 2022-23, contributing to the growth of Asia Pacific e-commerce industry revenue.
According to the Reserve Bank of Australia, consumer payment methods have significantly evolved between 2019 and 2022. Card payments saw a substantial increase from 63% to 76%, indicating a strong shift towards digital transactions. Within this category, debit card usage rose from 44% to 51%, and credit and charge card usage increased from 19% to 26%. These trends underscore a growing preference for digital payment solutions among consumers.
According to the China Internet Network Information Centre’s Statistical Survey on China's Internet Development, between June 2022 and June 2023, China's netizen population grew from 1.050 billion to 1.079 billion. During this period, internet penetration increased from 74.4% to 76.4%, marking a 2% rise. This substantial growth highlights a strong increase in internet accessibility and adoption throughout the country, showcasing China's ongoing digital transformation and further driving the growth of the Asia Pacific e-commerce market.
According to the Statistics Bureau, Ministry of Internal Affairs and Communications, the proportion of two-or-more-person households ordering over the Internet significantly increased from approximately 40% in 2019 to 55% in 2021.
“Asia Pacific E-commerce Market Report and Forecast 2026-2035” offers a detailed analysis of the market based on the following segments:
Market Breakup by Type
Market Breakup by Industry
Market Breakup by Region
| CAGR 2026-2035 - Market by | Country |
| India | 13.4% |
| China | 11.4% |
| Japan | XX% |
| Australia | XX% |
| ASEAN | XX% |
| Others | XX% |
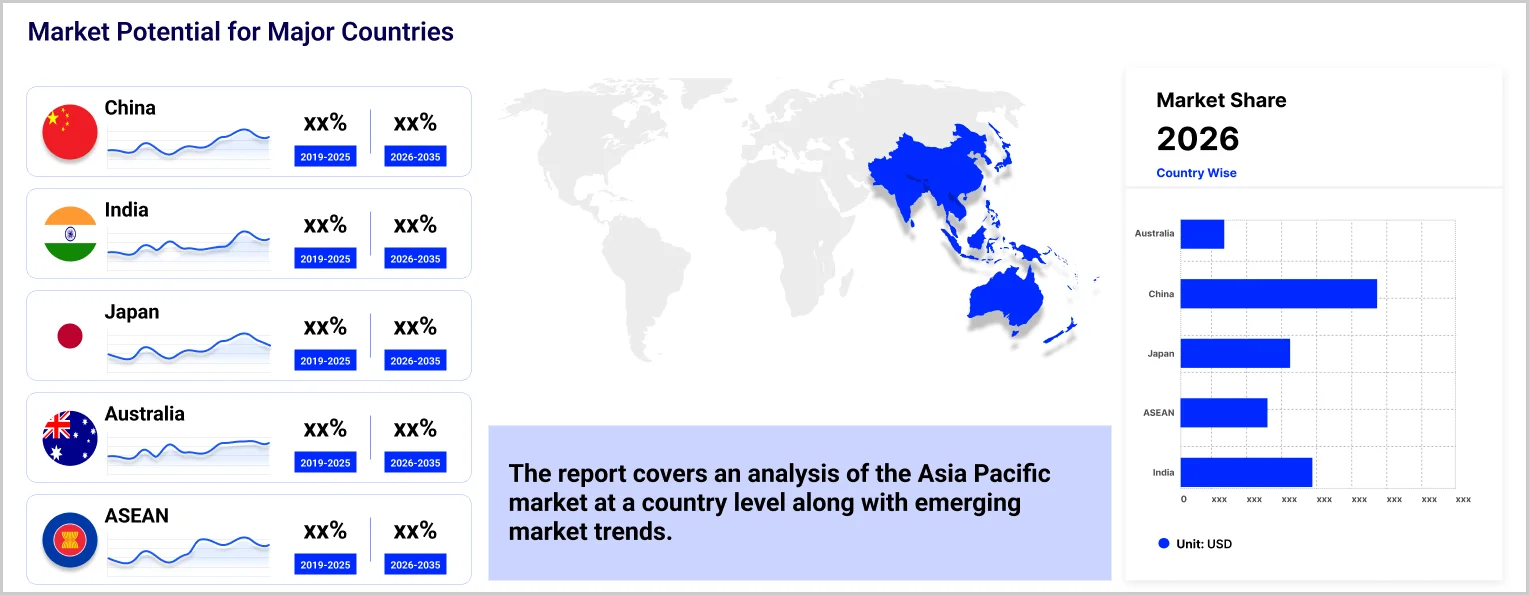
Among the countries of APAC, China boasts about a billion internet users. China is considered the largest e-commerce market on a global scale, generating about 50% of the world’s transactions. In 2021, China stood first in the Asia Pacific e-commerce industry with a revenue of USD 1.5 trillion, ahead of the United States. E-commerce has been substantially growing in China, predominantly due to the presence of strong domestic technological infrastructure and the reforms in Chinese trade policy.
The companies provide a wide range of products, including books, electronics, groceries, and cloud computing services. They are recognised for their strong customer orientation, innovation, and effective logistics infrastructure.
Upto 15% Off
USD
$2499 $2249
$3999 $3599
$4999 $4249
$5999 $5099


*While we strive to always give you current and accurate information, the numbers depicted on the website are indicative and may differ from the actual numbers in the main report. At Expert Market Research, we aim to bring you the latest insights and trends in the market. Using our analyses and forecasts, stakeholders can understand the market dynamics, navigate challenges, and capitalize on opportunities to make data-driven strategic decisions.*
The e-commerce market reached a value of approximately USD 3.27 Trillion in 2025.
The Asia Pacific E-commerce market is assessed to grow at a CAGR of 12.80% between 2026 and 2035.
The Asia Pacific e-commerce market is estimated to witness healthy growth during 2026-2035 to reach around USD 10.91 Trillion by 2035.
The factors aiding the growth of the market are increasing internet penetration, rising disposable income, increasing purchase of smartphones, and rising availability of brands in online channels, among others.
Business to Consumer (B2C) and Business to Business (B2B) are the two types of e-commerce.
The market is broken down into China, Japan, India, ASEAN, and Australia, among others.
The major industries include beauty and personal care, fashion and apparel, consumer electronics, food and beverage, health and wellness, home décor, and household consumables, among others.
The competitive landscape consists of Amazon.com, Inc., Walmart Inc., Alibaba Group Holding Ltd., Shopify Inc., Etsy, Inc., JD.com Inc., Rakuten Group Inc., eBay Inc., Jade E-Services Singapore Pte. Ltd. (Zalora), Sea Ltd. (Shopee), and Flipkart Private Limited among others.
Explore our key highlights of the report and gain a concise overview of key findings, trends, and actionable insights that will empower your strategic decisions.
| REPORT FEATURES | DETAILS |
| Base Year | 2025 |
| Historical Period | 2019-2025 |
| Forecast Period | 2026-2035 |
| Scope of the Report |
Historical and Forecast Trends, Industry Drivers and Constraints, Historical and Forecast Market Analysis by Segment:
|
| Breakup by Type |
|
| Breakup by Industry |
|
| Breakup by Region |
|
| Market Dynamics |
|
| Competitive Landscape |
|
| Companies Covered |
|
Datasheet
One User
USD 2,499
USD 2,249
tax inclusive*
Single User License
One User
USD 3,999
USD 3,599
tax inclusive*
Five User License
Five User
USD 4,999
USD 4,249
tax inclusive*
Corporate License
Unlimited Users
USD 5,999
USD 5,099
tax inclusive*
*Please note that the prices mentioned below are starting prices for each bundle type. Kindly contact our team for further details.*
Flash Bundle
Small Business Bundle
Growth Bundle
Enterprise Bundle
*Please note that the prices mentioned below are starting prices for each bundle type. Kindly contact our team for further details.*
Flash Bundle
Number of Reports: 3
20%
tax inclusive*
Small Business Bundle
Number of Reports: 5
25%
tax inclusive*
Growth Bundle
Number of Reports: 8
30%
tax inclusive*
Enterprise Bundle
Number of Reports: 10
35%
tax inclusive*
How To Order

Select License Type
Choose the right license for your needs and access rights.

Click on ‘Buy Now’
Add the report to your cart with one click and proceed to register.

Select Mode of Payment
Choose a payment option for a secure checkout. You will be redirected accordingly.
Strategic Solutions for Informed Decision-Making
Gain insights to stay ahead and seize opportunities.

Get insights & trends for a competitive edge.

Track prices with detailed trend reports.

Analyse trade data for supply chain insights.

Leverage cost reports for smart savings

Enhance supply chain with partnerships.

Connect For More Information
Our expert team of analysts will offer full support and resolve any queries regarding the report, before and after the purchase.
Our expert team of analysts will offer full support and resolve any queries regarding the report, before and after the purchase.
We employ meticulous research methods, blending advanced analytics and expert insights to deliver accurate, actionable industry intelligence, staying ahead of competitors.
Our skilled analysts offer unparalleled competitive advantage with detailed insights on current and emerging markets, ensuring your strategic edge.
We offer an in-depth yet simplified presentation of industry insights and analysis to meet your specific requirements effectively.


