

Consumer Insights
Uncover trends and behaviors shaping consumer choices today
Procurement Insights
Optimize your sourcing strategy with key market data
Industry Stats
Stay ahead with the latest trends and market analysis.
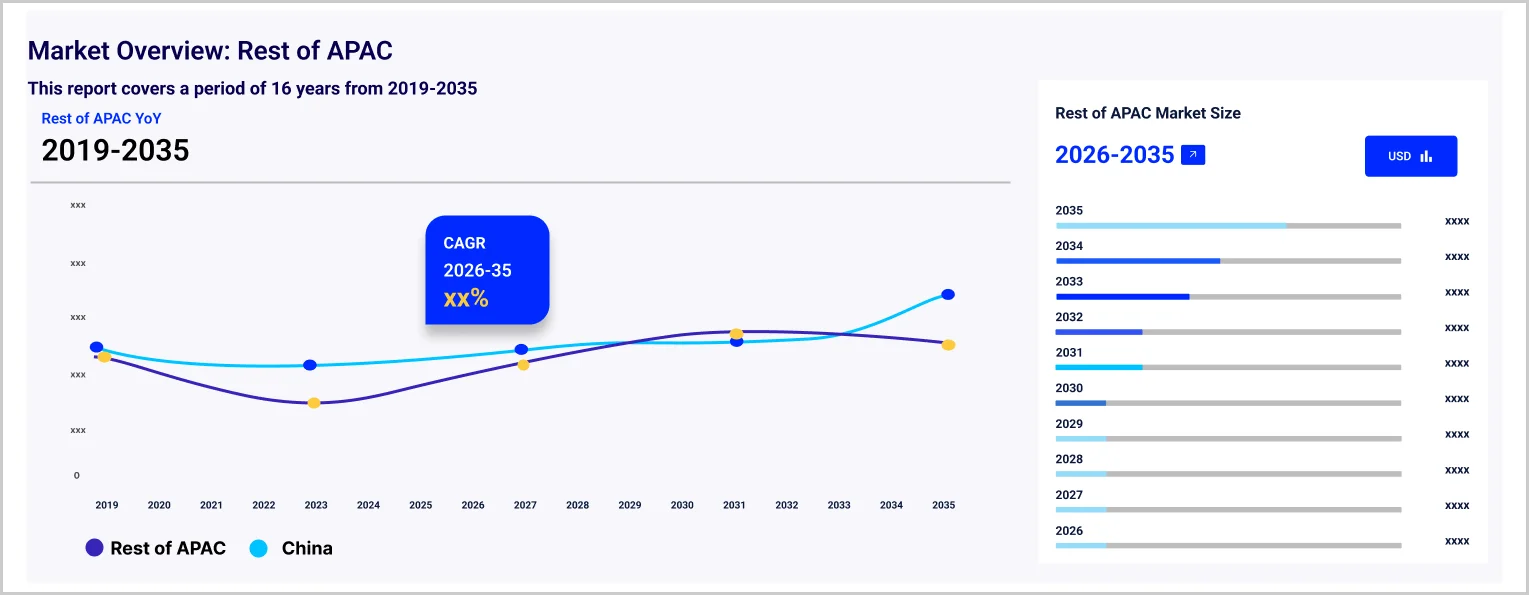
The Asia Pacific electric bus market was approximately USD 45.04 Billion in 2025. The market is assessed to grow at a CAGR of 14.60% between 2026 and 2035, reaching a value of USD 175.97 Billion by 2035.
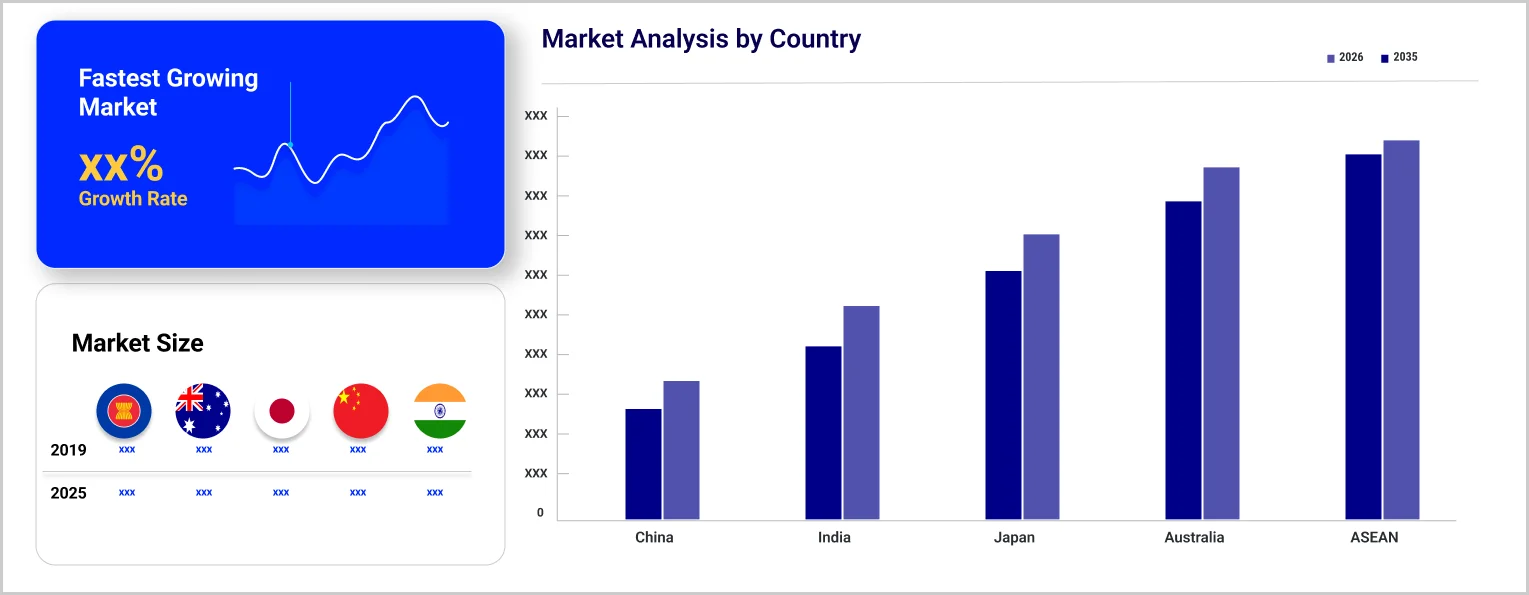
China leads the way in electric vehicle adoption in the Asia Pacific, with 6.1 million electric vehicle sales in 2022. China also dominates global electric bus sales, accounting for over 90% of the market share.
Asian countries like Nepal and Bhutan can use electric mobility to reduce their reliance on oil imports, conserving foreign exchange reserves spent on importing transportation fuels, which aids the demand of Asia Pacific electric bus market.
The adoption of electric buses can prove to be a game changer in accelerating the electrification of public transport, cutting greenhouse gas emissions by up to 70% compared to CNG buses.
Compound Annual Growth Rate
14.6%
Value in USD Billion
2026-2035
| Asia Pacific Electric Bus Market Report Summary | Description | Value |
| Base Year | USD Billion | 2025 |
| Historical Period | USD Billion | 2019-2025 |
| Forecast Period | USD Billion | 2026-2035 |
| Market Size 2025 | USD Billion | 45.04 |
| Market Size 2035 | USD Billion | 175.97 |
| CAGR 2019-2025 | Percentage | XX% |
| CAGR 2026-2035 | Percentage | 14.60% |
| CAGR 2026-2035 - Market by Region | India | 16.7% |
| CAGR 2026-2035 - Market by Region | Japan | 13.9% |
| CAGR 2026-2035 - Market by Propulsion | Battery Electric Vehicle | 16.4% |
| CAGR 2026-2035 - Market by Application | Intracity | 16.1% |
| Market Share by Region | India | 12.3% |
Shifting government policies to incorporate sustainable development in economic growth is expected to drive the growth of the Asia Pacific electric bus market. Indonesia plans to replace 90% of its urban public transport fleet with e-buses whereas Malaysia is planning to introduce 2000 e-buses by 2030. Additionally, Singapore, where buses are the main mode of public transport, aims to replace 3000 petrol/diesel buses and phase out all such vehicles by 2040.
The use of electric buses for intracity application is expected to witness significant growth over the forecast period. This is because of improving transportation networks and growing environmental concerns accelerating the shift from private vehicles to public transportation. With government intervention, public transport is expected to provide a convenient alternative to people who prefer personal vehicles, especially for short distances.
Advanced technological capabilities of automobile manufacturers are enabling them to manufacture premium electric buses. A crucial trend of Asia Pacific electric bus market is that government ownership of electric buses is also expected to increase as investments towards improving infrastructural capabilities continue to increase. Cross-country partnerships are also influencing the growth rate of EV manufacturing. The development of national policies and strategies by Asia Pacific countries to support the transition to electric mobility and their implementation is expected to favour the growth of the market in the coming years.
As per the Asia Pacific electric bus market dynamics and trends, Tata Motors announced the launch of the Ultra EV 7M' electric bus in India in September 2024, which is suitable for congested areas of urban areas and small cities.
As per the Asia Pacific electric bus industry analysis, China leads the APAC market with the highest number of EV buses deployed in the country. This high rate of deployment is due to the country’s participation in the zero-emissions program in 2009 to improve its poor air quality. Moreover, in India, under the Faster Adoption and Manufacturing of (Hybrid &) Electric Vehicles (FAME) programmes, around 10,000 EV buses were deployed in the major cities.
Jakarta, the capital of Indonesia, can offer a lucrative opportunity for the growth of the Asia Pacific electric bus industry due to the high amount of air pollution as well as low usage of public transport. This has led to organisations such as UNEP and C40 coming forward to support the electrification of TransJakarta’s entire fleet by 2030 as well as increase the usage of public transport to 60% to avail the benefits in the capital city.
"Asia Pacific Electric Bus Market Report and Forecast 2026-2035" offers a detailed analysis of the market based on the following segments:
Market Breakup by Propulsion
Market Breakup by Length
Market Breakup by Power Output
Market Breakup by Battery Capacity
Market Breakup by Application
Market breakup by Ownership
Market Breakup by Country
| CAGR 2026-2035 - Market by | Country |
| India | 16.7% |
| Japan | 13.9% |
| ASEAN | 13.1% |
| China | XX% |
| Australia | XX% |
| Others | XX% |
The market participants are increasingly focusing on manufacturing efficient electric vehicles and building charging infrastructure to promote the use of electric buses as a means of public transportation.
Strategic Initiatives:
Strategic Initiatives:
Strategic Initiatives:
Strategic Initiatives:
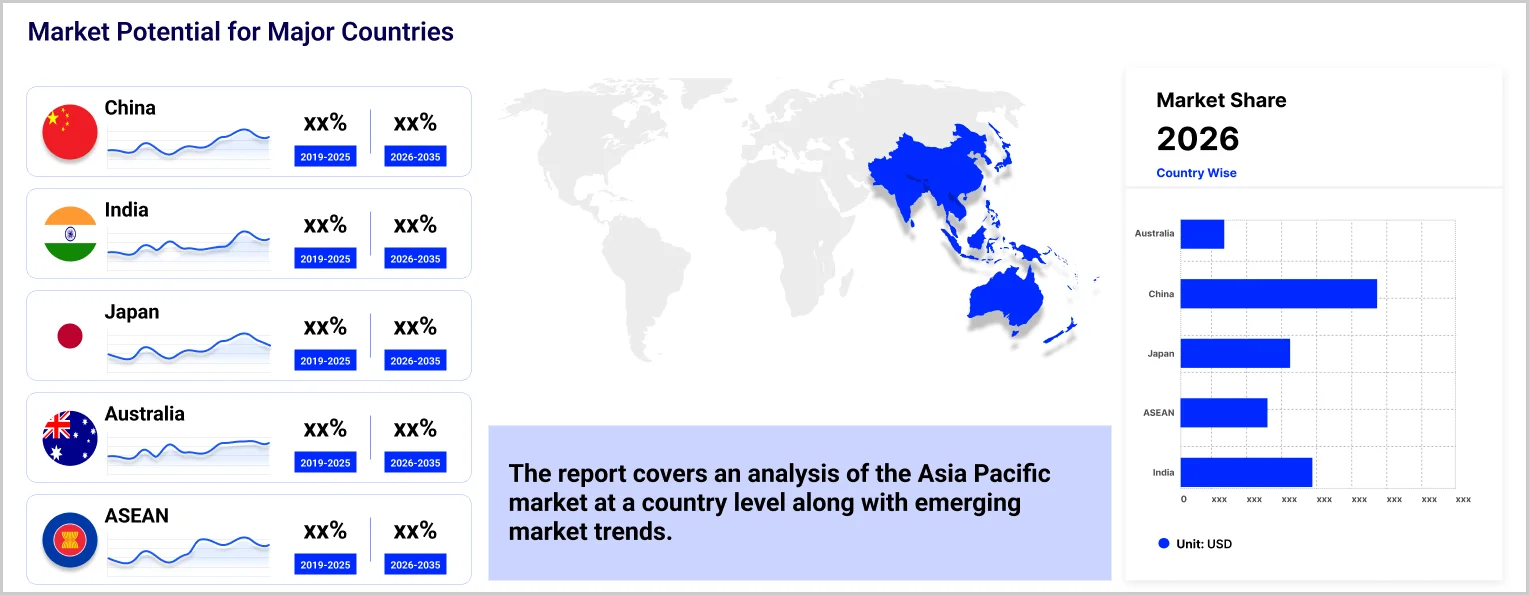
China has around 90% of the world’s electric buses in operation and occupies a significant share of the market. Meanwhile, the Indian government announced the National Electric Bus Program (NEBP) under which 50,000 electric buses will run across the country by 2030, boosting the electric bus market share in the Asia Pacific.
Upto 15% Off
USD
$2499 $2249
$3999 $3599
$4999 $4249
$5999 $5099


*While we strive to always give you current and accurate information, the numbers depicted on the website are indicative and may differ from the actual numbers in the main report. At Expert Market Research, we aim to bring you the latest insights and trends in the market. Using our analyses and forecasts, stakeholders can understand the market dynamics, navigate challenges, and capitalize on opportunities to make data-driven strategic decisions.*
In 2025, the market reached an approximate value of USD 45.04 Billion.
The market is estimated to grow at a CAGR of 14.60% between 2026 and 2035.
The market is estimated to witness healthy growth in the forecast period of 2026-2035 to reach a value of around USD 175.97 Billion by 2035.
The market is being driven by the worldwide shift towards electric vehicles and increasing environmental awareness among individuals.
The key trends aiding the market expansion include the development of electric vehicle charging infrastructure and rising government initiatives to support the adoption of electric public transportation.
The major applications according to the market report are intercity and intracity.
The major types of ownership include private and government.
The major players in the market are AB Volvo, BYD Company Limited, Anhui Ankai Automobile Co. Ltd., Zhengzhou Yutong Bus Co., Ltd., Tata Motors Limited, Dongfeng Motor Corporation, Olectra Greentech Limited, Liaoning SG Automotive Group Co., Ltd., HINDUJA Group, and Zhongtong Bus Holding Co., Ltd., among others.
Explore our key highlights of the report and gain a concise overview of key findings, trends, and actionable insights that will empower your strategic decisions.
| REPORT FEATURES | DETAILS |
| Base Year | 2025 |
| Historical Period | 2019-2025 |
| Forecast Period | 2026-2035 |
| Scope of the Report |
Historical and Forecast Trends, Industry Drivers and Constraints, Historical and Forecast Market Analysis by Segment:
|
| Breakup by Propulsion |
|
| Breakup by Length |
|
| Breakup by Power Output |
|
| Breakup by Battery Capacity |
|
| Breakup by Application |
|
| Breakup by Ownership |
|
| Breakup by Region |
|
| Market Dynamics |
|
| Competitive Landscape |
|
| Companies Covered |
|
Datasheet
One User
USD 2,499
USD 2,249
tax inclusive*
Single User License
One User
USD 3,999
USD 3,599
tax inclusive*
Five User License
Five User
USD 4,999
USD 4,249
tax inclusive*
Corporate License
Unlimited Users
USD 5,999
USD 5,099
tax inclusive*
*Please note that the prices mentioned below are starting prices for each bundle type. Kindly contact our team for further details.*
Flash Bundle
Small Business Bundle
Growth Bundle
Enterprise Bundle
*Please note that the prices mentioned below are starting prices for each bundle type. Kindly contact our team for further details.*
Flash Bundle
Number of Reports: 3
20%
tax inclusive*
Small Business Bundle
Number of Reports: 5
25%
tax inclusive*
Growth Bundle
Number of Reports: 8
30%
tax inclusive*
Enterprise Bundle
Number of Reports: 10
35%
tax inclusive*
How To Order

Select License Type
Choose the right license for your needs and access rights.

Click on ‘Buy Now’
Add the report to your cart with one click and proceed to register.

Select Mode of Payment
Choose a payment option for a secure checkout. You will be redirected accordingly.
Strategic Solutions for Informed Decision-Making
Gain insights to stay ahead and seize opportunities.

Get insights & trends for a competitive edge.

Track prices with detailed trend reports.

Analyse trade data for supply chain insights.

Leverage cost reports for smart savings

Enhance supply chain with partnerships.

Connect For More Information
Our expert team of analysts will offer full support and resolve any queries regarding the report, before and after the purchase.
Our expert team of analysts will offer full support and resolve any queries regarding the report, before and after the purchase.
We employ meticulous research methods, blending advanced analytics and expert insights to deliver accurate, actionable industry intelligence, staying ahead of competitors.
Our skilled analysts offer unparalleled competitive advantage with detailed insights on current and emerging markets, ensuring your strategic edge.
We offer an in-depth yet simplified presentation of industry insights and analysis to meet your specific requirements effectively.


