

Consumer Insights
Uncover trends and behaviors shaping consumer choices today
Procurement Insights
Optimize your sourcing strategy with key market data
Industry Stats
Stay ahead with the latest trends and market analysis.
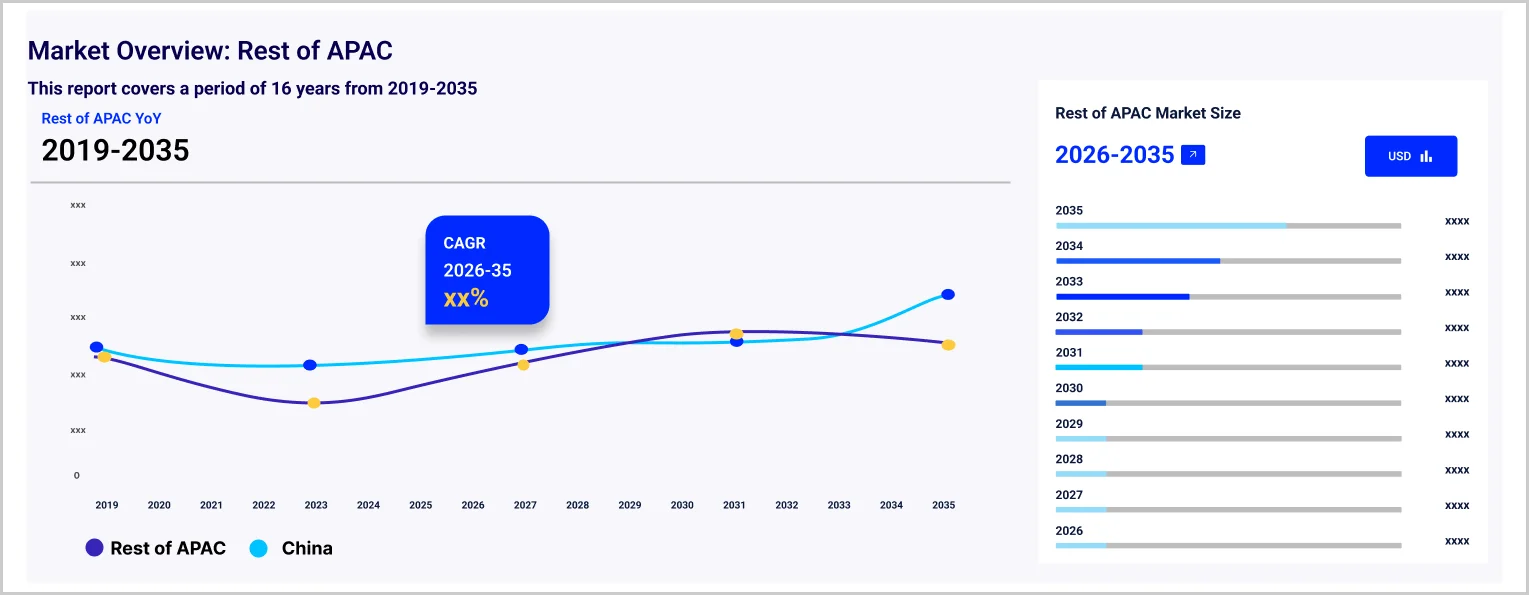
The Asia Pacific flavours and fragrances market reached a value of USD 9.39 Billion at 2025 and is projected to expand at a CAGR of around 5.00% during the forecast period of 2026-2035. Growth is driven by rising demand for natural and clean-label ingredients, middle-class premiumisation in China, India, and Southeast Asia, biotechnology-derived molecule innovation reducing synthetic dependence, and growing food processing activity, pushing the market toward USD 15.30 Billion by 2035.
Compound Annual Growth Rate
5%
Value in USD Billion
2026-2035
Read more about this report - REQUEST FREE SAMPLE COPY IN PDF
The Asia Pacific flavours and fragrances market is structurally picking up pace, driven by rising consumer spending, natural ingredient demand, and consistent multinational investment in regional innovation hubs in China, Singapore, India, and Japan.
IFF expanded its Singapore Innovation Center in July 2025 with an Immersive Experience Hub integrating 360-degree video, multisensory tasting, fragrance immersion, and real-time co-creation capabilities.
Givaudan SA announced a CHF 50 million investment in its Indonesian manufacturing facility in March 2025 to expand production capacity for the quickly growing Indonesian and broader Southeast Asian market.
IFF reported 8.8% revenue growth in Asia Pacific for 2024, its highest regional growth globally, which confirms steady demand growth across China, India, and Southeast Asia.
Givaudan SA established L'Appartement 125, a new Fine Fragrance Creative Centre in Shanghai's Xintiandi district, in October 2024, creating a dedicated collaborative platform for co-developing fine fragrances with Chinese luxury and premium beauty brands.
Natural and plant-based ingredient demand is reshaping formulation priorities across Asia Pacific food, beverage, and personal care sectors.
China has emerged as the world's leading fine and luxury fragrance growth market, with consumers embracing personal fragrance as self-expression.
Biotechnology and precision fermentation enable natural-identical molecule production at industrial scale, reducing petroleum-derived synthetic precursor dependence.
India's heritage in attars, incense, and Ayurvedic preparations underpins its growing fragrance market presence.
AI and data analytics are allowing personalised flavour and fragrance development by processing consumer preference data and regional taste databases.
Read more about this report - REQUEST FREE SAMPLE COPY IN PDF
The report of the Expert Market Research's titled "Asia Pacific Flavours and Fragrances Market Report and Forecast 2026-2035" offers a detailed analysis of the market based on the following segments:
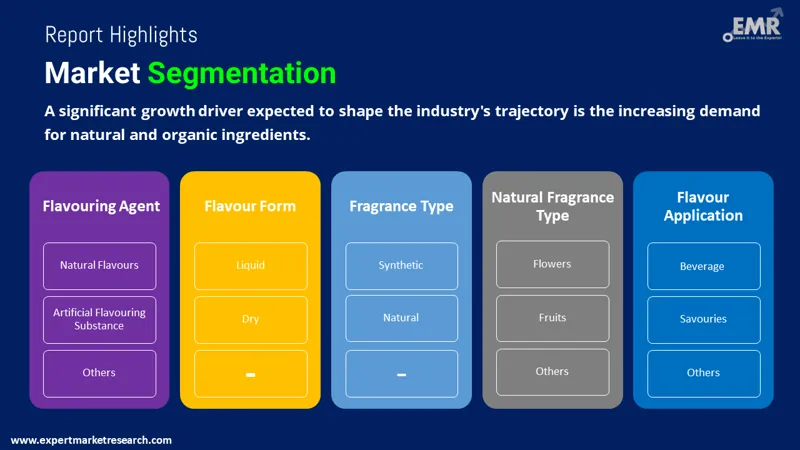
Asia Pacific Flavours Market Breakup by Product Types
Key Insight: Nature identical flavouring substances hold the largest share through cost-performance balance and regulatory acceptance. Natural flavours are the fastest-growing type in China, Japan, South Korea, and Australia, while artificial substances serve cost-sensitive manufacturing across Southeast and South Asia.
Asia Pacific Flavours Market Breakup by Form
Key Insight: Liquid flavours hold the dominant form share at approximately 41% of the regional flavours segment, compatible with beverage and liquid food aqueous processing. The dry flavours segment serves snack, bakery, and dry seasoning applications and is growing strongly alongside Asia Pacific’s substantial snack manufacturing industry.
Asia Pacific Flavours Market Breakup by Applications
Key Insight: Beverages represent the largest flavour application at approximately 36% of the regional segment and the highest CAGR, driven by ready-to-drink tea, functional beverages, low-sugar carbonated drinks, and premium juice categories. IFF, Givaudan, and regional Asian flavour houses serve diverse taste preferences and regulatory requirements.
Asia Pacific Flavours Market Breakup by Country
Key Insight: China dominates with approximately 42% of regional flavours market share, backed by the world’s largest food processing industry and substantial indigenous innovation investment.
Asia Pacific Fragrances Market Breakup by Ingredients
Key Insight: Synthetic fragrance ingredients hold approximately 69% of the Asia Pacific fragrances market, valued for cost competitiveness and complex profile consistency in soaps, detergents, and household cleaners.
Asia Pacific Fragrances Market Breakup by Natural Fragrance Types
Key Insight: Floral types dominate natural fragrance categories, with rose, jasmine, and orchid profiles holding deep cultural significance across personal care, fine fragrance, and home care.
Asia Pacific Fragrances Market Breakup by Applications
Key Insight: Soap and detergents are the largest fragrance application, anchored by enormous Southeast and South Asian laundry care and personal wash markets where fragrance is a primary purchase driver.
Asia Pacific Fragrances Market Breakup by Country
Key Insight: China is the dominant fragrance country market, combining FMCG industrial demand with expanding fine fragrance consumption from urban young adults and domestic Chinese fragrance brands targeting culturally resonant narratives.
Read more about this report - REQUEST FREE SAMPLE COPY IN PDF
By Product Types (Flavours), natural flavours are growing fastest driven by consumer demand for authentic and clean-label food ingredient provenance across Asia Pacific premium categories.
Natural flavours are the highest-growth product type, driven by clean-label demand in China, Japan, South Korea, and Australia.
By Form (Flavours), Liquid Flavours account for the dominant share of the Asia Pacific flavours market due to beverage and liquid food application compatibility with aqueous processing environments
Liquid flavours hold the dominant form share, required by large-scale beverage and dairy manufacturing for aqueous processing compatibility.
By Applications (Flavours), Beverages account for the dominant share of the Asia Pacific flavours market due to the region's large-scale ready-to-drink tea, functional beverage, and carbonated drink manufacturing base
Beverages represent the largest flavour application, led by ready-to-drink tea, functional drinks, and low-sugar carbonated categories.
By Country (Flavours), China accounts for the dominant share of the Asia Pacific flavours market due to the world's largest food processing industry, rapid domestic consumer goods premiumisation, and substantial indigenous flavour innovation investment
China dominates the Asia Pacific flavours market through the world’s largest food processing industry spanning instant noodles, ready-to-drink tea, snacks, condiments, and functional foods.
By Natural Fragrance Types, Floral accounts for the dominant share of the Asia Pacific fragrances market due to the universal appeal of rose, jasmine, and orchid fragrance profiles across personal care, fine fragrance, and home care applications
Floral types dominate natural fragrance categories, with rose, jasmine, and orchid profiles deeply embedded across personal care, fine fragrance, and home care.
By Applications (Fragrances), Soap and Detergents account for the dominant share of the Asia Pacific fragrances market due to the enormous scale of laundry care, dish care, and personal wash manufacturing across Southeast and South Asia
Soap and detergents are the largest fragrance application, led by enormous Southeast and South Asian laundry care and personal wash markets where fragrance is a primary consumer purchase driver.
By Country (Fragrances), China accounts for the dominant share of the Asia Pacific fragrances market due to rapidly expanding fine fragrance consumption, the growth of domestic fragrance brands, and the substantial scale of Chinese home care and personal wash manufacturing
Read more about this report - REQUEST FREE SAMPLE COPY IN PDF
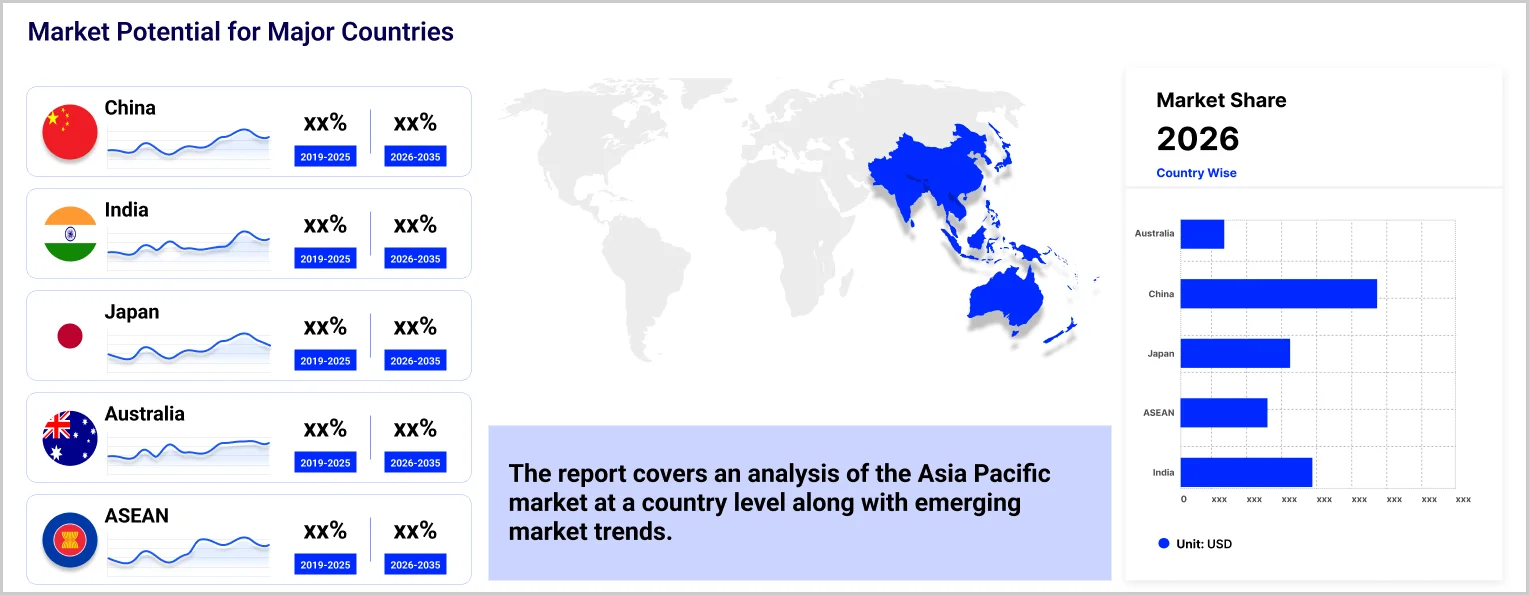
China dominates the Asia Pacific flavours and fragrances market due to its position as the region's largest food and beverage manufacturing country and its rapidly growing premium fragrance consumption base.
China holds approximately 42% of regional market value, led by the world's largest food processing industry and explosive growth in domestic fine fragrance consumption.
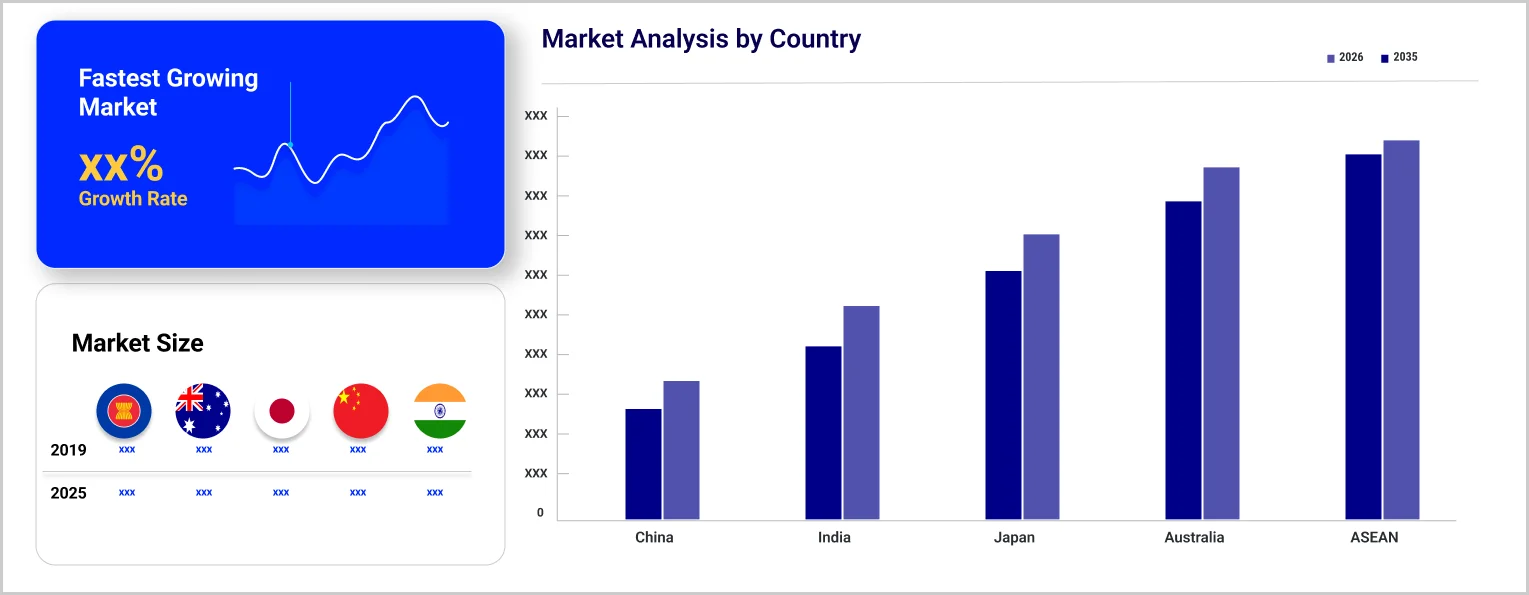
India is the fastest-growing major country market, driven by packaged food and the Ayurvedic wellness sector.
The market features a dual-tier structure of global multinationals and regional Asian specialists.
Founded in 1895 and headquartered in Vernier, Switzerland, Givaudan SA is the world's largest flavour and fragrance company, with Asia Pacific contributing approximately 24% of global sales.
Firmenich SA, now part of dsm-firmenich following the 2023 DSM merger, is a leading flavour and fragrance company combining food flavours, functional fragrances, and prestige fine fragrance capabilities with nutritional and health ingredients.
Founded in 1833 and headquartered in New York, IFF anchors its Asia Pacific presence on its Singapore Innovation Center and China operations.
Founded in 2003 and headquartered in Holzminden, Germany, Symrise AG serves food, beverage, cosmetics, and fragrance customers across China, Japan, India, ASEAN, and Australia.
Other leading companies in the market are Wild Flavors Inc., Takasago International Corp, Guangzhou Baihua Flavours and Fragrances Company Ltd, Guangdong ADD Flavor and Fragrance Co.
*Please note that this is only a partial list; the complete list of key players is available in the full report. Additionally, the list of key players can be customized to better suit your needs.*
Explore comprehensive intelligence on the Asia Pacific flavours and fragrances industry from 2026 with our market research report.
Upto 15% Off
USD
$2499 $2249
$3999 $3599
$4999 $4249
$5999 $5099


*While we strive to always give you current and accurate information, the numbers depicted on the website are indicative and may differ from the actual numbers in the main report. At Expert Market Research, we aim to bring you the latest insights and trends in the market. Using our analyses and forecasts, stakeholders can understand the market dynamics, navigate challenges, and capitalize on opportunities to make data-driven strategic decisions.*
In 2025, the Asia Pacific flavours and fragrances market reached an approximate value of USD 9.39 Billion.
The market is assessed to grow at a CAGR of 5.00% between 2026 and 2035.
The major drivers of the industry include rising disposable incomes, increasing population, rising middle class, and the rising demand from the food and cosmetics market.
The rising demand for natural and organic ingredients is expected to be a key trend guiding the growth of the industry.
China, Japan, and India, among others, are the leading regions in the market, with China accounting for the largest market share.
The major flavouring agents in the industry include nature identical flavouring substance, artificial flavouring substance, and natural flavour.
The leading fragrance types available in the market include synthetic and natural.
The significant flavour forms in the industry are liquid and dry.
The major natural fragrances types in the market are flowers, fruit, musk, wood, and spice, among others.
Flavours find wide applications in beverage, dairy and frozen desserts, savouries and snacks, and bakery and confectionery products, among others. Fragrances have applications in soap and detergents, cosmetics and toiletries, fine fragrances, household cleaners and air fresheners, and others.
The leading players in the market are Givaudan SA, Firmenich SA, International Flavors & Fragrances, Inc., Symrise AG, Wild Flavors, Inc., Takasago International Corp, Guangzhou Baihua Flavours and Fragrances Company Ltd, Guangdong ADD Flavor & Fragrance Co., Ltd., Guangdong Wincom Flavors & Fragrances Co., Ltd., T. Hasegawa Co., Ltd., AARAV Fragrances & Flavors Pvt. Ltd, Snowco Industrial Co., Ltd, Others.
The market is estimated to witness healthy growth in the forecast period of 2026-2035 to reach a value of around USD 15.30 Billion by 2035.
Explore our key highlights of the report and gain a concise overview of key findings, trends, and actionable insights that will empower your strategic decisions.
| REPORT FEATURES | DETAILS |
| Base Year | 2025 |
| Historical Period | 2019-2025 |
| Forecast Period | 2026-2035 |
| Scope of the Report |
Historical and Forecast Trends, Industry Drivers and Constraints, Historical and Forecast Market Analysis by Segment:
|
| Breakup by Flavours Product Types |
|
| Breakup by Flavours Form |
|
| Breakup by Flavours Applications |
|
| Breakup by Flavours Region |
|
| Breakup by Fragrances Ingredients |
|
| Breakup by Natural Fragrance Types |
|
| Breakup by Fragrances Applications |
|
| Breakup by Fragrances Region |
|
| Market Dynamics |
|
| Competitive Landscape |
|
| Companies Covered |
|
| Report Price and Purchase Option | Explore our purchase options that are best suited to your resources and industry needs. |
| Delivery Format | Delivered as an attached PDF and Excel through email, with an option of receiving an editable PPT, according to the purchase option. |
Datasheet
One User
USD 2,499
USD 2,249
tax inclusive*
Single User License
One User
USD 3,999
USD 3,599
tax inclusive*
Five User License
Five User
USD 4,999
USD 4,249
tax inclusive*
Corporate License
Unlimited Users
USD 5,999
USD 5,099
tax inclusive*
*Please note that the prices mentioned below are starting prices for each bundle type. Kindly contact our team for further details.*
Flash Bundle
Small Business Bundle
Growth Bundle
Enterprise Bundle
*Please note that the prices mentioned below are starting prices for each bundle type. Kindly contact our team for further details.*
Flash Bundle
Number of Reports: 3
20%
tax inclusive*
Small Business Bundle
Number of Reports: 5
25%
tax inclusive*
Growth Bundle
Number of Reports: 8
30%
tax inclusive*
Enterprise Bundle
Number of Reports: 10
35%
tax inclusive*
How To Order

Select License Type
Choose the right license for your needs and access rights.

Click on ‘Buy Now’
Add the report to your cart with one click and proceed to register.

Select Mode of Payment
Choose a payment option for a secure checkout. You will be redirected accordingly.
Strategic Solutions for Informed Decision-Making
Gain insights to stay ahead and seize opportunities.

Get insights & trends for a competitive edge.

Track prices with detailed trend reports.

Analyse trade data for supply chain insights.

Leverage cost reports for smart savings

Enhance supply chain with partnerships.

Connect For More Information
Our expert team of analysts will offer full support and resolve any queries regarding the report, before and after the purchase.
Our expert team of analysts will offer full support and resolve any queries regarding the report, before and after the purchase.
We employ meticulous research methods, blending advanced analytics and expert insights to deliver accurate, actionable industry intelligence, staying ahead of competitors.
Our skilled analysts offer unparalleled competitive advantage with detailed insights on current and emerging markets, ensuring your strategic edge.
We offer an in-depth yet simplified presentation of industry insights and analysis to meet your specific requirements effectively.


