

Consumer Insights
Uncover trends and behaviors shaping consumer choices today
Procurement Insights
Optimize your sourcing strategy with key market data
Industry Stats
Stay ahead with the latest trends and market analysis.
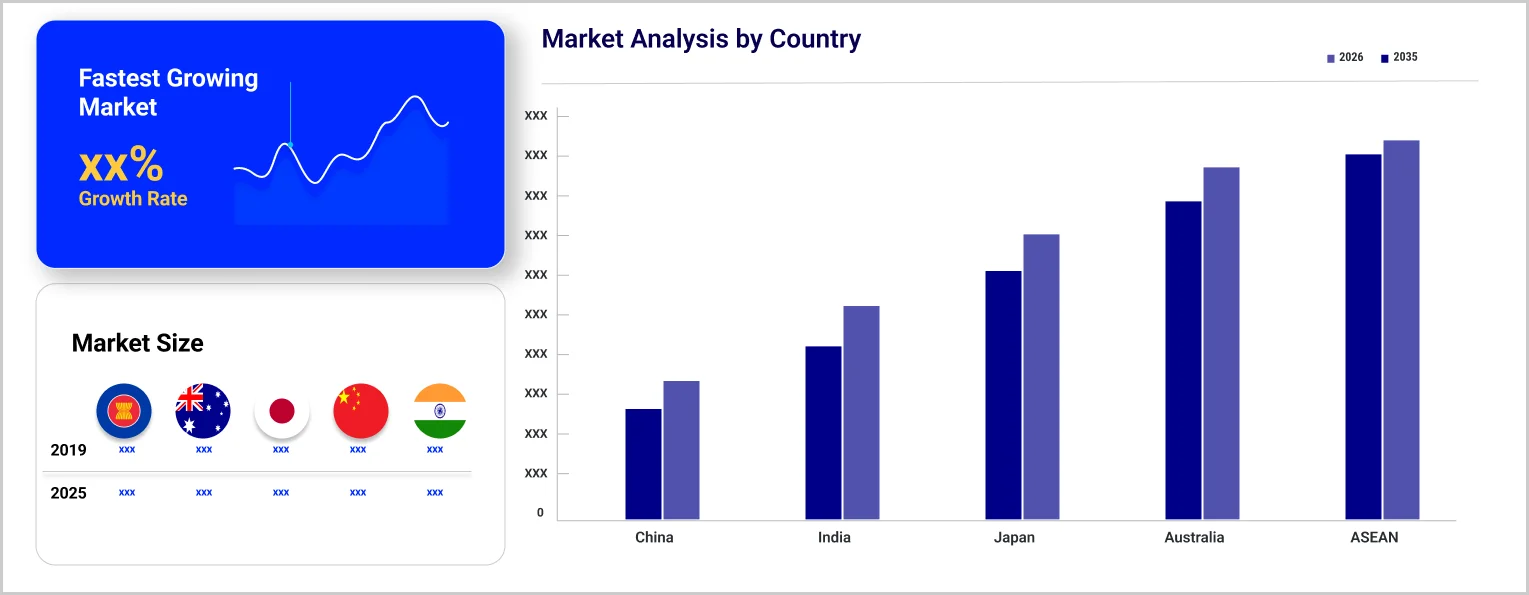
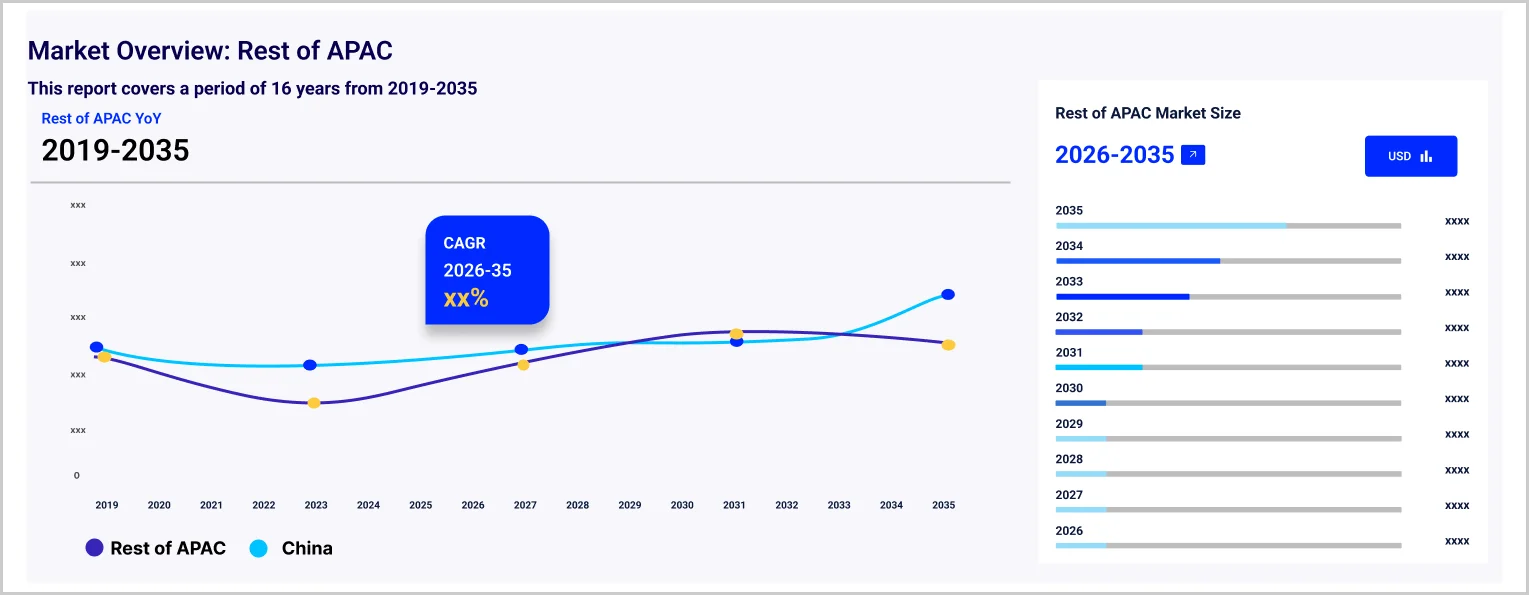
The Asia Pacific ice cream market reached around USD 40.58 Billion in 2025. The market is projected to grow at a CAGR of 6.40% between 2026 and 2035, reaching almost USD 75.46 Billion by 2035.
Coffee, alcohol, and tea flavoured ice creams appeal to high-end consumers and are expected to become popular in the coming years.
Bite-sized ice cream products dipped in chocolate are expected to witness a surge in demand in the coming years.
Indonesia is expected to become one of the key regions for ice creams.
Compound Annual Growth Rate
6.4%
Value in USD Billion
2026-2035
Technological advancements are expected to transform sales of ice creams across the Asia Pacific. In India, major telecom giants like Vi are building intelligent supply chains that enable dairy companies to track the location and temperature of their vendor carts and provide a predictive analysis of the most suitable routes ice cream vendors can take for maximising their revenue. Thus, the integration of IoT into carts is expected to drive the market growth in the forecast period.
Swiggy, an online convenience goods delivery platform in India, reported a 16% year-on-year increase in the demand for ice creams, with Mumbai emerging as the key region from March 1 to April 15, 2024. Chocolate and mango were the most popular flavours, apart from others like tender coconut, almond, and vanilla. The demand for vegan and guilt-free options recorded a year-on-year growth of 70%, while the popularity of ice cream tubs surged by 25% y-o-y in 2024.
Major quick service restaurants are partnering with multinational ice cream manufacturers to maximise their revenues while also ensuring a delicious eating experience for consumers. For instance, Pizza Hut partnered with HUL’s Kwality Walls ice cream brand in 2021 to offer desserts and ice creams across its chains and platforms.
One of the key market trends is the high consumer appeal for cones featuring two delicious flavours (such as marmalade or caramel) swirled high together. Flavours such as choco chips and candy toppings enhance the visual appeal of these products and excite consumer’s curiosity for trying a new flavour.
"Asia Pacific Ice Cream Market Report and Forecast 2026-2035" offers a detailed analysis of the market based on the following segments:
Market Breakup by Flavour
Market Breakup by Category
Market Breakup by Product Type
Market Breakup by End Use
Market Breakup by Distribution Channel
Market Breakup by Region
Based on distribution channel, the market is divided into hypermarkets/supermarkets, HoReCa, convenience stores, and online channel, among others. Over the forecast period, online channels are expected to emerge as the leading market segment, with increasing smartphone penetration and internet accessibility rates supporting the proliferation of e-commerce platforms.
Key players are adopting innovative equipment and machinery to drive product innovations, quality control, and production efficiency.
With growing health-consciousness and the rising prevalence of health issues such as diabetes, key players are introducing healthy and calorie-conscious ice cream that contains high dietary fibres.
Upto 15% Off
USD
$2499 $2249
$3999 $3599
$4999 $4249
$5999 $5099


*While we strive to always give you current and accurate information, the numbers depicted on the website are indicative and may differ from the actual numbers in the main report. At Expert Market Research, we aim to bring you the latest insights and trends in the market. Using our analyses and forecasts, stakeholders can understand the market dynamics, navigate challenges, and capitalize on opportunities to make data-driven strategic decisions.*
The market reached nearly USD 40.58 Billion in 2025.
The market is projected to grow at a CAGR of 6.40% between 2026 and 2035.
The market is assessed to witness a healthy growth in the forecast period to reach around USD 75.46 Billion in 2035.
The different ice cream flavours in the market include chocolate, fruit, and vanilla, among others.
The different categories of ice creams in the market include impulse ice-cream, take-home ice-cream, and artisanal ice-cream.
The different product types in the market include cup, stick, cone, brick, and tub, among others.
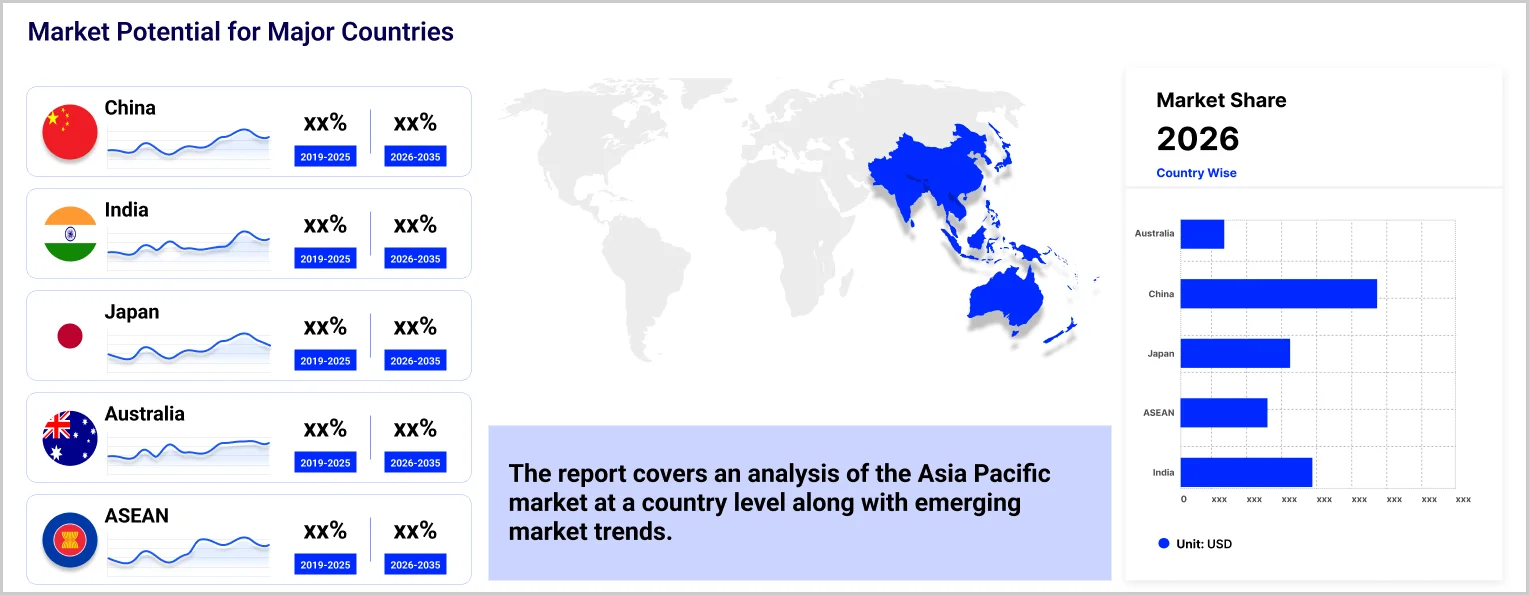
The different regions covered in the market report are China, Japan, India, ASEAN, and Australia, among others.
The key market players are Gujarat Co-operative Milk Marketing Federation Ltd., Unilever plc, General Mills Inc., Australasian Food Group Pty Limited, Regal Cream Products Pty Ltd., Supatreats Australia Pty. Ltd., Invidia Foods, Mother Dairy Fruit & Vegetable Pvt Ltd., Vadilal Group, and Havmor Ice Cream Pvt Ltd., among others.
Explore our key highlights of the report and gain a concise overview of key findings, trends, and actionable insights that will empower your strategic decisions.
| REPORT FEATURES | DETAILS |
| Base Year | 2025 |
| Historical Period | 2019-2025 |
| Forecast Period | 2026-2035 |
| Scope of the Report |
Historical and Forecast Trends, Industry Drivers and Constraints, Historical and Forecast Market Analysis by Segment:
|
| Breakup by Flavour |
|
| Breakup by Category |
|
| Breakup by Product Type |
|
| Breakup by End Use |
|
| Breakup by Distribution Channel |
|
| Breakup by Region |
|
| Market Dynamics |
|
| Competitive Landscape |
|
| Companies Covered |
|
Datasheet
One User
USD 2,499
USD 2,249
tax inclusive*
Single User License
One User
USD 3,999
USD 3,599
tax inclusive*
Five User License
Five User
USD 4,999
USD 4,249
tax inclusive*
Corporate License
Unlimited Users
USD 5,999
USD 5,099
tax inclusive*
*Please note that the prices mentioned below are starting prices for each bundle type. Kindly contact our team for further details.*
Flash Bundle
Small Business Bundle
Growth Bundle
Enterprise Bundle
*Please note that the prices mentioned below are starting prices for each bundle type. Kindly contact our team for further details.*
Flash Bundle
Number of Reports: 3
20%
tax inclusive*
Small Business Bundle
Number of Reports: 5
25%
tax inclusive*
Growth Bundle
Number of Reports: 8
30%
tax inclusive*
Enterprise Bundle
Number of Reports: 10
35%
tax inclusive*
How To Order

Select License Type
Choose the right license for your needs and access rights.

Click on ‘Buy Now’
Add the report to your cart with one click and proceed to register.

Select Mode of Payment
Choose a payment option for a secure checkout. You will be redirected accordingly.
Strategic Solutions for Informed Decision-Making
Gain insights to stay ahead and seize opportunities.

Get insights & trends for a competitive edge.

Track prices with detailed trend reports.

Analyse trade data for supply chain insights.

Leverage cost reports for smart savings

Enhance supply chain with partnerships.

Connect For More Information
Our expert team of analysts will offer full support and resolve any queries regarding the report, before and after the purchase.
Our expert team of analysts will offer full support and resolve any queries regarding the report, before and after the purchase.
We employ meticulous research methods, blending advanced analytics and expert insights to deliver accurate, actionable industry intelligence, staying ahead of competitors.
Our skilled analysts offer unparalleled competitive advantage with detailed insights on current and emerging markets, ensuring your strategic edge.
We offer an in-depth yet simplified presentation of industry insights and analysis to meet your specific requirements effectively.


