

Consumer Insights
Uncover trends and behaviors shaping consumer choices today
Procurement Insights
Optimize your sourcing strategy with key market data
Industry Stats
Stay ahead with the latest trends and market analysis.
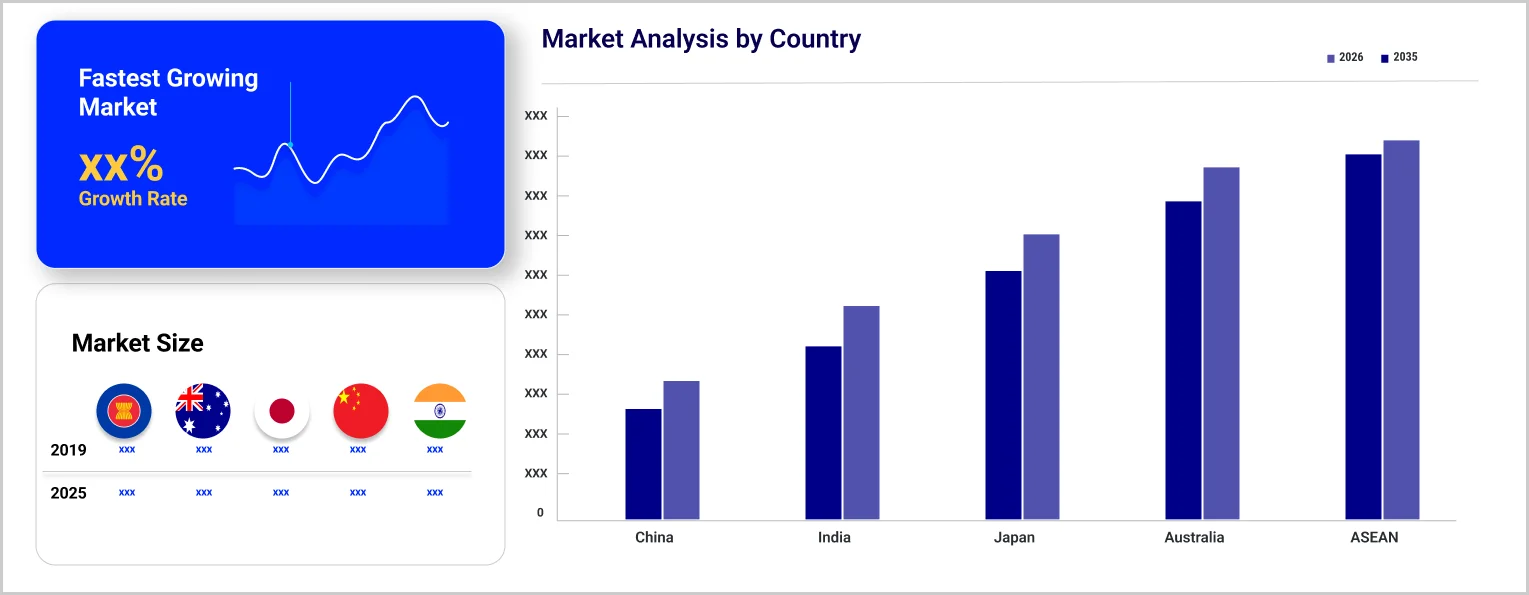
The Asia Pacific occupancy sensor market size is projected to grow at a CAGR of 14.30% between 2026 and 2035. The growing focus on enhancing the energy efficiency of residential and commercial buildings is aiding the market expansion.
Wireless occupancy sensors are expected to constitute a major portion of the Asia Pacific occupancy sensor market share.
Increasing demand for energy efficient buildings is one of the key drivers of the market growth.
Increasing adoption of occupancy sensors in commercial buildings is expected to fuel the market growth.
Compound Annual Growth Rate
14.3%
2026-2035
Increasing demand for energy-efficient buildings is expected to accelerate the Asia Pacific occupancy sensor market development. This is because occupancy sensors can automatically shut off lights and other electronic devices in a building when they remain unused, leading to substantial savings on electricity bills.
Amidst soaring prices of energy, the popularity of smart houses with high energy saving potential is increasing. This is anticipated to surge the demand for smart occupancy sensors as they can reduce the usage of energy in HVAC and lighting systems.
The rise of remote work culture has significantly reshaped the commercial spaces that exist across major regions in the Asia Pacific. An increasing number of organisations are integrating occupancy sensors into their workplaces to enable people to better maintain and manage their most frequently used spaces. This includes working cabins, boardrooms, and conference rooms, among others. This has emerged as one of the key Asia Pacific occupancy sensor market trends.
The application of occupancy sensors in HVAC systems is expected to gain significant prominence in the region because of weather extremities and the rising adoption of heating and cooling systems among households amid rising disposable incomes. This is expected to propel the Asia Pacific occupancy sensor market growth in the forecast period.
"Asia Pacific Occupancy Sensor Market Report and Forecast 2026-2035" offers a detailed analysis of the market based on the following segments:
Market Breakup by Network Connectivity
Market Breakup by Technology
Market Breakup by Operation
Market Breakup by Building Type
Market Breakup by Application
Market Breakup by Region
The key Asia Pacific occupancy sensor market players are:
Upto 15% Off
USD
$2499 $2249
$3999 $3599
$4999 $4249
$5999 $5099


*While we strive to always give you current and accurate information, the numbers depicted on the website are indicative and may differ from the actual numbers in the main report. At Expert Market Research, we aim to bring you the latest insights and trends in the market. Using our analyses and forecasts, stakeholders can understand the market dynamics, navigate challenges, and capitalize on opportunities to make data-driven strategic decisions.*
The market is projected to grow at a CAGR of 14.30% between 2026 and 2035.
The different network connectivity in the market include wired and wireless.
The different technologies in the market include ultrasonic, passive infrared, and microwave.
The different occupancy sensor operations considered in the market report are indoor and outdoor.
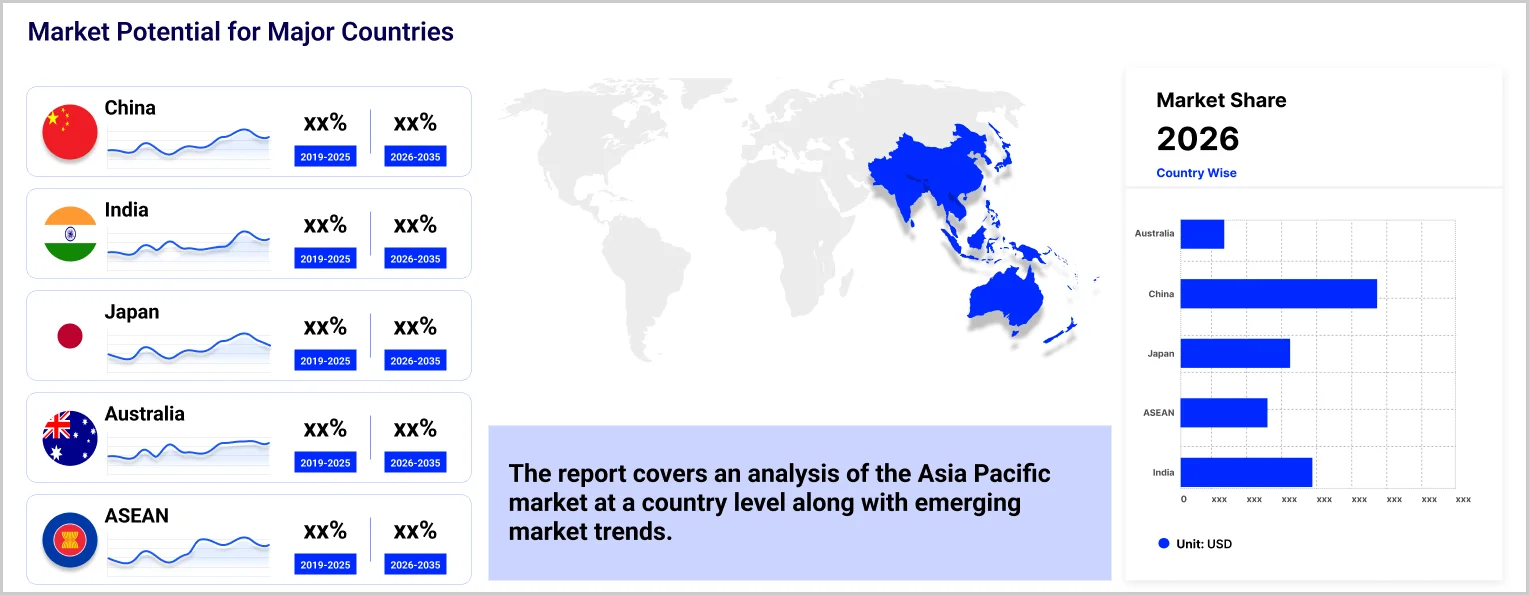
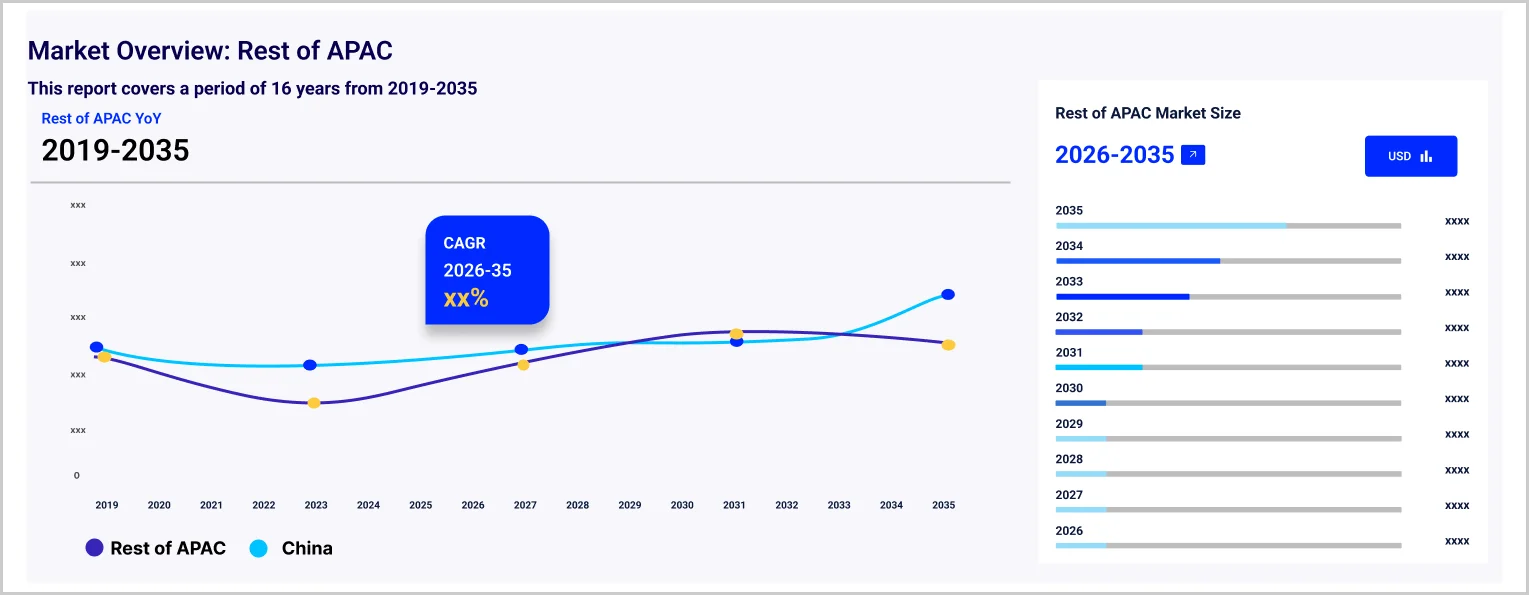
The major regions in the market include China, Japan, India, ASEAN, and Australia, among others.
The key market players are Schneider Electric SE, Eaton Corp. Plc, Honeywell International Inc., Johnson Controls International Plc, Lutron Electronics Co., Inc., Texas Instruments Incorporated, Analog Devices, Inc., Legrand S.A., Dwyer Instruments, LLC, and Signify N.V., among others.
Explore our key highlights of the report and gain a concise overview of key findings, trends, and actionable insights that will empower your strategic decisions.
| REPORT FEATURES | DETAILS |
| Base Year | 2025 |
| Historical Period | 2019-2025 |
| Forecast Period | 2026-2035 |
| Scope of the Report |
Historical and Forecast Trends, Industry Drivers and Constraints, Historical and Forecast Market Analysis by Segment:
|
| Breakup by Network Connectivity |
|
| Breakup by Technology |
|
| Breakup by Operation |
|
| Breakup by Building Type |
|
| Breakup by Application |
|
| Breakup by Region |
|
| Market Dynamics |
|
| Competitive Landscape |
|
| Companies Covered |
|
Datasheet
One User
USD 2,499
USD 2,249
tax inclusive*
Single User License
One User
USD 3,999
USD 3,599
tax inclusive*
Five User License
Five User
USD 4,999
USD 4,249
tax inclusive*
Corporate License
Unlimited Users
USD 5,999
USD 5,099
tax inclusive*
*Please note that the prices mentioned below are starting prices for each bundle type. Kindly contact our team for further details.*
Flash Bundle
Small Business Bundle
Growth Bundle
Enterprise Bundle
*Please note that the prices mentioned below are starting prices for each bundle type. Kindly contact our team for further details.*
Flash Bundle
Number of Reports: 3
20%
tax inclusive*
Small Business Bundle
Number of Reports: 5
25%
tax inclusive*
Growth Bundle
Number of Reports: 8
30%
tax inclusive*
Enterprise Bundle
Number of Reports: 10
35%
tax inclusive*
How To Order

Select License Type
Choose the right license for your needs and access rights.

Click on ‘Buy Now’
Add the report to your cart with one click and proceed to register.

Select Mode of Payment
Choose a payment option for a secure checkout. You will be redirected accordingly.
Strategic Solutions for Informed Decision-Making
Gain insights to stay ahead and seize opportunities.

Get insights & trends for a competitive edge.

Track prices with detailed trend reports.

Analyse trade data for supply chain insights.

Leverage cost reports for smart savings

Enhance supply chain with partnerships.

Connect For More Information
Our expert team of analysts will offer full support and resolve any queries regarding the report, before and after the purchase.
Our expert team of analysts will offer full support and resolve any queries regarding the report, before and after the purchase.
We employ meticulous research methods, blending advanced analytics and expert insights to deliver accurate, actionable industry intelligence, staying ahead of competitors.
Our skilled analysts offer unparalleled competitive advantage with detailed insights on current and emerging markets, ensuring your strategic edge.
We offer an in-depth yet simplified presentation of industry insights and analysis to meet your specific requirements effectively.


