

Consumer Insights
Uncover trends and behaviors shaping consumer choices today
Procurement Insights
Optimize your sourcing strategy with key market data
Industry Stats
Stay ahead with the latest trends and market analysis.
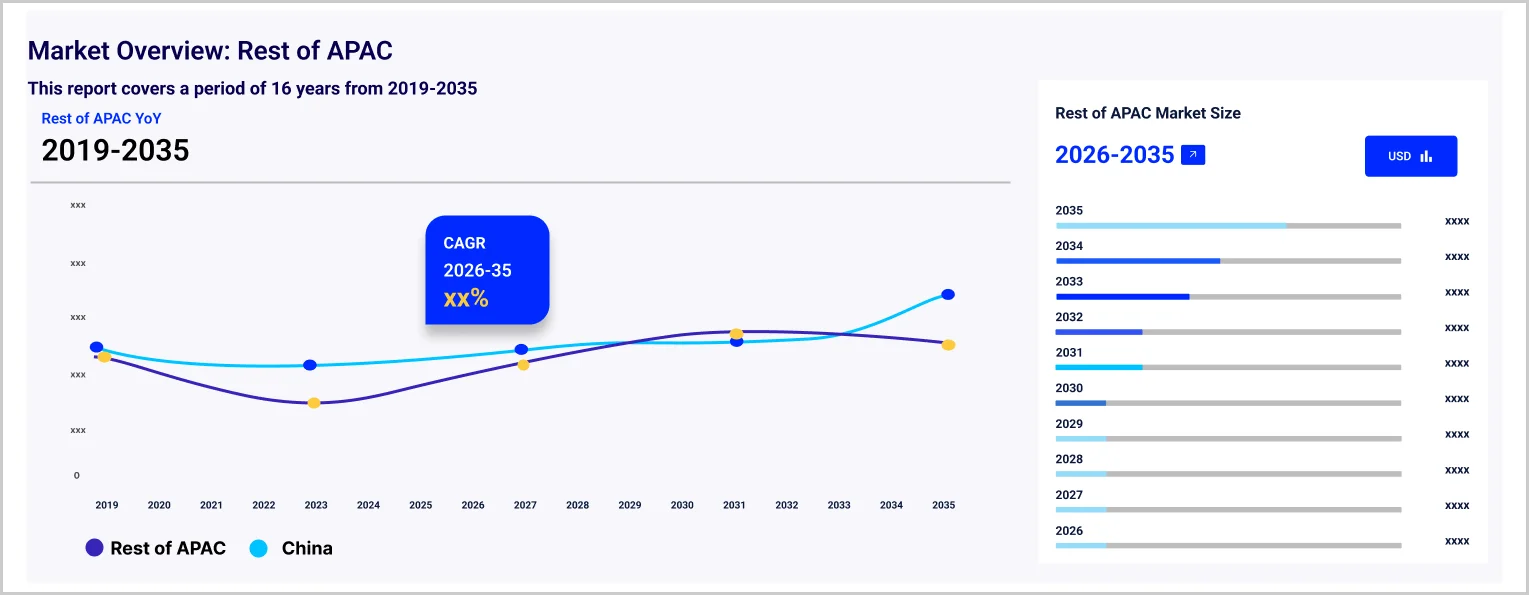
The Asia Pacific polylactic acid (PLA) market is projected to grow at a CAGR of 15.20% between 2026 and 2035.
PLA is the most commercially viable biodegradable and bio-based polymer.
As the single-use plastic ban is spreading across the region, the use of polylactic acid is expected to rise in the packaging sector.
As per the industry reports, 15% of Japanese household spending is spent on food and beverage products, aiding the demand for packaging for these products.
Compound Annual Growth Rate
15.2%
2026-2035
The surge in plastic pollution in Southeast Asia is compelling governments across the region to implement policies to reduce plastic waste and promote sustainable packaging solutions. For instance, Thailand through its Roadmap on Plastic Waste Management aims to achieve 100% recycling of waste by 2027. Environmental concerns are a crucial driver for the implementation of bioplastics and aid the Asia Pacific polylactic acid (PLA) market development. The rise in consumption of convenience foods also drives the demand for safe food packaging. PLA is approved by the Food and Drug Administration (FDA) for use as a food contact material. The common packaging applications of PLAs include containers, drinking cups, overwraps, and blister packages.
As per the Asia Pacific polylactic acid (PLA) market report, the raw materials for polylactic acid production, such as sugarcane and corn are widely available in the region, which provides the ease to start a PLA production unit. For instance, India on average annually produces around 35.5 crore tons of sugarcane. The sugarcane and sugar market is the country’s second-largest agro-based sector.
The biomedical sector is also flourishing in the region owing to the presence of a large number of pharmaceutical and medical technology firms. Government policies are aiding the growth of the healthcare sector. For instance, The Healthy China 2030 initiative is focused on expanding the size of the nation’s health service industry to around USD 2.4 trillion by 2030. An evolving healthcare technology ecosystem in India is positioning it as a new hub of healthcare services. The biocompatibility and biodegradability of PLA allows its use in the healthcare sector to manufacture tissue engineering scaffolds, bioabsorbable medical implants, and delivery system materials.
"Asia Pacific Polylactic Acid (PLA) Market Report and Forecast 2026-2035" offers a detailed analysis of the market based on the following segments:
Market Breakup by Raw Material
Market Breakup by Grade
Market Breakup by Application
Market Breakup by End Use
Market Breakup by Country
The key players in the polylactic acid (PLA) market in Asia Pacific are researching to produce high-quality polylactic acid (PLA) products to meet the needs of end-user markets.
Upto 15% Off
USD
$2499 $2249
$3999 $3599
$4999 $4249
$5999 $5099


*While we strive to always give you current and accurate information, the numbers depicted on the website are indicative and may differ from the actual numbers in the main report. At Expert Market Research, we aim to bring you the latest insights and trends in the market. Using our analyses and forecasts, stakeholders can understand the market dynamics, navigate challenges, and capitalize on opportunities to make data-driven strategic decisions.*
The market is expected to grow at a CAGR of 15.20% between 2026 and 2035.
Since PLA is derived from plant material such as corn or sugar cane, it reduces the demand for fossil fuels used to make conventional plastics. Additionally, it is recyclable, biodegradable, and compostable.
Polylactic Acid (PLA) is considered non-allergenic. It is a polyester made from renewable biomass, including fermented plant starch, such as corn, sugarcane, or cassava.
The major drivers of the market include rising plastic pollution, a growing need for sustainable packaging materials, and a wide availability of raw materials.
Key trends aiding market expansion include growing awareness of environmental pollution, research in raw materials for producing bioplastics, and governmental focus on enhancing the use of bioplastics.
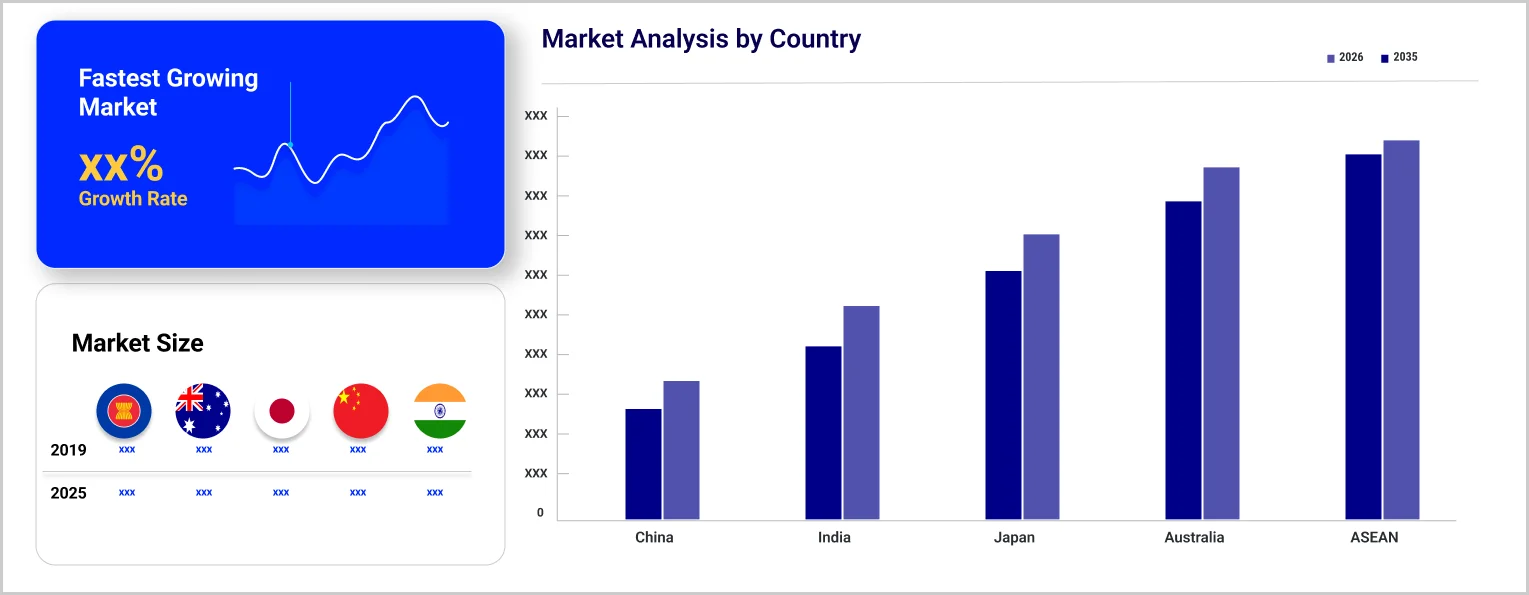
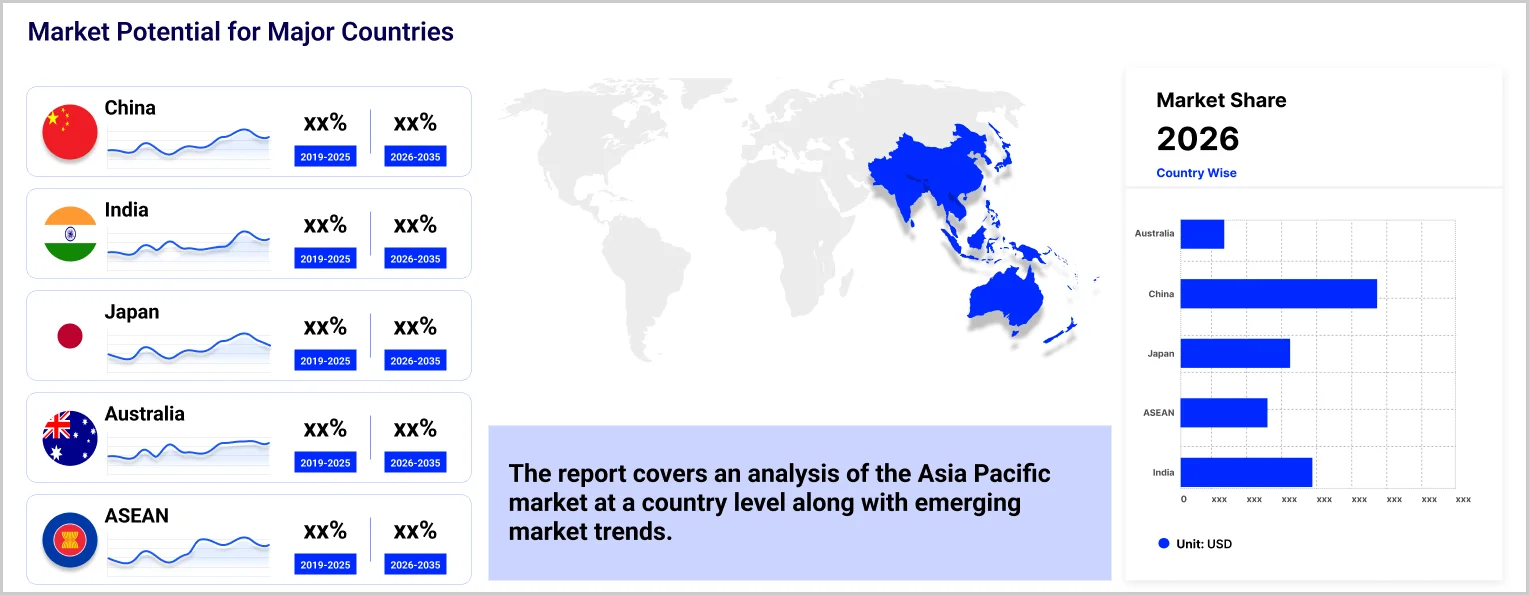
Major countries in the market are China, Japan, India, ASEAN, Australia, and others.
The raw materials of polylactic acid (PLA) are sugarcane, corn, cassava, sugar beet, and others.
Key players in the market are Unitika Ltd, Jiangxi Keyuan Bio-Material Co., Ltd., Jilin COFCO Biomaterial Co., Ltd, NatureWorks LLC, TotalEnergies SE, FUTERRO S.A., BASF SE, Fujian Greenjoy Biomaterial Co., Ltd., China BBCA Group, and others.
Explore our key highlights of the report and gain a concise overview of key findings, trends, and actionable insights that will empower your strategic decisions.
| REPORT FEATURES | DETAILS |
| Base Year | 2025 |
| Historical Period | 2019-2025 |
| Forecast Period | 2026-2035 |
| Scope of the Report |
Historical and Forecast Trends, Industry Drivers and Constraints, Historical and Forecast Market Analysis by Segment:
|
| Breakup by Raw Material |
|
| Breakup by Grade |
|
| Breakup by Application |
|
| Breakup by End Use |
|
| Breakup by Region |
|
| Market Dynamics |
|
| Competitive Landscape |
|
| Companies Covered |
|
Datasheet
One User
USD 2,499
USD 2,249
tax inclusive*
Single User License
One User
USD 3,999
USD 3,599
tax inclusive*
Five User License
Five User
USD 4,999
USD 4,249
tax inclusive*
Corporate License
Unlimited Users
USD 5,999
USD 5,099
tax inclusive*
*Please note that the prices mentioned below are starting prices for each bundle type. Kindly contact our team for further details.*
Flash Bundle
Small Business Bundle
Growth Bundle
Enterprise Bundle
*Please note that the prices mentioned below are starting prices for each bundle type. Kindly contact our team for further details.*
Flash Bundle
Number of Reports: 3
20%
tax inclusive*
Small Business Bundle
Number of Reports: 5
25%
tax inclusive*
Growth Bundle
Number of Reports: 8
30%
tax inclusive*
Enterprise Bundle
Number of Reports: 10
35%
tax inclusive*
How To Order

Select License Type
Choose the right license for your needs and access rights.

Click on ‘Buy Now’
Add the report to your cart with one click and proceed to register.

Select Mode of Payment
Choose a payment option for a secure checkout. You will be redirected accordingly.
Strategic Solutions for Informed Decision-Making
Gain insights to stay ahead and seize opportunities.

Get insights & trends for a competitive edge.

Track prices with detailed trend reports.

Analyse trade data for supply chain insights.

Leverage cost reports for smart savings

Enhance supply chain with partnerships.

Connect For More Information
Our expert team of analysts will offer full support and resolve any queries regarding the report, before and after the purchase.
Our expert team of analysts will offer full support and resolve any queries regarding the report, before and after the purchase.
We employ meticulous research methods, blending advanced analytics and expert insights to deliver accurate, actionable industry intelligence, staying ahead of competitors.
Our skilled analysts offer unparalleled competitive advantage with detailed insights on current and emerging markets, ensuring your strategic edge.
We offer an in-depth yet simplified presentation of industry insights and analysis to meet your specific requirements effectively.


