

Consumer Insights
Uncover trends and behaviors shaping consumer choices today
Procurement Insights
Optimize your sourcing strategy with key market data
Industry Stats
Stay ahead with the latest trends and market analysis.
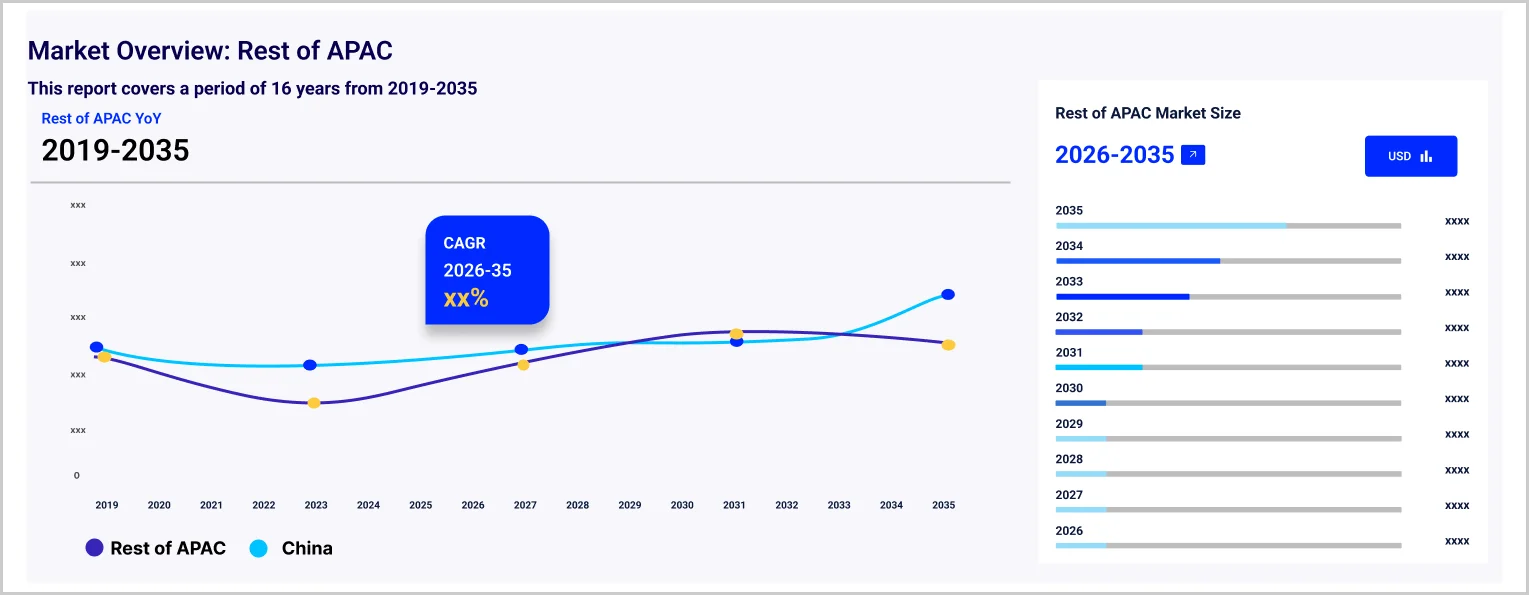
The Asia Pacific power rental market value reached around USD 3.49 Billion in 2025. The expansion of data centers and the rising costs associated with unplanned outages have increased the adoption of rental generator sets (gensets). Additionally, the ongoing infrastructural expansion across the region are prompting significant investments in power rental solutions. The increasing frequency of power failures, ageing grid infrastructure, and natural disasters are also contributing to the demand for temporary power solutions, particularly in construction and industrial applications where consistent energy supply is crucial. As a result, market is expected to grow at a CAGR of 4.50% during the forecast period of 2026-2035 to attain a value of USD 5.42 Billion by 2035.
With temperatures in Asian countries reaching over 40 degrees Celsius, there has been a marked increase in investment in backup power supplies to ensure reliable electricity during extreme heat events. For instance, India faced one of its most severe heatwaves in 2022, with temperatures soaring above 47°C (116°F), leading to a surge in power demand and consequently boosting the need for rental power solutions.
Additionally, favourable government initiatives in India, such as the "Make in India" campaign, are enhancing power rentals demand in Asia Pacific’s manufacturing sector as these industries seek reliable energy sources to support their operations.
As per industry reports, the explosive growth of data usage has led to a significant increase in the number of data centers, with China hosting 449 data centers in 2023 and this number expected to rise. This growth necessitates dependable power supply solutions, further driving the demand for rental generators.
Compound Annual Growth Rate
4.5%
Value in USD Billion
2026-2035
Power outages due to factors such as weather changes, grid issues, and maintenance can be observed in the Asia Pacific region, which has subsequently increased the demand for energy sources, such as power rentals. In February 2022, Japan's power utilities anticipated a reserve power supply capacity ratio of 5.8%, lower than the recommended 8%. The power supply deficit increased the demand for backup power, further increasing the adoption of power rentals. Furthermore, growth of the Asia Pacific power rental market is being driven by the expansion of the commercial spaces including malls, hotels, and retail stores, further necessitating the use of rentals at times of unexcepted power deficits.
Among type of power rentals, diesel generators are increasingly being adopted in countries such as India and China, due to the advances in the manufacturing sector and increasing demand for power in construction projects. In 2022, the construction sector in China witnessed a total output value of over 31 trillion yuan (USD 4.34 trillion). Diesel generators produce lesser greenhouse gas emissions, further increasing their demand and resulting in overall Asia Pacific power rental market expansion.
Furthermore, businesses adopting power rentals benefit from the absence of ownership costs, rapid and easy availability of generators for renting, lowered maintenance issues, almost zero downtime, and quick substitutions, among others. The rapid expansion of the manufacturing sector in countries such as Indonesia, China (PRC), Malaysia, and Thailand are significantly contributing to the market growth. As per industry reports, in Q1 2023, the manufacturing sector experienced a remarkable growth of 4.67% (y-on-y) in Indonesia.
India is projected to add 23 GW of solar power capacity in 2024, marking a 77% year-on-year increase, according to a report by Ember. This rising solar power capacity, driven by robust government policies, technological advancements, and rising demand for renewable energy, can drive growth in Asia Pacific power rental market. Key contributors to this capacity increase include 17 GW from utility-scale projects, 4 GW from rooftop installations, and 1.4 GW from off-grid systems. By September 2024, India had already added 13.2 GW of utility-scale solar, a 160.9% increase compared to the previous year. This surge in solar capacity will significantly impact the market for power rentals by creating opportunities for companies offering solar rental solutions and hybrid systems. As India advances its renewable energy goals, it not only strengthens its energy landscape but also plays a vital role in global efforts to combat climate change.
Rising temperature levels globally, surge in industrialisation and urbanisation, and growing demand from infrastructure projects are the key trends fuelling the market growth.
As per industry reports, India's power consumption is projected to reach 3,000 TWh by 2030, driven primarily by the growth of electric vehicles (EVs) and data centers. The EV market is expected to see significant expansion, with a target of 30% penetration on Indian roads by 2030, while data centers are anticipated to become one of the largest power consumers as digital infrastructure grows in future. Additionally, substantial investments in infrastructure projects will further boost domestic and industrial power rental demand growth in Asia Pacific and its countries.
Aggreko has launched two new mid-size, low-emission Battery Energy Storage Systems (BESS) in the Middle East, available in 250 kW and 500 kW configurations. These fully integrated, plug-and-play solutions aim to enhance energy efficiency and support the integration of renewable energy sources while reducing emissions. The launch aligns with Aggreko's commitment to providing innovative energy solutions in Asia Pacific power rental market.
India has awarded 12.8 GW of new thermal capacity in the first 100 days of the new government to meet rising energy or power demands, with a goal of adding 80 GW by 2032. This initiative is part of the National Electricity Plan aimed at addressing a projected peak demand of 458 GW by 2032. The plan also includes significant investments in expanding the transmission network and integrating renewable energy sources into the power grids.
According to the Ministry of New and Renewable Energy (MNRE), India achieved a significant milestone of installing 200 GW of non-fossil fuel-based power and solar power has driven the country's renewable target of 500 GW by 2030. Moreover, Asia Pacific power rental market statistics shows that non-fossil renewable installed power stood at 199.58 GW by the end of August 2024 in India, including renewable energy sources like small hydro, bio, solar, and wind at 152.6 GW.
Rapid industrialisation and urbanisation across the Asia Pacific region are creating a surge in power rental demand, particularly in regions with inadequate or unstable grid infrastructure. For instance, India's urban population is expected to reach 600 million by 2031, increasing electricity demand. Countries like Indonesia and Vietnam are also witnessing accelerated industrial growth, leading to frequent power shortages and grid instability. In response, power rental companies are stepping in to ensure uninterrupted operations. Companies such as Atlas Copco and APR Energy have been addressing peak demand challenges during industrial expansions, especially in Indonesia’s mining industry, where stable power supply is crucial. This trend in Asia Pacific power rental market is expected to grow in the forecast period.
The increased need for temporary power solutions in the Asia Pacific region is significantly driven by extensive infrastructure projects. Governments are heavily investing in construction activities, such as roads, bridges, and rail networks, which require reliable power sources to avoid project delays. The Indian government has allocated approximately USD 1.4 trillion for infrastructure development under the National Infrastructure Pipeline (NIP) until 2025. This investment is aimed at enhancing connectivity and includes projects like the Bharatmala and Sagarmala initiatives, which focus on road and port development, respectively. Similarly, China's Belt and Road project aims to enhance global trade routes and has seen substantial funding towards railways and highways, necessitating dependable power rents to support construction activities.
Power rentals are crucial for events that require continuous electricity for lighting, sound system, video projections, and other operations. Large-scale events such as the 2023 G20 Summit in India deployed extensive temporary power setups to support various functions, from lighting to audiovisual equipment. As per Asia Pacific power rental market analysis, weddings, music festivals, and large family gatherings can also benefit from generator rentals to ensure that music, lighting, and catering services run smoothly without the risk of outages disrupting the festivities.
Natural disasters significantly disrupt power supply, particularly for essential services such as hospitals and telecommunications. In the U.S., around 25% of unplanned electric grid outages are caused by extreme weather, resulting in annual losses estimated between USD 20 billion and USD 55 billion. For instance, after Hurricane Sandy and Hurricane Irma, restoring power required over 16,000 workers and incurred costs of approximately USD 1.3 billion. Effective solutions include rental generators, uninterruptible power supplies (UPS), and microgrids, which ensure continuity during outages. With climate change exacerbating the frequency of these disasters, investing in robust emergency power systems is vital for maintaining public safety and enhancing disaster response capabilities.
The booming infrastructure sectors in countries like China, India, and Southeast Asian nations, due to increasing government-led projects and urbanisation, are driving significant demand for power rental services. For example, India’s Smart Cities Mission and China’s Belt and Road Initiative (BRI) continue to push demand for reliable and temporary power solutions. Rental power offers flexibility and cost-efficiency, allowing construction firms to manage power needs without incurring high capital expenditures. Companies such as Aggreko have provided generators to large-scale projects like the Delhi Metro in India, underscoring the role of rental power in supporting infrastructure development.
The market offers vast opportunities, driven by industrial expansion and the increasing reliance on temporary power solutions. For example, Indonesia’s power demand is expected to grow by 7% annually through 2030 due to rapid industrialsiation, while Vietnam’s industrial output is rising at 9.7% per year, causing frequent power shortages. This creates significant Asia Pacific power rental market opportunities to support sectors like manufacturing, oil & gas, and mining.
Moreover, in disaster-prone regions like Japan and the Philippines, natural disasters disrupt power supply regularly. Philippines experiences an average of 20 typhoons annually. After Typhoon Haiyan, APR Energy provided 40 MW of rental power to the country, underscoring the market's need for emergency power solutions. Additionally, the booming data center industry, which is growing rapidly across Southeast Asia, particularly in Singapore and Malaysia, presents opportunities for rental companies to offer backup power solutions.
Several factors are acting as restraints in the market, including stringent environmental regulations, fluctuating fuel prices, and the growing adoption of renewable energy. Governments across the region, particularly in countries like Japan, Australia, and South Korea, are imposing stricter emissions standards to combat climate change. For instance, Japan has pledged to reduce carbon emissions by 46% by 2030, which makes diesel-powered rental generators less appealing due to their high emissions.
Additionally, volatile fuel prices, driven by global oil market fluctuations, can increase operational costs for rental power providers, squeezing profit margins and impacting power rental demand forecast in Asia Pacific. As per industry reports in India, diesel prices surged by 30% in 2022, leading to higher rental costs, discouraging companies from using traditional generator solutions. Furthermore, the increasing focus on renewable energy infrastructure, with China and India aiming for 33% and 40% renewable energy capacity by 2030, is reducing the demand for conventional rental power solutions, as businesses seek cleaner alternatives like solar and battery storage systems.
Rising heatwaves in India and the U.S. are influencing the market dynamics due to their impact on energy demand and grid reliability. As per industry reports, temperatures soared above 48°C (118°F) in northern and central parts of the India in summer of 2024, exacerbating an already high electricity demand. Moreover, in May 2024, India recorded a peak power demand of over 225 GW, surpassing the previous year’s all-time high. The heatwave led to frequent power outages in states like Uttar Pradesh, Rajasthan, and Maharashtra. As a result, industries, hospitals, and even commercial buildings turned to power rental services for emergency backup solutions, resulting in increased Asia Pacific power rental market revenue.
Similarly, the U.S. faced extreme heatwaves in 2023, especially in states like Texas and California, where temperatures exceeded 110°F (43°C) in several regions. These heatwaves caused a surge in electricity consumption for air conditioning and cooling systems, pushing the grid to its limits. In Texas, electricity demand reached 85 GW in July 2024, leading to emergency alerts and power shortages. Power rental companies like United Rentals and Sunbelt Rentals also saw a spike in demand as businesses scrambled for backup power during the heat-induced outages. Therefore, the increasing frequency of heatwaves is expected to continue driving demand for power rental services in regions vulnerable to extreme weather.
“Asia Pacific Power Rental Market Report and Forecast 2026-2035” offers a detailed analysis of the market based on the following segments:
Market Breakup by Fuel Type
Market Breakup by Rating
Market Breakup by Application
Market Breakup by End Use
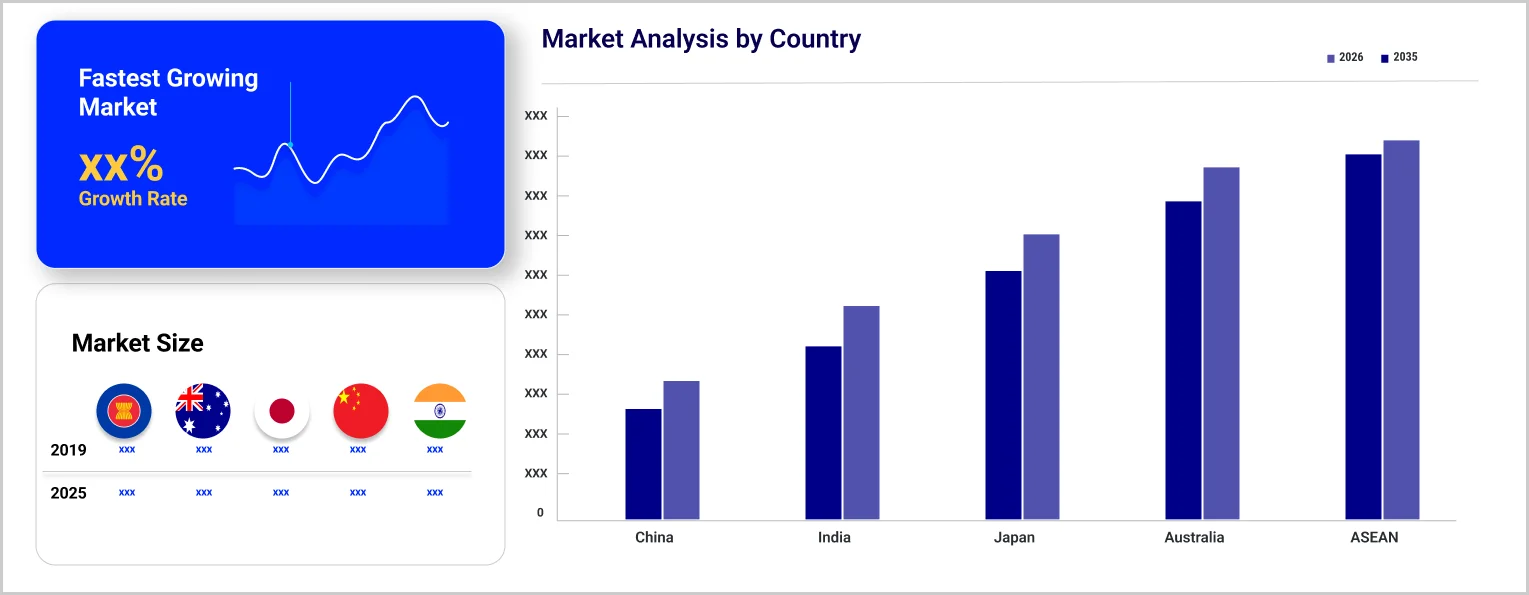
Market Breakup by Country
Market Analysis by Fuel Type
Diesel generators continue to dominate the market as Asia Pacific is a significant consumer of diesel, with India and China leading in diesel consumption. India alone produced around 500 million barrels of diesel in 2023 to meet both industrial, energy, and transportation demands. Moreover, diesel generators remain preferred in sectors like construction and mining due to their reliability, especially in countries where grid infrastructure is inconsistent. However, diesel prices have increased by over 30% in India during 2022, which has further driven a gradual shift toward cleaner alternatives.
As per Asia Pacific power rental market overview, the natural gas segment is also gaining momentum, particularly due to its lower emissions compared to diesel. Asia Pacific accounted for 40% of global natural gas consumption in 2023, with countries like Australia, Japan, and China being major producers. In addition, Australia produced 144 billion cubic meters of natural gas in 2023, This rising gas production is fuelling demand for gas-powered rental generators across industries.
However, the alternative fuel segment, which includes hybrid systems and renewable energy sources like solar and wind, is experiencing the fastest growth. In 2023, renewable energy capacity in the Asia Pacific region increased by 17%, with solar power leading the way. Moreover, China and India has a target of producing over 330 GW and 175 GW of solar energy by 2025. These numbers reflect a growing shift toward hybrid and renewable energy solutions in the Asia Pacific power rental market. Companies like Sunseap Group in Singapore are capitalising on this trend by offering solar-powered rental systems, especially for data centers and remote areas.
Market Analysis by Rating
Up to 50 kW segment caters to small-scale applications such as residential backup, small events, and minor construction sites. It accounts for a smaller portion of the overall market but is crucial for regions with frequent power outages. In 2023, demand for generators up to 50 kW grew by 5% in countries like India and the Philippines, where power outages due to infrastructure limitations are common. For instance, small businesses in rural India increasingly rent generators for temporary backup during frequent power cuts in peak summer months, resulting in higher rental market share in Asia Pacific.
The 51–500 kW segment, however, covers a wide range of industrial applications such as construction, mining, and mid-sized events. Countries like Indonesia, China, India, and Vietnam saw increased demand in this category due to their expanding industrial operations and infrastructure projects. For example, large-scale construction projects in Indonesia’s new capital city, Nusantara, have relied heavily on generators in the 100–300 kW range to manage power demands on-site.
Above 500 kW segment saw significant growth in countries like Australia and China, where large-scale mining and manufacturing operations have a need for high-power rental solutions. According to Asia Pacific power rental industry analysis, Australia’s mining sector, which contributed 11% of the country’s GDP, increasingly depends on generators above 500 kW for remote operations.
Market Analysis by Application
Peak shaving is gaining traction in the Asia Pacific region, particularly in countries with high industrial activity and fluctuating power demand. This application involves using rental generators during periods of peak demand to reduce the load on the primary power grid, helping companies avoid high electricity costs. For instance, in 2023, manufacturing plants in China and India increasingly used peak shaving solutions to manage energy consumption as power tariffs surged during peak hours. China’s industrial sector alone accounted for nearly 70% of electricity consumption in 2023, further boosting demand for peak shaving solutions in Asia Pacific power rental market.
The standby power segment caters to regions prone to power outages, such as India, the Philippines, and Indonesia. Standby generators provide temporary power during unexpected grid failures, ensuring continuous operations in sectors like healthcare, telecommunications, and data centers. Moreover, in 2023, India experienced over 400 power outages, driving significant demand for standby generators across commercial and residential sectors. As grid overloads become more common in Asian countries, Asia Pacific power rental market value is expected to increase.
Continuous power rental solutions are highly used in remote locations, mining sites, and large-scale infrastructure projects, where grid access is limited or non-existent. This segment is crucial in countries like Australia, where mining operations contributed 11% of the country’s GDP in 2023, requiring continuous power for remote and off-grid sites. Similarly, infrastructure projects under China's Belt and Road Initiative are heavily reliant on prime power solutions to smoothly run operations, driving Asia Pacific power rental market demand.
Market Analysis by End Use
The utilities sector is a major consumer of rental power services for grid stabilisation and emergency backup during peak demand periods and power shortfalls. In 2023, Vietnam experienced grid failures due to the rapid growth in electricity demand, leading the government to rely on rental power to support the grid. Similarly, Malaysia used rental generators during maintenance at power plants to avoid blackouts. Companies like APR Energy have provided emergency power to utilities across Southeast Asia, driving Asia Pacific power rental industry revenue.
The construction sector also drives significant demand for power rentals, particularly for infrastructure projects and remote site developments. In 2023, Thailand's Eastern Economic Corridor (EEC), a major infrastructure initiative, increased demand for rental power to supply construction sites far from the main grid. Similarly, Indonesia’s new capital city project, Nusantara, has seen heightened demand for rental power solutions offered by companies like Caterpillar Inc.
The oil and gas sector remains a major contributor to the Asia Pacific power rental market growth, particularly in production sites where grid access is limited. Countries like Indonesia are also heavy users of rental power for offshore rigs. Additionally, the events industry, including concerts, festivals, weddings, and large gatherings, heavily relies on rental power to ensure uninterrupted operations of lighting, sound, and staging. For example, in 2023, countries like Japan and Australia saw increased demand for rental generators to power large-scale public events, such as the 2023 Rugby World Cup in Japan.
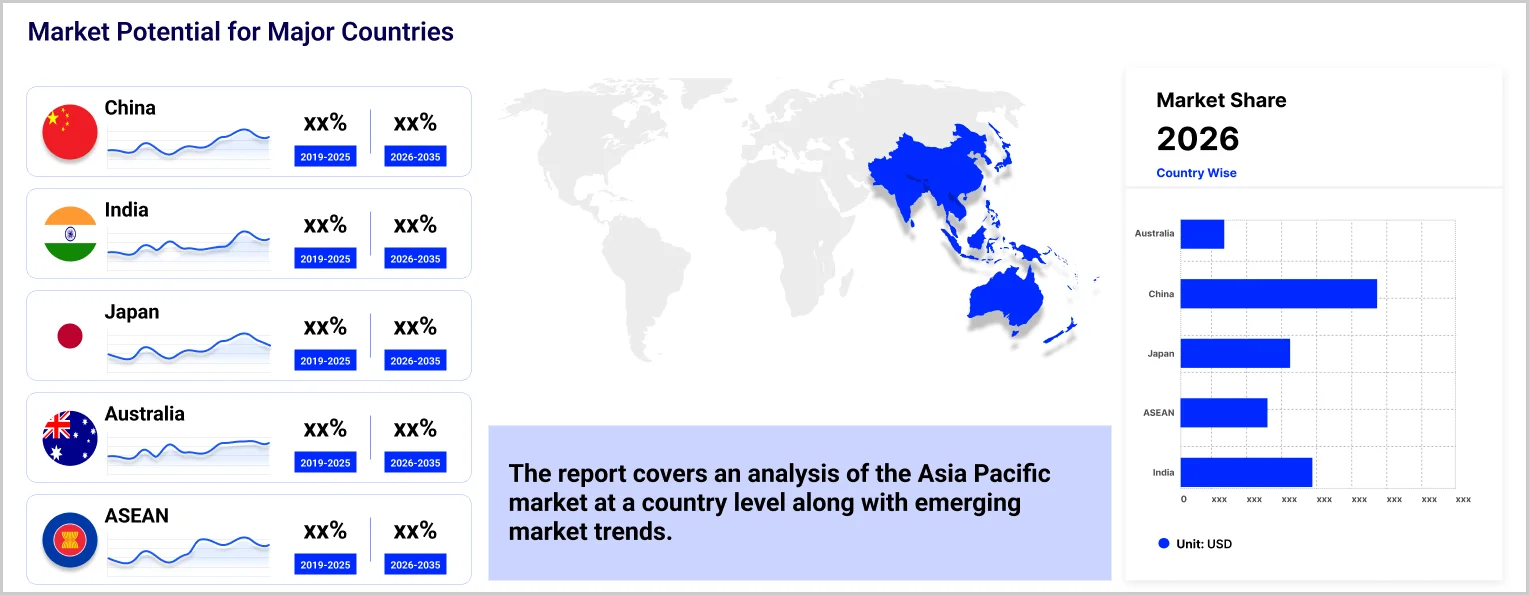
China is one of the largest markets for power rental services, driven by rapid industrialisation and infrastructure projects like the Belt and Road Initiative (BRI). The country’s manufacturing and construction sector has also created steady demand for rental power solutions. The government’s aim to achieve carbon neutrality by 2060 is further driving the adoption of cleaner rental power technologies, such as gas and hybrid generators. Thus, China’s growing focus on renewable energy is also influencing the Asia Pacific power rental market landscape.
Japan’s power rental market is influenced by the country’s ageing infrastructure, frequent natural disasters, and stringent environmental regulations. After the 2011 Fukushima disaster, Japan has been cautious about power reliability, especially in the wake of earthquakes and typhoons. In 2023, typhoon season once again disrupted power grids, leading to increased demand for standby rental power solutions in sectors like healthcare and critical infrastructure. As per Asia Pacific power rental market report, Japan is targeting a 46% reduction in carbon emissions by 2030, which has also hastened the shift towards gas and renewable energy-based rental solutions.
India’s power rental market is growing at the fastest rate, driven by frequent power outages and infrastructure development. In 2024, India faced severe heatwaves that pushed peak power demand to 225 GW, leading to widespread power shortages. This spurred a surge in demand for standby and peak shaving rental solutions across industries, especially in manufacturing, construction, and mining. Major cities like Delhi and Mumbai also rely on rental power solutions during summer months when grid demand is high. Furthermore, the government's focus on renewable energy, aiming to achieve 175 GW of renewable capacity by 2025, is influencing Asia Pacific power rental market dynamics and trends.
Australia’s power rental market is largely driven by its remote mining operations and harsh climatic conditions. The country’s mining sector, which contributed 11% to GDP in 2023, relies heavily on continuous power solutions for remote sites, where grid access is limited. Companies like Sunbelt Rentals and Aggreko have provided prime power rental solutions to mining projects in Western Australia. Additionally, Australia’s commitment to reducing carbon emissions by 46% by 2030 is accelerating the adoption of gas-powered and hybrid systems in the rental market. Solar and wind farms in the country’s vast rural areas also use rental power for construction activities.
Start-ups are focusing on offering sustainable and innovative energy solutions to meet the region’s growing demand for reliable power. They are increasingly integrating renewable energy sources, such as solar and battery storage, into rental services to address both environmental regulations and the need for cleaner alternatives. Additionally, start-ups are leveraging digital technologies like IoT and AI to improve energy efficiency, reduce operational costs, and offer real-time monitoring. These companies are mainly targeting industries like construction, mining, and data centers. Some start-ups that have positively impacted Asia Pacific power rental market outlook are:
Sunseap Group was founded in 2011 and is based in Singapore. It was the first company to secure a power purchase agreement (PPA) for a floating solar farm in Southeast Asia. It provides solar energy rental solutions to commercial and industrial clients in Asia. The company specifically offers solar power generation, solar leasing, and energy storage solutions for businesses and government sectors.
Yoma Micro Power, founded in 2017 and headquartered in Yangon, Myanmar, has emerged as a key player in providing off-grid and microgrid power solutions, particularly in remote and rural areas of Myanmar. The company has built more than 250 microgrids, delivering renewable energy to telecom towers and rural communities, reducing dependency on diesel generators. The company provides solar-powered microgrids, combined with battery storage systems (BSS).
Market players are focused on improving their product offerings to meet the rising demand for backup power from diverse end use sectors. They are also increasing investments in power generation, particularly in China, India, and South Korea, which are emerging as key hubs for power plant companies. This growth is driven by rising demand across sectors such as construction and manufacturing, alongside favourable government policies promoting foreign investments. Additionally, they are leveraging technological advancements and integrating renewable energy sources in power grids to meet the growing energy needs of the APAC region.
Atlas Copco AB, founded in 1873 and based in Stockholm, Sweden, started as a manufacturer of railroad equipment and has evolved into a leader in industrial tools and equipment, focusing on sustainable productivity solutions across construction and manufacturing sectors.
Caterpillar Inc., founded in 1925 and headquartered in Illinois, United States, is renowned for its heavy machinery and engines. It provides solutions for construction, mining, and energy sectors by integrating innovation and sustainability in power generation and equipment rental.
Cummins Inc., founded in 1919 and headquartered in Indiana, United States, specialises in engine manufacturing and power generation systems. The company is committed to developing cleaner, more efficient technologies to support various industries worldwide.
Generac Holdings Inc., founded in 1959 and headquartered in Wisconsin, United States, is a leading manufacturer of backup power generation products. It focuses on residential and commercial power solutions by providing portable generators and energy storage systems.
*Please note that this is only a partial list; the complete list of key players is available in the full report. Additionally, the list of key players can be customized to better suit your needs.*
Other Asia Pacific power rental market players include Johnson Controls International Plc, Aggreko Ltd., Nishio Group (United Power & Resources Pte. Ltd), Fuji Technical Services Pvt Ltd., Modern Energy Rental Pvt. Ltd., and Perennial Technologies, among others.
Upto 15% Off
USD
$2499 $2249
$3999 $3599
$4999 $4249
$5999 $5099


*While we strive to always give you current and accurate information, the numbers depicted on the website are indicative and may differ from the actual numbers in the main report. At Expert Market Research, we aim to bring you the latest insights and trends in the market. Using our analyses and forecasts, stakeholders can understand the market dynamics, navigate challenges, and capitalize on opportunities to make data-driven strategic decisions.*
In 2025, the market reached an approximate value of USD 3.49 Billion.
The Asia Pacific power rental market is assessed to grow at a CAGR of 4.50% between 2026 and 2035.
The market is estimated to witness healthy growth in the forecast period of 2026-2035 to reach a value of around USD 5.42 Billion by 2035.
The growth of the power rental market in the Asia Pacific is primarily fuelled by occurrences of power outages, and expansion of manufacturing and construction sector.
The major fuel types for power rentals are diesel, gas, and alternative fuel.
The countries in the power rental market are China, Japan, India, ASEAN, and Australia, among others.
The major end uses are utilities, oil and gas, events, construction, mining, manufacturing, data centres, and others.
The major players in the market are Atlas Copco AB, Caterpillar Inc, Cummins Inc., Generac Holdings Inc., Johnson Controls International Plc, Aggreko Ltd., Nishio Group (United Power & Resources Pte. Ltd), Fuji Technical Services Pvt Ltd., Modern Energy Rental Pvt. Ltd., and Perennial Technologies, among others.
Explore our key highlights of the report and gain a concise overview of key findings, trends, and actionable insights that will empower your strategic decisions.
| REPORT FEATURES | DETAILS |
| Base Year | 2025 |
| Historical Period | 2019-2025 |
| Forecast Period | 2026-2035 |
| Scope of the Report |
Historical and Forecast Trends, Industry Drivers and Constraints, Historical and Forecast Market Analysis by Segment:
|
| Breakup by Fuel Type |
|
| Breakup by Rating |
|
| Breakup by Application |
|
| Breakup by End Use |
|
| Breakup by Region |
|
| Market Dynamics |
|
| Competitive Landscape |
|
| Companies Covered |
|
Datasheet
One User
USD 2,499
USD 2,249
tax inclusive*
Single User License
One User
USD 3,999
USD 3,599
tax inclusive*
Five User License
Five User
USD 4,999
USD 4,249
tax inclusive*
Corporate License
Unlimited Users
USD 5,999
USD 5,099
tax inclusive*
*Please note that the prices mentioned below are starting prices for each bundle type. Kindly contact our team for further details.*
Flash Bundle
Small Business Bundle
Growth Bundle
Enterprise Bundle
*Please note that the prices mentioned below are starting prices for each bundle type. Kindly contact our team for further details.*
Flash Bundle
Number of Reports: 3
20%
tax inclusive*
Small Business Bundle
Number of Reports: 5
25%
tax inclusive*
Growth Bundle
Number of Reports: 8
30%
tax inclusive*
Enterprise Bundle
Number of Reports: 10
35%
tax inclusive*
How To Order

Select License Type
Choose the right license for your needs and access rights.

Click on ‘Buy Now’
Add the report to your cart with one click and proceed to register.

Select Mode of Payment
Choose a payment option for a secure checkout. You will be redirected accordingly.
Strategic Solutions for Informed Decision-Making
Gain insights to stay ahead and seize opportunities.

Get insights & trends for a competitive edge.

Track prices with detailed trend reports.

Analyse trade data for supply chain insights.

Leverage cost reports for smart savings

Enhance supply chain with partnerships.

Connect For More Information
Our expert team of analysts will offer full support and resolve any queries regarding the report, before and after the purchase.
Our expert team of analysts will offer full support and resolve any queries regarding the report, before and after the purchase.
We employ meticulous research methods, blending advanced analytics and expert insights to deliver accurate, actionable industry intelligence, staying ahead of competitors.
Our skilled analysts offer unparalleled competitive advantage with detailed insights on current and emerging markets, ensuring your strategic edge.
We offer an in-depth yet simplified presentation of industry insights and analysis to meet your specific requirements effectively.


