

Consumer Insights
Uncover trends and behaviors shaping consumer choices today
Procurement Insights
Optimize your sourcing strategy with key market data
Industry Stats
Stay ahead with the latest trends and market analysis.

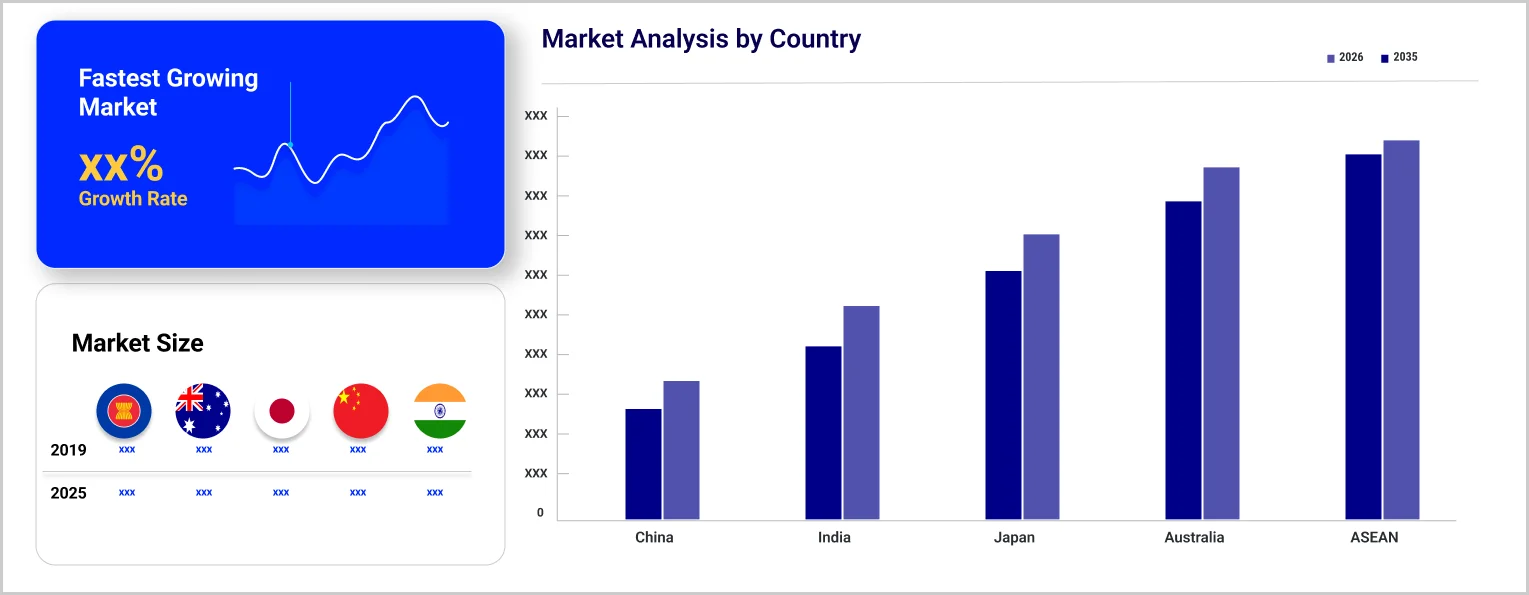
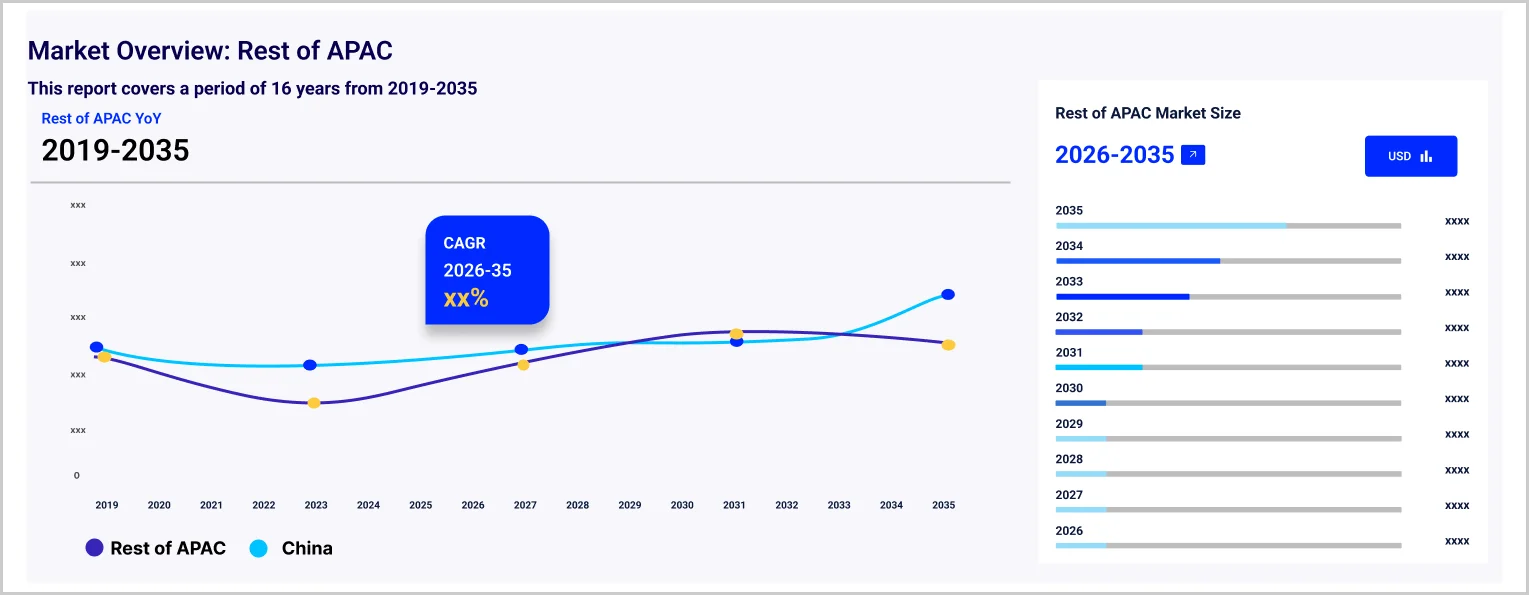
The Asia Pacific wax market size reached around USD 4.17 Billion in 2025. The market is projected to grow at a CAGR of 3.30% between 2026 and 2035 to reach nearly USD 5.77 Billion by 2035.
As reported by the South China Morning Post on April 29, Sinopec posted a 28 percent year-on-year jump in first quarter net profit to 17 billion yuan, with higher crude values lifting refining margins on petroleum products. Since Sinopec ranks among the largest paraffin wax producers feeding the Asia Pacific wax market, sustained margin strength typically supports steady wax output and firmer pricing across China and neighboring countries.
Energy News reported on March 23 that Sinopec's 2025 net profit fell 36.8 percent to 31.8 billion yuan, citing weak petrochemical margins and growing substitution from new energy resources. With refinery throughput projected to stay near 250 million tonnes through 2026, regional buyers of paraffin wax and microcrystalline grades may face tighter supply conditions, potentially supporting firmer prices across the Asia Pacific wax market.
Geopolitical Impact of Iran, US, and Israel War on the Asia Pacific Wax Market
United States: The Asia Pacific Wax Market, a key segment of the global economy, is experiencing a complex operating environment in Q1 2026 as a direct consequence of the US-Israel-Iran war. 31 force majeure declarations by polymer suppliers, polypropylene and polyethylene price spikes, and chemical manufacturer surcharges of up to 30% are flowing through supply chains. U.S. consumer inflation is projected at 4.2% for 2026, above pre-war forecasts, with fuel costs above USD 4 per gallon compressing household discretionary budgets. Retail supply chains are absorbing the combined impact of 30% higher freight costs, 15-20% packaging material inflation, and rising transport fuel costs, compressing retailer margins. Consumer spending caution is growing as gasoline above USD 4 per gallon and 4.2% projected inflation compress household discretionary budgets.
Iran: Iran's domestic Asia Pacific Wax sector has been effectively suspended by the conflict. US-Israeli strikes on industrial and civilian infrastructure across Tehran, Mashhad, Isfahan, and other major cities have disrupted all commercial activity. Power outages from attacks on electricity generation facilities have halted manufacturing operations, and the collapse of the commercial banking and logistics system has eliminated any residual trade flows. The broader humanitarian crisis, with over 1,900 casualties and 4,000+ civilian buildings damaged, has redirected the entire Iranian economy toward survival rather than production or consumption.
Israel: Israel's Asia Pacific Wax sector is experiencing near-term disruption from wartime conditions. Consumer spending on non-essential categories has declined as millions of Israelis regularly shelter from missile and drone alerts. Supply chain logistics are disrupted by regional airspace closures, elevated war-risk insurance premiums, and the suspension of major carrier services through the region. International business partnerships with Israeli companies have been temporarily suspended. Post-conflict reconstruction and recovery demand is expected to provide meaningful demand acceleration across affected market segments once operational conditions normalise.
Base Year
Historical Period
Forecast Period
As per industry reports, Dalian seaport (China) accounts for 70% of all wax exports from China.
Nippon Seiro Co., Ltd. accounts for 70% of all domestic wax sales in Japan, making it a leading holder of Asia Pacific wax market share.
Nippon Seiro Co., Ltd. is an exporter of specialised wax products to over 30 countries.
Compound Annual Growth Rate
3.3%
Value in USD Billion
2026-2035
*this image is indicative*
| Asia Pacific Wax Market Report Summary | Description | Value |
| Base Year | USD Billion | 2025 |
| Historical Period | USD Billion | 2019-2025 |
| Forecast Period | USD Billion | 2026-2035 |
| Market Size 2025 | USD Billion | 4.17 |
| Market Size 2035 | USD Billion | 5.77 |
| CAGR 2019-2025 | Percentage | XX% |
| CAGR 2026-2035 | Percentage | 3.30% |
| CAGR 2026-2035 - Market by Country | India | 3.8% |
| CAGR 2026-2035 - Market by Country | China | 3.2% |
| CAGR 2026-2035 - Market by Type | Natural | 3.7% |
| CAGR 2026-2035 - Market by Application | Candles | 4.1% |
| 2025 Market Share by Country | India | 10.8% |
Southeast Asia has emerged as the rising sun for the global automotive tyre industry. Though China alone accounts for around 30% of global tyre production and is home to around 161 tyre factories, the region is giving it tough competition. The Southeast Asia has an annual production capacity of 388 million units, and accounts for nearly 10% of the total volume of tyre production. Thailand is the largest tyre manufacturer in the region (79.4 million), followed by Indonesia, Vietnam (79.25 million), and Cambodia (10 million). The region boasts of 9 tyre factories, with the presence of 29 prominent global manufacturers. This positive trajectory is expected to favourably impact the demand for microcrystalline wax, which is extensively used in the processing of rubber, thereby aiding in the Asia Pacific wax market development.
Paraffin wax is extensively used in paper product processing and candle making. While wax-based packaging is moisture proof, waterproof, glossy, retains fragrance, and provides lubrication, wax candles are solid at room temperature and have good flammability. Paraffin wax also finds extensive applications in manufacturing matches, inks, leather, and stationary products. This wide range of applications are driving the market growth.
Increasing demand for natural wax; rising demand for candles; shift towards beeswax; and emergence of rice bran wax are trends impacting the Asia Pacific wax market growth.
Over the forecast period, natural wax derived from marine microalga Isochrysis, is expected to replace petroleum present in cosmetics and personal care products.
India, China, and Vietnam are the leading manufacturers of artisanal candles. They export 16033, 6231, and 5523 units of shipments globally. The rising demand for candles has favourably shaped the Asia Pacific wax market outlook.
Beeswax is extensively used in cosmetics and personal care products since its facilitates cellular regeneration and skin healing. It also reduces skin irritation and itchiness and reduces the appearance of fine lines and wrinkles. Expansion of cosmetic industries is expected fuel the Asia Pacific wax market growth.
Rice bran wax is a sustainable alternative to other types of wax since it is derived as a byproduct of the rice industry. It can be used in many different applications, which is expected to contribute to the market expansion.
India is the largest global producer of beeswax, and harvests around 23,000 tons annually. Beeswax is renowned for its natural honey-like aroma and is extensively used by cosmetic manufacturers for producing skin creams and lotions. It forms a protective skin barrier which locks in moisture while ensuring breathability. Also, it is a natural choice for people suffering from skin problems, such as sensitivity, irritation, or acne. These applications and trends are expected to drive the Asia Pacific wax market expansion.
The EMR’s report titled “Asia Pacific Wax Market Report and Forecast 2026-2035” offers a detailed analysis of the market based on the following segments:
Market Breakup by Type
Market Breakup by Application
Market Breakup by Country
| CAGR 2026-2035 - Market by | Country |
| India | 3.8% |
| China | 3.2% |
| Japan | XX% |
| ASEAN | XX% |
| Australia | XX% |
| Others | XX% |
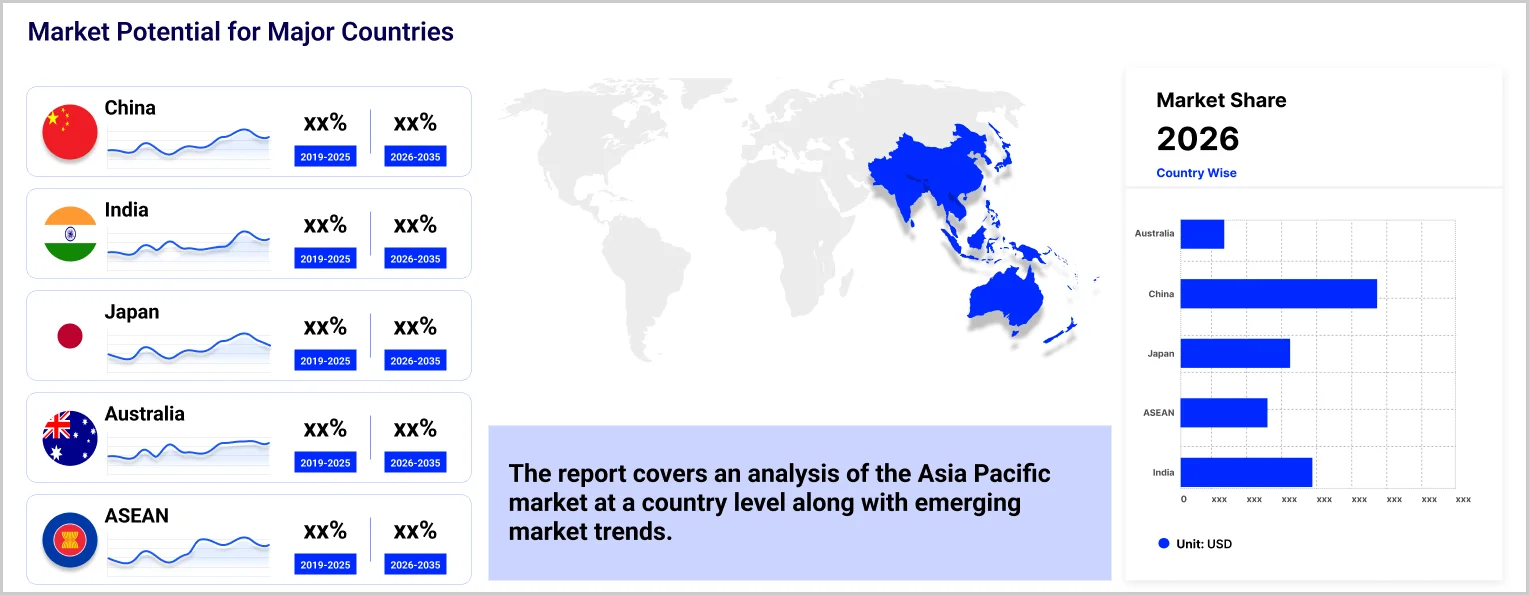
Based on region, the market is segmented into China, Japan, India, ASEAN, and Australia, among others. India is projected to dominate the market, representing 11% of the overall market share. Over the forecast period, it is expected to grow at a CAGR of 3.8% due to the increasing appeal for beeswax-based cosmetics products among consumers. Moreover, increasing government investments in the expansion of the local petrochemicals industry is also expected to drive the market growth over the forecast period.
Major players are shifting towards the production of plant-based wax to enhance their consumer appeal and gain a significant Asia Pacific wax market share.
King Honor International Ltd. was founded in 2008 and is headquartered in Dalian, China. It is a chemical manufacturing company which is a leading supplier of waxes in many foreign countries.
SCG Chemicals Public Company Limited was founded in 1994 and is headquartered in Bangkok, Thailand. As per Asia Pacific wax market analysis, it is amongst the biggest integrated petrochemical companies present in Asia and manufactures a wide range of petrochemical based finished products.
Mitsui Chemicals, Inc. was founded in 1997 and is headquartered in Tokyo, Japan. It is a chemical manufacturing company which specialises in providing petrochemicals, battery materials, and health and wellness solutions.
Jiangsu Faer Wax Industry Co., Ltd. was established in 2007 and is headquartered in China. It specialises in the production of chemicals, polyethylene wax, and PVC stabilisers, among other products.
*Please note that this is only a partial list; the complete list of key players is available in the full report. Additionally, the list of key players can be customized to better suit your needs.*
Other players included in the Asia Pacific wax market report are China Petroleum & Chemical Corp. (Sinopec), China National Petroleum Corporation, Shell Plc, Nippon Seiro Co., Ltd., ExxonMobil Corporation, and Indian Oil Corporation Ltd., among others.
Upto 15% Off
USD
$3999 $3599
$2499 $2249
$4999 $4249
$5999 $5099


*While we strive to always give you current and accurate information, the numbers depicted on the website are indicative and may differ from the actual numbers in the main report. At Expert Market Research, we aim to bring you the latest insights and trends in the market. Using our analyses and forecasts, stakeholders can understand the market dynamics, navigate challenges, and capitalize on opportunities to make data-driven strategic decisions.*
Get in touch with us for a customized solution tailored to your unique requirements and save upto 35%!
The market is projected to grow at a CAGR of 3.30% between 2026 and 2035.
Key trends aiding the market expansion are increasing demand for natural wax, growing demand for candle, shift towards beeswax, and emergence of rice bran wax.
The different types of wax available in the market are mineral, synthetic, and natural.
The different applications of wax in the market are candles, packaging, plastic and rubber, pharmaceutical, wax bag, cosmetics and toiletries, and adhesives, among others.
The different countries covered in the market report are China, Japan, India, ASEAN, and Australia, among others.
Key market players are China Petroleum & Chemical Corp. (Sinopec), China National Petroleum Corporation, Shell Plc, Nippon Seiro Co., Ltd., ExxonMobil Corporation, Mitsui Chemicals, Inc., Indian Oil Corporation Ltd., King Honor International Ltd., Jiangsu Faer Wax Industry Co., Ltd., and SCG Chemicals Public Company Limited, among others.
In 2025, the market reached an approximate value of USD 4.17 Billion.
The market is estimated to witness healthy growth in the forecast period of 2026-2035 to reach a value of around USD 5.77 Billion by 2035.
Explore our key highlights of the report and gain a concise overview of key findings, trends, and actionable insights that will empower your strategic decisions.
| REPORT FEATURES | DETAILS |
| Base Year | 2025 |
| Historical Period | 2019-2025 |
| Forecast Period | 2026-2035 |
| Scope of the Report |
Historical and Forecast Trends, Industry Drivers and Constraints, Historical and Forecast Market Analysis by Segment:
|
| Breakup by Type |
|
| Breakup by Application |
|
| Breakup by Region |
|
| Market Dynamics |
|
| Competitive Landscape |
|
| Companies Covered |
|
Single User License
One User
USD 3,999
USD 3,599
tax inclusive*
Datasheet
One User
USD 2,499
USD 2,249
tax inclusive*
Five User License
Five User
USD 4,999
USD 4,249
tax inclusive*
Corporate License
Unlimited Users
USD 5,999
USD 5,099
tax inclusive*
*Please note that the prices mentioned below are starting prices for each bundle type. Kindly contact our team for further details.*
Flash Bundle
Small Business Bundle
Growth Bundle
Enterprise Bundle
*Please note that the prices mentioned below are starting prices for each bundle type. Kindly contact our team for further details.*
Flash Bundle
Number of Reports: 3
20%
tax inclusive*
Small Business Bundle
Number of Reports: 5
25%
tax inclusive*
Growth Bundle
Number of Reports: 8
30%
tax inclusive*
Enterprise Bundle
Number of Reports: 10
35%
tax inclusive*
How To Order

Select License Type
Choose the right license for your needs and access rights.

Click on ‘Buy Now’
Add the report to your cart with one click and proceed to register.

Select Mode of Payment
Choose a payment option for a secure checkout. You will be redirected accordingly.
Strategic Solutions for Informed Decision-Making
Gain insights to stay ahead and seize opportunities.

Get insights & trends for a competitive edge.

Track prices with detailed trend reports.

Analyse trade data for supply chain insights.

Leverage cost reports for smart savings

Enhance supply chain with partnerships.

Connect For More Information
Our expert team of analysts will offer full support and resolve any queries regarding the report, before and after the purchase.
Our expert team of analysts will offer full support and resolve any queries regarding the report, before and after the purchase.
We employ meticulous research methods, blending advanced analytics and expert insights to deliver accurate, actionable industry intelligence, staying ahead of competitors.
Our skilled analysts offer unparalleled competitive advantage with detailed insights on current and emerging markets, ensuring your strategic edge.
We offer an in-depth yet simplified presentation of industry insights and analysis to meet your specific requirements effectively.


Share