Reports

Sale

Asia Pacific Wires and Cables Market

Asia Pacific Wires and Cables Market Size, Share, Growth: By Voltage: Low Voltage, Medium Voltage, High Voltage; By Product: Power Cables, Building Wires, Flexible Wires and Cables, EHV Cables, Control/Instrumentation Cables, Others; By Material: Copper, Aluminium, Others; By End Use; Regional Analysis; Competitive Landscape; 2024-2032

Asia Pacific Wires and Cables Market Outlook

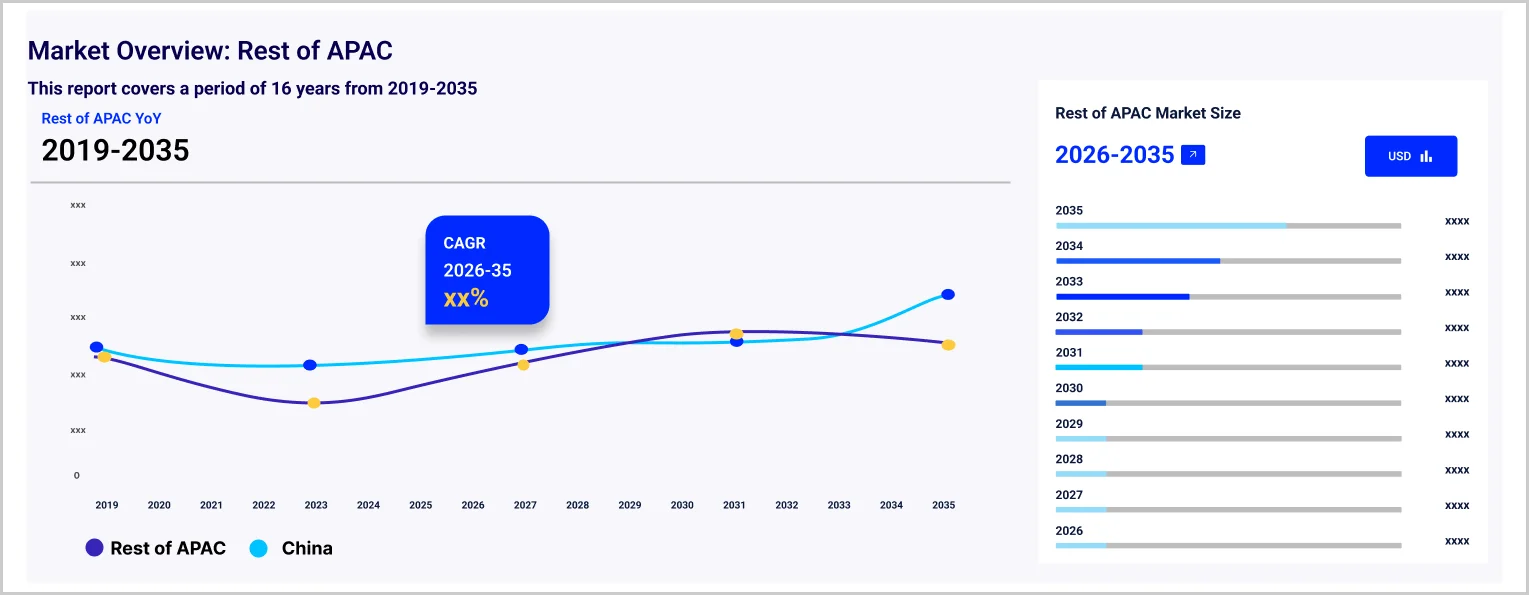
The Asia Pacific wires and cables market size reached approximately USD 157.2 billion in 2023. The market is projected to grow at a CAGR of 3.8% between 2024 and 2032, reaching a value of around USD 221.6 billion by 2032.


Key Takeaways

  • In 2022, the Chinese wire and cable production output was about 59.27 million kilometres.
  • Advanced manufacturing processes such as precision extrusion moulding, laser welding, etc are gaining traction, and are improving the precision and reliability of wire and cable products.
  • In May 2023, the index of industrial production in India grew by 5.2% from 4.2% measured in April 2023.


Reportedly, Asia is considered a top region for international traffic and is considered a key hub of Internet activity. The increasing interest in Internet and cloud-based services is encouraging global hyperscalers and wholesale network providers to invest in the region, further improving the bandwidth.  Further, the Asia Pacific wires and cables market growth is supported by the significant growth of the construction sector. In 2022, public sector construction output increased by 14.3% to USD 17.3 billion in Singapore.


With the increasing importance of environmental protection and preference for sustainable products, flexible cables are gaining traction due to their excellent performance. Flexible wires offer increased service life and can complete between one and three million cycles.


The advent of Industry 4.0 in countries such as Malaysia is increasing the integration of wires and cables for automating smart factories. It also allows for data and power flow, which are important for the functioning of interconnected, intelligent industrial systems.  India is a prominent country in the region witnessing rapid growth for wires and cables. The favourable government initiatives such as the Rs 12,195 crore PLI scheme for the telecom sector including localised production of core transmission equipment, routers and switches support the market expansion.


Asia Pacific Wires and Cables Market


Market Segmentation

Asia Pacific wires and cables Market Report and Forecast 2024-2032 offers a detailed analysis of the market based on the following segments


Market Breakup by Voltage

  • Low Voltage
  • Medium Voltage
  • High Voltage


Market Breakup by Product

  • Power Cables
  • Building Wires
  • Flexible Wires and Cables
  • EHV Cables
  • Control/Instrumentation Cables
  • Others


Market Breakup by Material

  • Copper
  • Aluminium
  • Others


Market Breakup by End Use

  • Construction
    • Residential
    • Commercial
  • Telecommunications
  • Energy and Power
  • Automotive
  • Aerospace and Defence
  • Others


Market Breakup by Region

  • China
  • Japan
  • India
  • ASEAN
  • Australia
  • Others


Competitive Landscape

The wires and cables sector is witnessing a strong emphasis from market players on integrating advanced technologies, to meet the changing demands of consumers.


  • Hitachi, Ltd
  • Sumitomo Electric Industries, Ltd
  • Mitsuboshi Co., Ltd
  • ENEOS NUC Corporation
  • Furukawa Electric Co., Ltd.
  • TATSUTA Electric Wire & Cable Co., Ltd.
  • Tai Sin Electric Limited
  • Polycab India Ltd.
  • Oki Electric Industry Co., Ltd. (Oki Electric Cable Co., Ltd.)
  • V Guard Industries Ltd.
  • Others


Key Highlights of the Report

REPORT FEATURES DETAILS
Base Year 2023
Historical Period 2018-2023
Forecast Period 2024-2032
Scope of the Report

Historical and Forecast Trends, Industry Drivers and Constraints, Historical and Forecast Market Analysis by Segment:

  • Voltage
  • Product
  • Material
  • End Use
  • Region
Breakup by Voltage
  • Low Voltage
  • Medium Voltage
  • High Voltage
Breakup by Product
  • Power Cables
  • Building Wires
  • Flexible Wires and Cables
  • EHV Cables
  • Control/Instrumentation Cables
  • Others
Breakup by Material
  • Copper
  • Aluminium
  • Others
Breakup by End Use
  • Construction
  • Telecommunications
  • Energy and Power
  • Automotive
  • Aerospace and Defence
  • Others
Breakup by Region
  • China
  • Japan
  • India
  • ASEAN
  • Australia
  • Others
Market Dynamics
  • SWOT Analysis
  • Porter's Five Forces Analysis
  • Key Indicators for Demand
  • Key Indicators for Price
Competitive Landscape
  • Market Structure
  • Company Profiles
    • Company Overview
    • Product Portfolio
    • Demographic Reach and Achievements
    • Certifications
Companies Covered
  • Hitachi, Ltd
  • Sumitomo Electric Industries, Ltd
  • Mitsuboshi Co., Ltd
  • ENEOS NUC Corporation
  • Furukawa Electric Co., Ltd.
  • TATSUTA Electric Wire & Cable Co., Ltd.
  • Tai Sin Electric Limited
  • Polycab India Ltd.
  • Oki Electric Industry Co., Ltd. (Oki Electric Cable Co., Ltd.)
  • V Guard Industries Ltd.
  • Others


*At Expert Market Research, we strive to always give you current and accurate information. The numbers depicted in the description are indicative and may differ from the actual numbers in the final EMR report.

1    Preface
2    Report Coverage – Key Segmentation and Scope
3    Report  Description

    3.1    Market Definition and Outlook
    3.2    Properties and Applications
    3.3    Market Analysis
    3.4    Key Players
4    Key Assumptions
5    Executive Summary

    5.1    Overview
    5.2    Key Drivers    
    5.3    Key Developments
    5.4    Competitive Structure
    5.5    Key Industrial Trends
6    Market Snapshot
7    Opportunities and Challenges in the Market
8    Global Wires and Cables Market Overview

    8.1    Key Industry Highlights
    8.2    Global Wires and Cables Historical Market (2018-2023) 
    8.3    Global Wires and Cables Market Forecast (2024-2032)
    8.4    Global Wires and Cables Market Share by Region
        8.4.1    North America
        8.4.2    Europe
        8.4.3    Asia Pacific
        8.4.4    Latin America
        8.4.5    Middle East and Africa
9    Asia Pacific Wires and Cables Market Overview
    9.1    Key Industry Highlights
    9.2    Asia Pacific Wires and Cables Historical Market (2018-2023) 
    9.3    Asia Pacific Wires and Cables Market Forecast (2024-2032)
10    Asia Pacific Wires and Cables Market by Voltage
    10.1    Low Voltage
        10.1.1    Historical Trend (2018-2023)
        10.1.2    Forecast Trend (2024-2032)
    10.2    Medium Voltage 
        10.2.1    Historical Trend (2018-2023)
        10.2.2    Forecast Trend (2024-2032)
    10.3    High Voltage
        10.3.1    Historical Trend (2018-2023)
        10.3.2    Forecast Trend (2024-2032)
11    Asia Pacific Wires and Cables Market by Product
    11.1    Power Cables
        11.1.1    Historical Trend (2018-2023)
        11.1.2    Forecast Trend (2024-2032)
    11.2    Building Wires
        11.2.1    Historical Trend (2018-2023)
        11.2.2    Forecast Trend (2024-2032)
    11.3    Flexible Wires and Cables
        11.3.1    Historical Trend (2018-2023)
        11.3.2    Forecast Trend (2024-2032)
    11.4    EHV Cables
        11.4.1    Historical Trend (2018-2023)
        11.4.2    Forecast Trend (2024-2032)
    11.5    Control/Instrumentation Cables
        11.5.1    Historical Trend (2018-2023)
        11.5.2    Forecast Trend (2024-2032)
    11.6    Others
12    Asia Pacific Wires and Cables Market by Material
    12.1    Copper
        12.1.1    Historical Trend (2018-2023)
        12.1.2    Forecast Trend (2024-2032)
    12.2    Aluminium
        12.2.1    Historical Trend (2018-2023)
        12.2.2    Forecast Trend (2024-2032)
    12.3    Others
13    Asia Pacific Wires and Cables Market by End Use
    13.1    Construction
        13.1.1    Historical Trend (2018-2023)
        13.1.2    Forecast Trend (2024-2032)
        13.1.3    Breakup by Type
            13.1.3.1    Residential
            13.1.3.2    Commercial
    13.2    Telecommunications
        13.2.1    Historical Trend (2018-2023)
        13.2.2    Forecast Trend (2024-2032)
    13.3    Energy and Power
        13.3.1    Historical Trend (2018-2023)
        13.3.2    Forecast Trend (2024-2032)
    13.4    Automotive
        13.4.1    Historical Trend (2018-2023)
        13.4.2    Forecast Trend (2024-2032)
    13.5    Aerospace and Defence
        13.5.1    Historical Trend (2018-2023)
        13.5.2    Forecast Trend (2024-2032)
    13.6    Others
14    Asia Pacific Wires and Cables Market by Country
    14.1    China
        14.1.1    Historical Trend (2018-2023)
        14.1.2    Forecast Trend (2024-2032)
    14.2    Japan
        14.2.1    Historical Trend (2018-2023)
        14.2.2    Forecast Trend (2024-2032)
    14.3    India
        14.3.1    Historical Trend (2018-2023)
        14.3.2    Forecast Trend (2024-2032)
    14.4    ASEAN
        14.4.1    Historical Trend (2018-2023)
        14.4.2    Forecast Trend (2024-2032)
    14.5    Australia
        14.5.1    Historical Trend (2018-2023)
        14.5.2    Forecast Trend (2024-2032)
    14.6    Others
15    Market Dynamics
    15.1    SWOT Analysis
        15.1.1    Strengths
        15.1.2    Weaknesses
        15.1.3    Opportunities
        15.1.4    Threats
    15.2    Porter’s Five Forces Analysis
        15.2.1    Supplier’s Power
        15.2.2    Buyer’s Power
        15.2.3    Threat of New Entrants
        15.2.4    Degree of Rivalry
        15.2.5    Threat of Substitutes
    15.3    Key Indicators of Demand
    15.4    Key Indicators of Price
16    Value Chain Analysis
17    Trade Data Analysis (HS Code – 854411, 854419, 854420)

    17.1    Major Exporting Countries 
        17.1.1    By Value
        17.1.2    By Volume
    17.2    Major Importing Countries 
        17.2.1    By Value
        17.2.2    By Volume
18    Price Analysis
19    Competitive Landscape

    19.1    Market Structure
    19.2    Company Profiles
        19.2.1    Hitachi, Ltd.  
            19.2.1.1    Company Overview
            19.2.1.2    Product Portfolio
            19.2.1.3    Demographic Reach and Achievements
            19.2.1.4    Certifications
        19.2.2    Sumitomo Electric Industries, Ltd.  
            19.2.2.1    Company Overview
            19.2.2.2    Product Portfolio
            19.2.2.3    Demographic Reach and Achievements
            19.2.2.4    Certifications
        19.2.3    Mitsuboshi Co., Ltd.  
            19.2.3.1    Company Overview
            19.2.3.2    Product Portfolio
            19.2.3.3    Demographic Reach and Achievements
            19.2.3.4    Certifications
        19.2.4     ENEOS NUC Corporation  
            19.2.4.1    Company Overview
            19.2.4.2    Product Portfolio
            19.2.4.3    Demographic Reach and Achievements
            19.2.4.4    Certifications
        19.2.5    Furukawa Electric Co., Ltd.  
            19.2.5.1    Company Overview
            19.2.5.2    Product Portfolio
            19.2.5.3    Demographic Reach and Achievements
            19.2.5.4    Certifications
        19.2.6    TATSUTA Electric Wire & Cable Co., Ltd.  
            19.2.6.1    Company Overview
            19.2.6.2    Product Portfolio
            19.2.6.3    Demographic Reach and Achievements
            19.2.6.4    Certifications
        19.2.7    Tai Sin Electric Limited  
            19.2.7.1    Company Overview
            19.2.7.2    Product Portfolio
            19.2.7.3    Demographic Reach and Achievements
            19.2.7.4    Certifications
        19.2.8    Polycab India Ltd.   
            19.2.8.1    Company Overview
            19.2.8.2    Product Portfolio
            19.2.8.3    Demographic Reach and Achievements
            19.2.8.4    Certifications
        19.2.9    Oki Electric Industry Co., Ltd. (Oki Electric Cable Co., Ltd.)   
            19.2.9.1    Company Overview
            19.2.9.2    Product Portfolio
            19.2.9.3    Demographic Reach and Achievements
            19.2.9.4    Certifications
        19.2.10    V Guard Industries Ltd.  
            19.2.10.1    Company Overview
            19.2.10.2    Product Portfolio
            19.2.10.3    Demographic Reach and Achievements
            19.2.10.4    Certifications
        19.2.11    Others
20    Key Trends and Developments in the Market


List of Key Figures and Tables

1.    Global Wires and Cables Market: Key Industry Highlights, 2018 and 2032
2.    Asia Pacific Wires and Cables Market: Key Industry Highlights, 2018 and 2032
3.    Asia Pacific Wires and Cables Historical Market: Breakup by Voltage (USD Billion), 2018-2023
4.    Asia Pacific Wires and Cables Market Forecast: Breakup by Voltage (USD Billion), 2024-2032
5.    Asia Pacific Wires and Cables Historical Market: Breakup by Product (USD Billion), 2018-2023
6.    Asia Pacific Wires and Cables Market Forecast: Breakup by Product (USD Billion), 2024-2032
7.    Asia Pacific Wires and Cables Historical Market: Breakup by Material (USD Billion), 2018-2023
8.    Asia Pacific Wires and Cables Market Forecast: Breakup by Material (USD Billion), 2024-2032
9.    Asia Pacific Wires and Cables Historical Market: Breakup by End Use (USD Billion), 2018-2023
10.    Asia Pacific Wires and Cables Market Forecast: Breakup by End Use (USD Billion), 2024-2032
11.    Asia Pacific Wires and Cables Historical Market: Breakup by Country (USD Billion), 2018-2023
12.    Asia Pacific Wires and Cables Market Forecast: Breakup by Country (USD Billion), 2024-2032
13.    Major Exporting Countries by Value
14.    Major Importing Countries by Value
15.    Major Exporting Countries by Volume
16.    Major Importing Countries by Volume
17.    Asia Pacific Wires and Cables Market Structure

Key Questions Answered in the Report

The market reached a value of approximately USD 157.2 billion in 2023.

The market is estimated to grow at a CAGR of 3.8% between 2024 and 2032.

The market is estimated to witness a healthy growth during 2024-2032 to reach around USD 221.6 billion by 2032.

The wires and cables market in the Asia Pacific is driven by the expansion of the construction sector, rising technological advancements, the advent of Industry 4.0, the transition towards smart homes, and the growing automotive sector.

The key materials are copper, aluminium, and others.

The products include power cables, building wires, flexible wires and cables, EHV cables, control/instrumentation cables, and others.

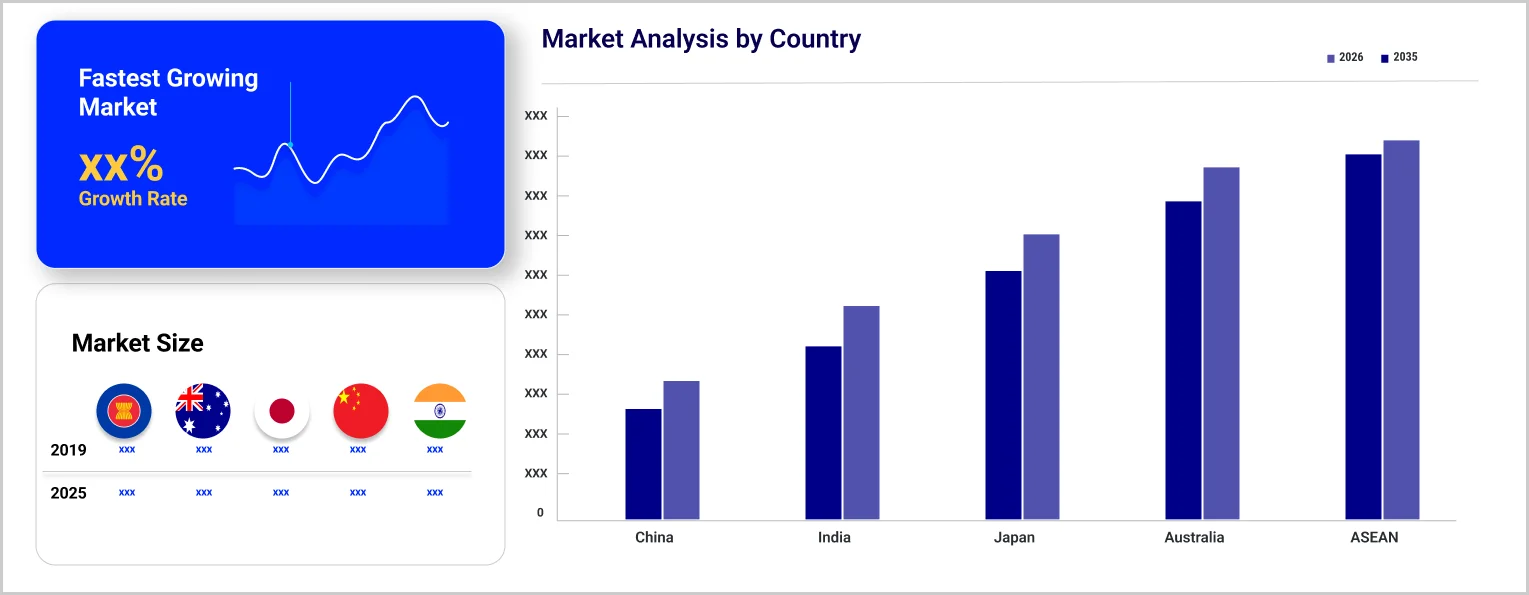
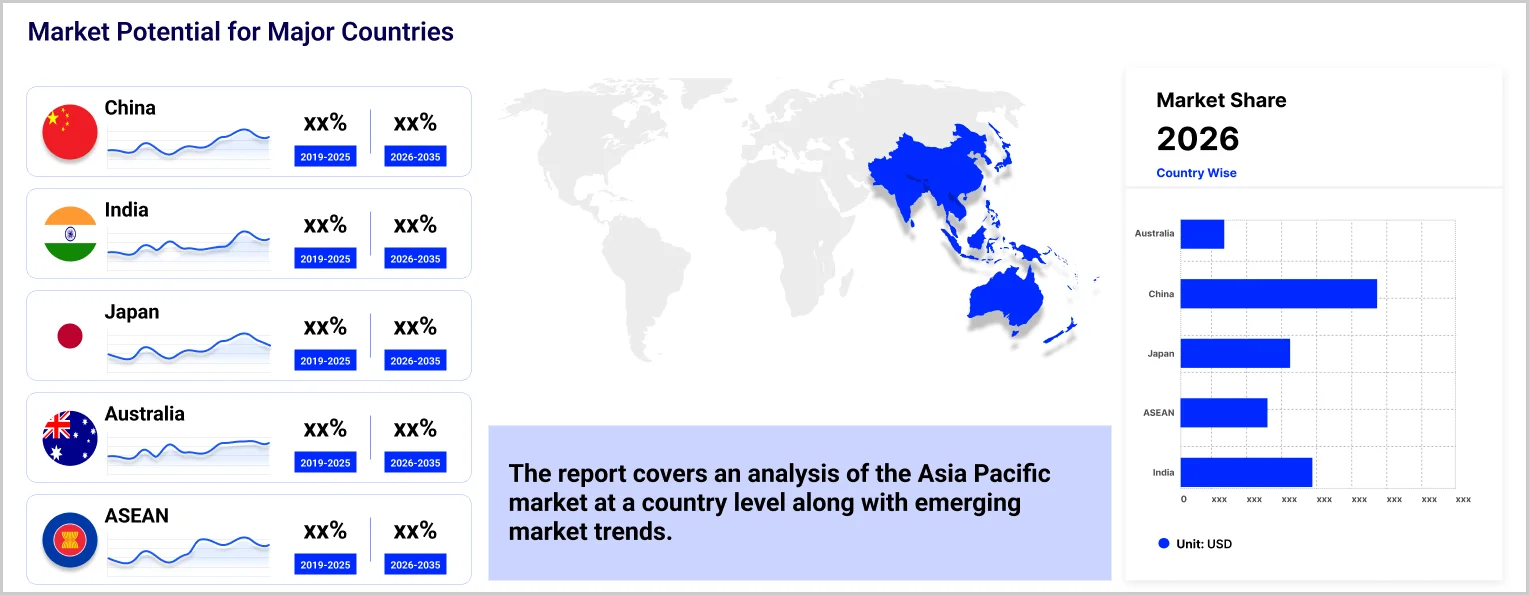
The major countries are China, Japan, India, ASEAN, and Australia, among others.

The major players in the market are Hitachi, Ltd, Sumitomo Electric Industries, Ltd, Mitsuboshi Co., Ltd, ENEOS NUC Corporation, Furukawa Electric Co., Ltd, TATSUTA Electric Wire & Cable Co., Ltd, Tai Sin Electric Limited, Polycab India Ltd, Oki Electric Industry Co., Ltd. (Oki Electric Cable Co., Ltd.), and V Guard Industries Ltd, among others.

Purchase Full Report

Mini Report

$ 2199     $1999
  • Selected Sections, One User
  • Printing Not Allowed
  • Email Delivery in PDF
  • Free Limited Customisation
  • Post Sales Analyst Support
  • 50% Discount on Next Update

Single User License

$ 3299     $2999
  • All Sections, One User
  • One Print Allowed
  • Email Delivery in PDF
  • Free Limited Customisation
  • Post Sales Analyst Support
  • 50% Discount on Next Update
most popular

Five User License

$ 4399     $3999
  • All Sections, Five Users
  • Five Prints Allowed
  • Email Delivery in PDF
  • Free Limited Customisation
  • Post Sales Analyst Support
  • 50% Discount on Next Update

Corporate License

$ 5499     $4999
  • All Sections, Unlimited Users
  • Unlimited Prints Allowed
  • Email Delivery in PDF + Excel
  • Free Limited Customisation
  • Post Sales Analyst Support
  • 50% Discount on Next Update

Any Question? Speak With An Analyst

Contact Analyst

View A Sample

Request Sample

Did You Miss Anything, Ask Now

Request Customisation
Why Expert Market Research?

Right People

We are technically excellent, strategic, practical, experienced and efficient; our analysts are hand-picked based on having the right attributes to work successfully and execute projects based on your expectations.

Right Methodology

We leverage our cutting-edge technology, our access to trusted databases, and our knowledge of the current models used in the market to deliver you research solutions that are tailored to your needs and put you ahead of the curve.

Right Price

We deliver in-depth and superior quality research in prices that are reasonable, unmatchable, and shows our understanding of your resource structure. We, additionally, offer attractive discounts on our upcoming reports.

Right Support

Our team of expert analysts are at your beck and call to deliver you optimum results that are customised to meet your precise needs within the specified timeframe and help you form a better understanding of the industry.

NEWSLETTER