

Consumer Insights
Uncover trends and behaviors shaping consumer choices today
Procurement Insights
Optimize your sourcing strategy with key market data
Industry Stats
Stay ahead with the latest trends and market analysis.
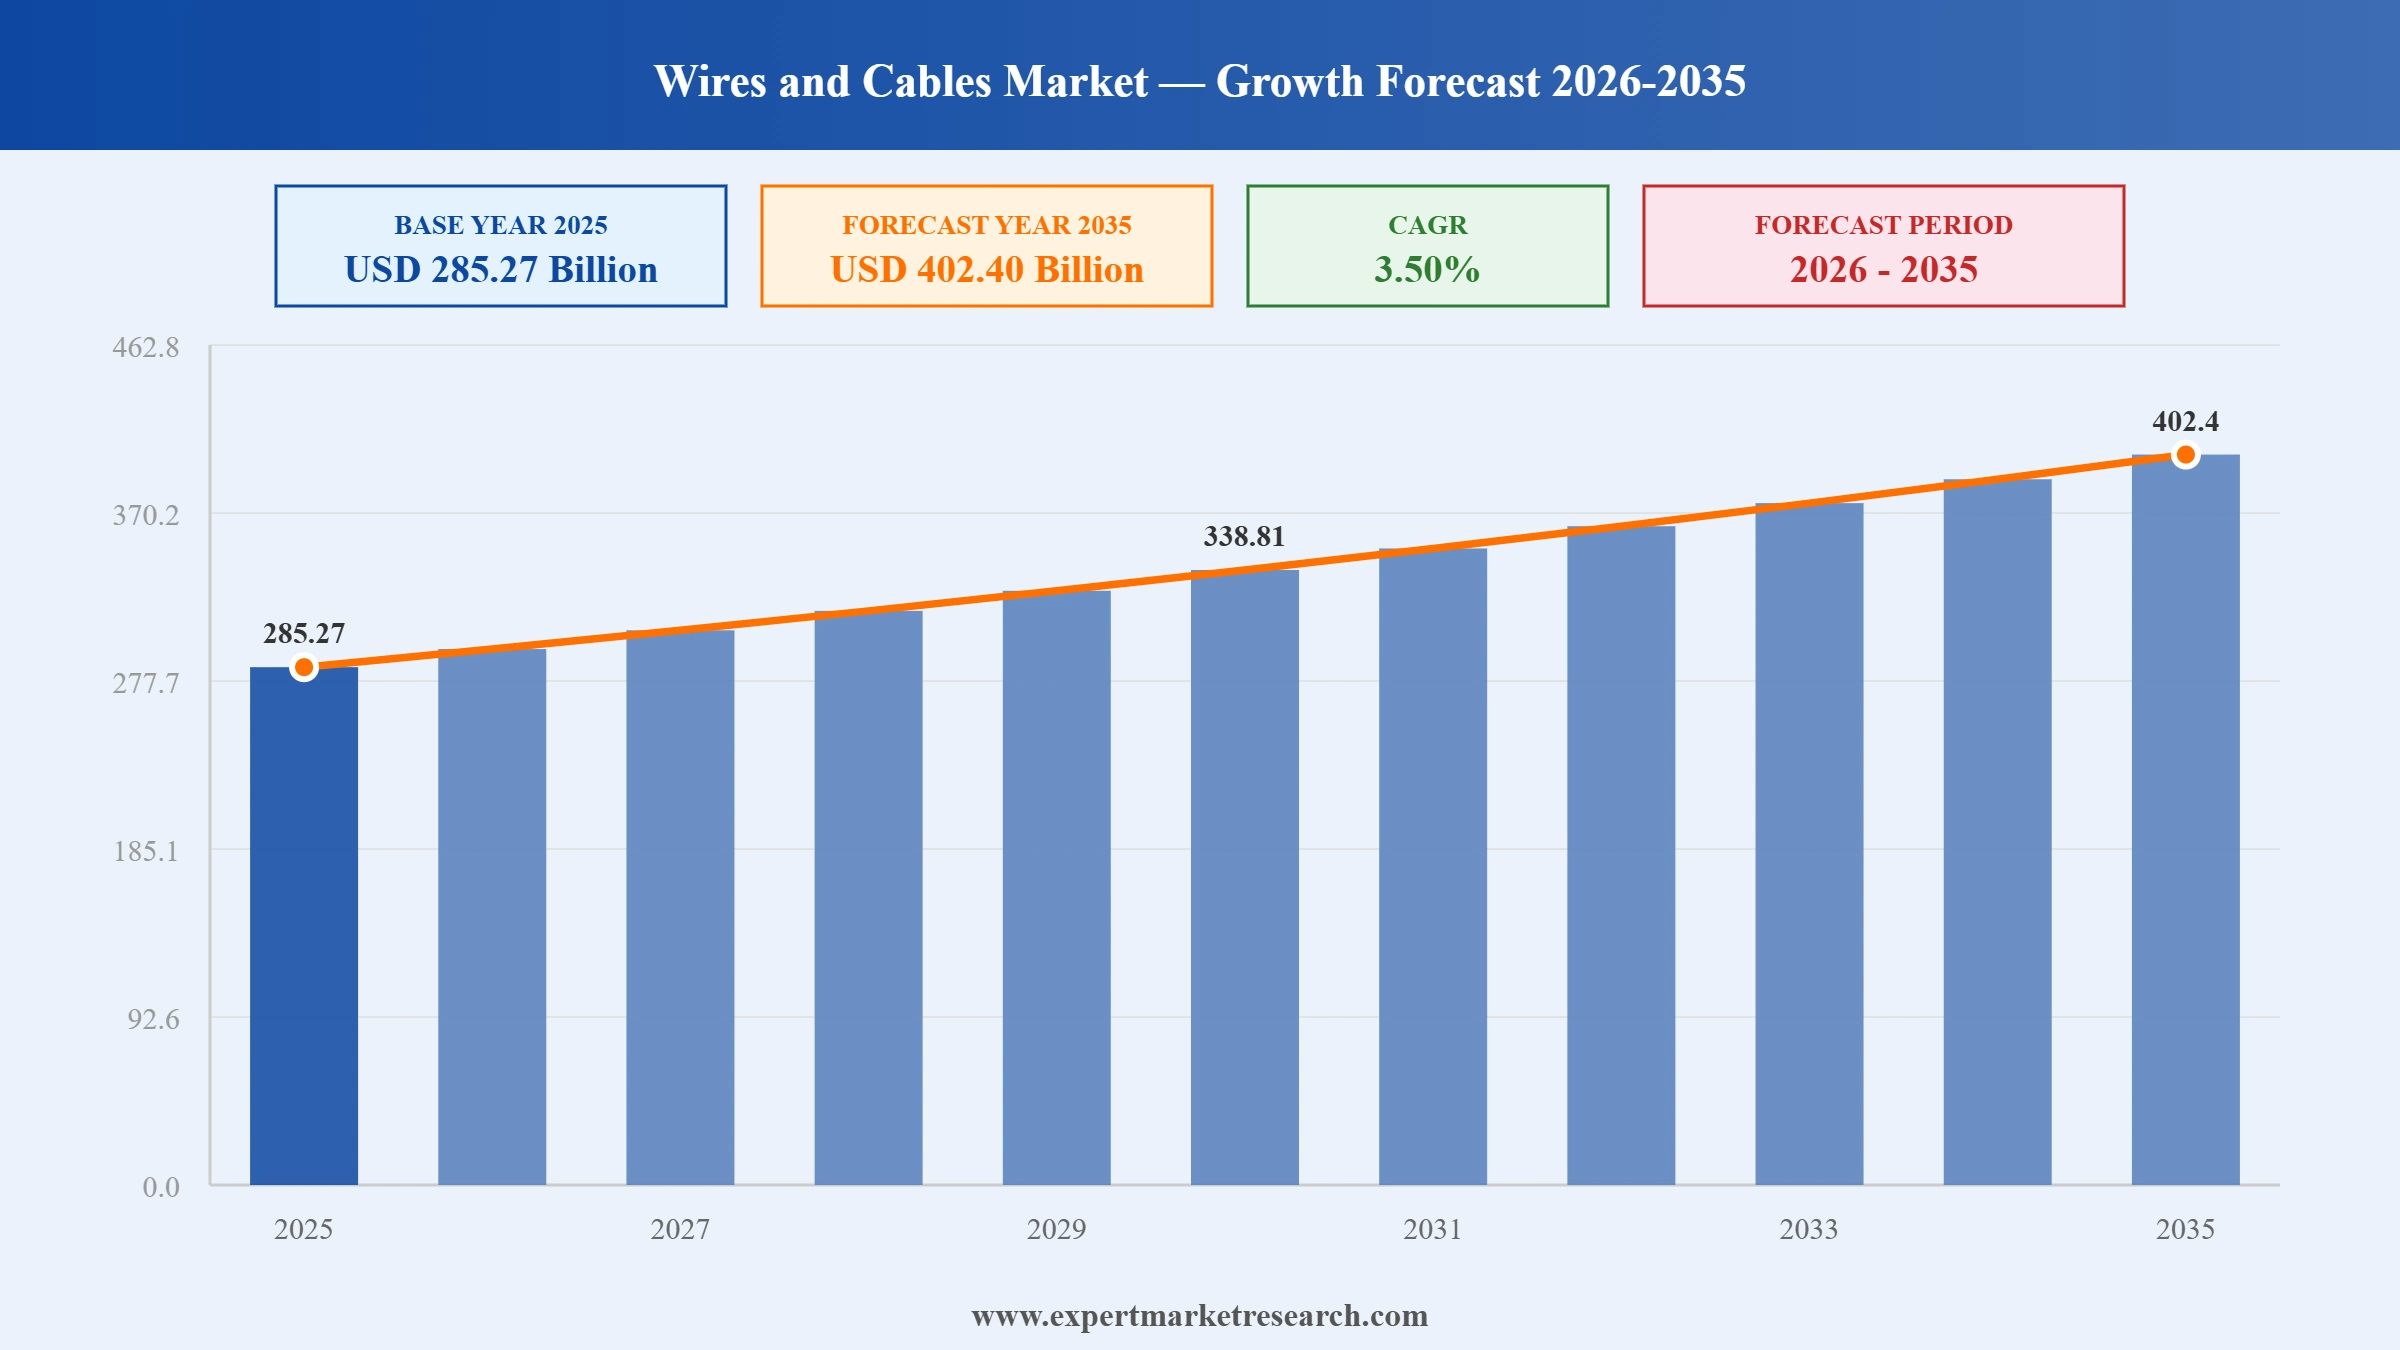
The global wires and cables market reached a value of USD 285.27 Billion at 2025 and is projected to expand at a CAGR of around 3.50% during the forecast period of 2026-2035. With rapid expansion of renewable energy installations driving high-voltage cable demand, growing 5G and data centre infrastructure investment boosting optical fibre cable uptake, accelerating electric vehicle adoption creating new wiring requirements, and rising urbanisation in emerging economies generating large-scale building and power distribution cable procurement, the market is expected to reach USD 402.40 Billion by 2035.
Read more about this report - REQUEST FREE SAMPLE COPY IN PDF
The global wires and cables market is undergoing strategic consolidation and capacity expansion as leading manufacturers respond to surging demand from renewable energy, 5G telecommunications, and electric vehicle infrastructure. Major players including Nexans, Sumitomo Electric, and LS Cable and System are securing long-term growth through targeted acquisitions, plant investments, and contract wins across high-growth energy transmission and automotive cable segments.
Nexans signed a definitive agreement to acquire Republic Wire, an Ohio-based low and medium-voltage cable manufacturer generating approximately EUR 520 million in annual sales. The transaction is expected to close in early Q3 2026, establishing Nexans with an integrated North American manufacturing and distribution platform targeting data centres, residential, and commercial cable segments in the global wires and cables market.
Motherson acquired Nexans SA's Autoelectric wiring harness business for EUR 207 million, enabling Nexans to sharpen its electrification strategy. The deal transferred manufacturing facilities serving global automotive clients, reflecting broader consolidation in the global wires and cables market as producers refocus on high-value energy transmission and electrification segments while divesting peripheral businesses.
Sumitomo Electric Industries secured a contract to supply 525kV HVDC cable systems for the UK Sea Link project, strengthening its European high-voltage subsea cable presence. This contract highlights the growing commercial demand for advanced high-voltage transmission solutions within the global wires and cables market, driven by offshore wind integration and cross-border interconnection investment across Europe.
LS Cable and System announced a USD 689 million investment to establish a new cable manufacturing facility in Virginia, USA, significantly expanding its North American production footprint. The plant targets power and energy cable applications for renewable energy projects and grid modernisation programmes, reflecting the strategic importance of the North American energy cable market within the global wires and cables market.
The accelerating global shift to renewable energy, particularly offshore wind installations, is generating strong structural demand for high-voltage submarine and transmission cables. Growing government mandates for clean electricity, offshore wind farm commissioning pipelines, and solar energy grid connection requirements are creating long-term procurement visibility for cable manufacturers operating in the global wires and cables market through 2035.
The global rollout of 5G telecommunications infrastructure is driving substantial procurement of optical fibre cables for base station connections, urban fibre backbone networks, and rural broadband expansion. Data centre construction, cloud computing investment, and smart city programmes are reinforcing optical fibre as the fastest-growing material segment and directly contributing to global wires and cables market growth.
The rapid growth of electric vehicle production globally is creating new demand for high-performance onboard wiring harnesses, battery management wiring systems, and EV charging cables. Automotive cables require superior thermal resistance, electromagnetic shielding, and flexibility compared to conventional vehicles, establishing a structurally new and technically demanding demand category within the global wires and cables market.
National grid modernisation programmes across North America, Europe, and Asia Pacific are requiring greater cable network density, upgraded conductor specifications, and digital monitoring integration. Government infrastructure investment through programmes such as the United States Bipartisan Infrastructure Law is creating sustained procurement demand across the energy and power and building and construction end-use segments of the global wires and cables market.
Rapid urbanisation across developing economies, combined with large-scale government infrastructure investment in roads, transit, hospitals, and utilities, is generating sustained baseline demand for power and data cables. India's National Infrastructure Pipeline and Southeast Asian development programmes represent significant long-term procurement drivers underpinning volume growth across all cable categories in the global wires and cables market through 2035.
The report of the Expert Market Research's titled "Global Wires and Cables Market Report and Forecast 2026-2035" offers a detailed analysis of the market based on the following segments:
Market Breakup by Voltage
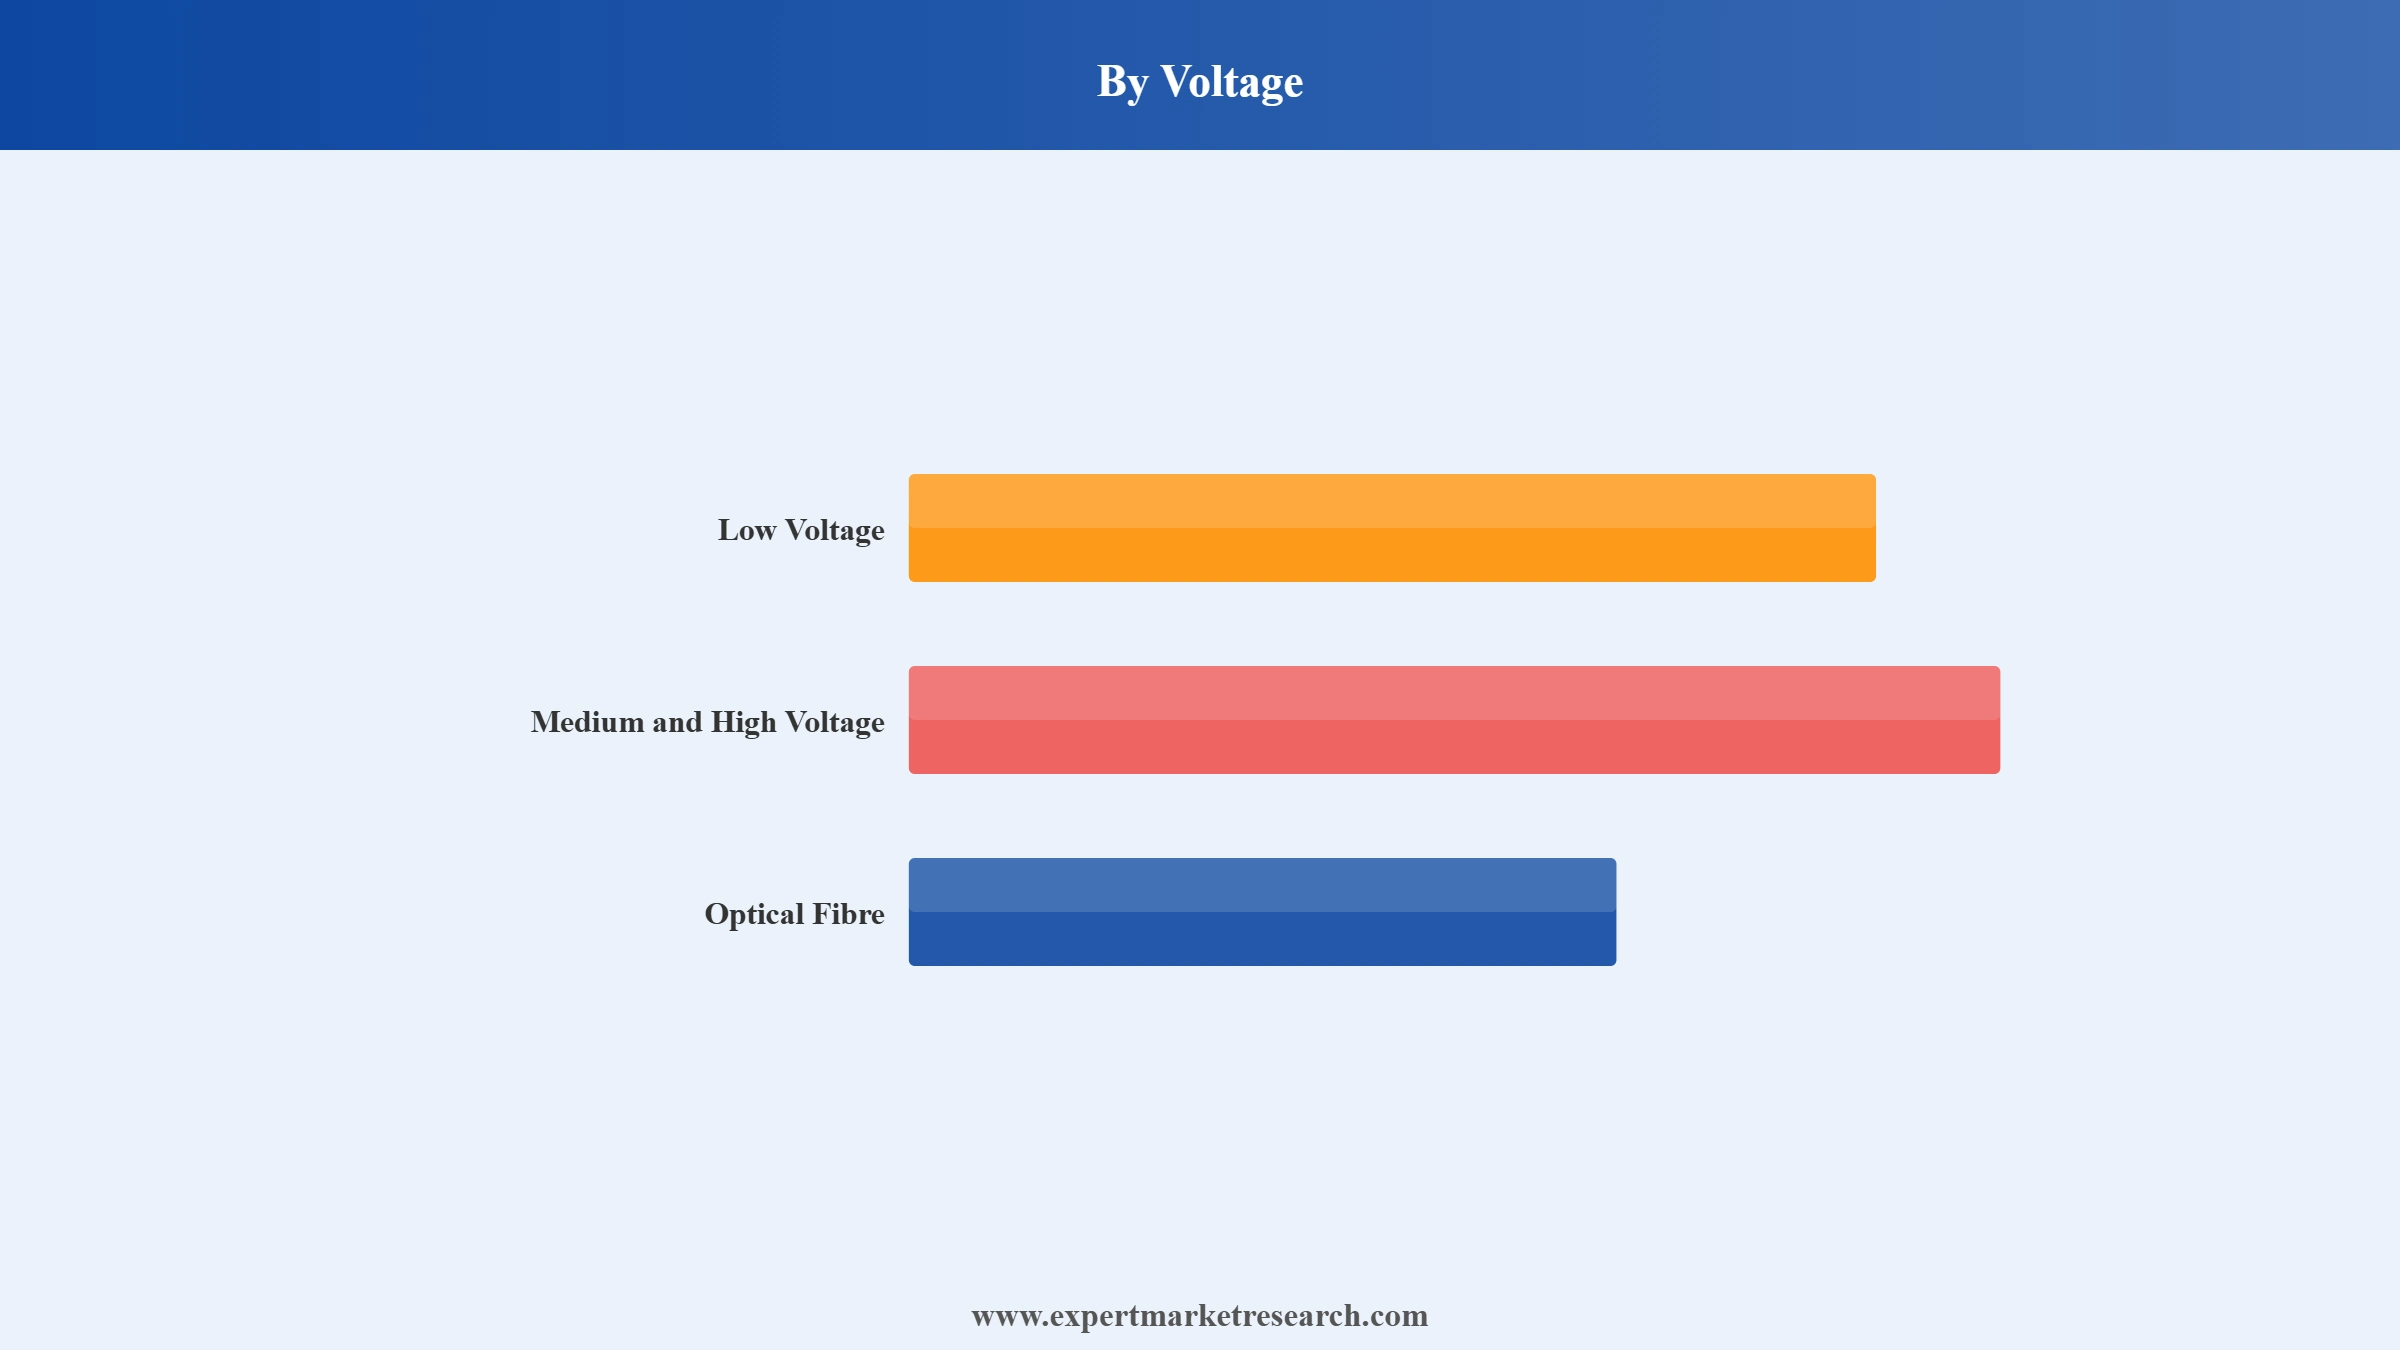
Key Insight: The low voltage segment leads the global wires and cables market, underpinned by the vast scale of residential, commercial, and industrial wiring demand worldwide. Medium and high voltage cables are the fastest-growing sub-segment, fuelled by renewable energy grid connections and national transmission network upgrades. Optical fibre is experiencing rapid growth driven by 5G network deployments, fibre-to-the-home broadband rollouts, and data centre interconnection demand globally.
Market Breakup by Material
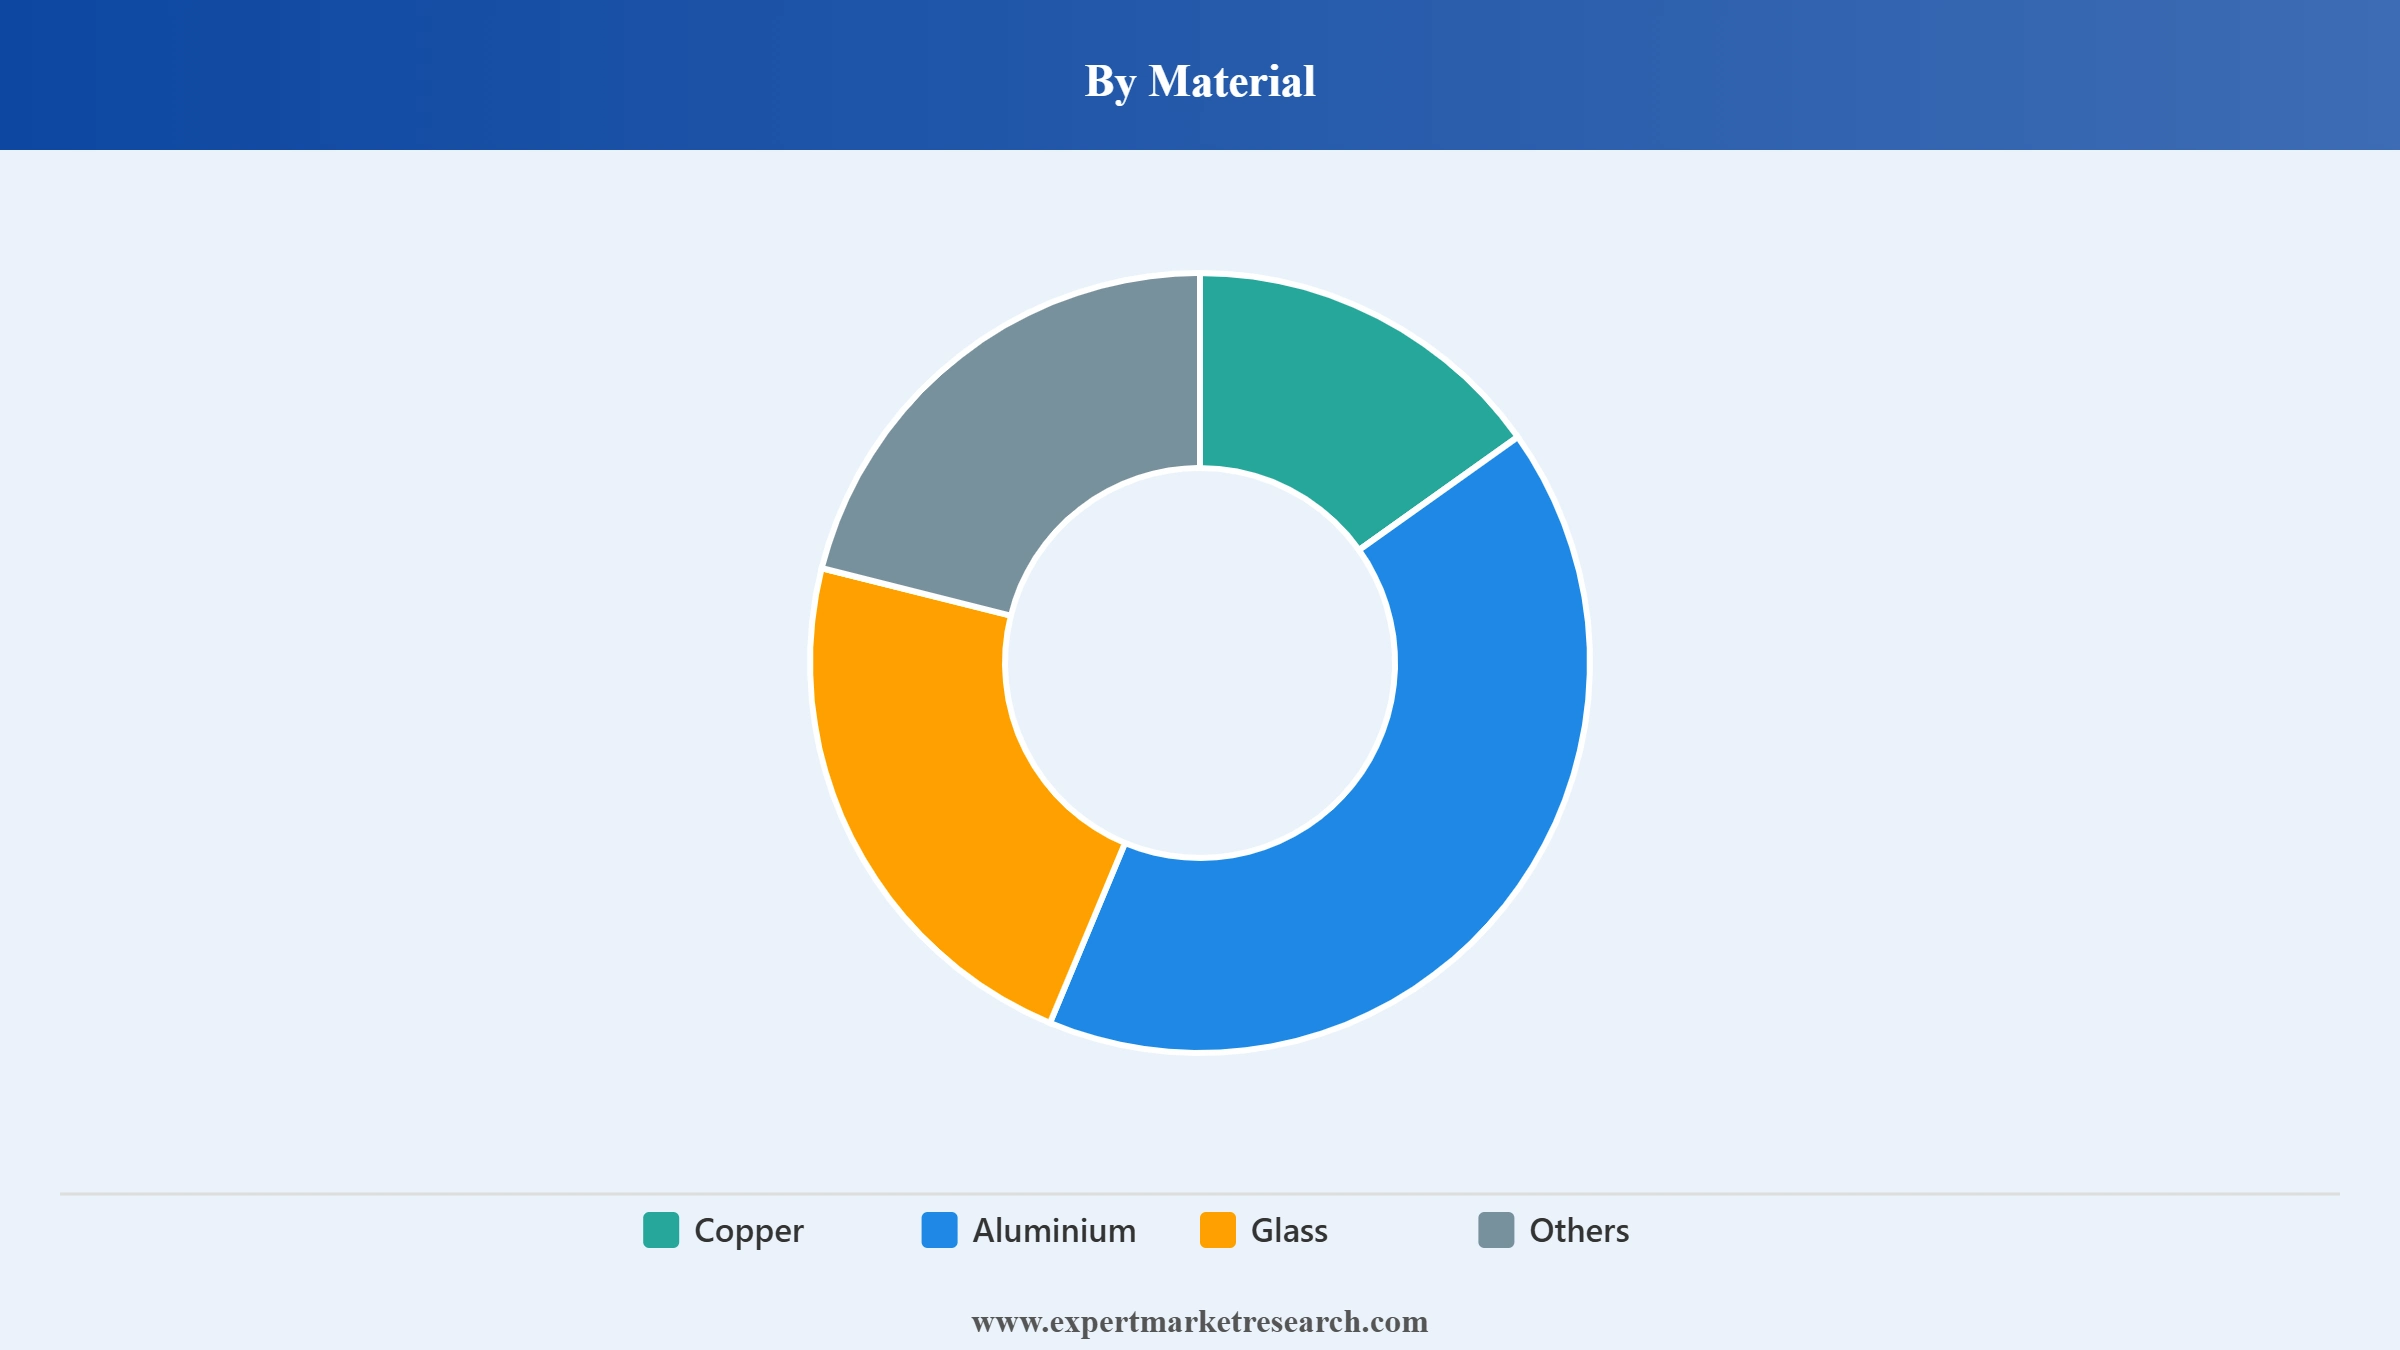
Key Insight: Copper commands the dominant material share of the global wires and cables market, valued for its superior electrical conductivity approximately 60% higher than aluminium, thermal stability, and long service life across power transmission and data applications. Aluminium provides a cost-competitive alternative in large-scale overhead transmission lines. Glass (optical fibre) is the fastest-growing material, accelerated by 5G, data centres, and fibre broadband infrastructure globally.
Market Breakup by End Use
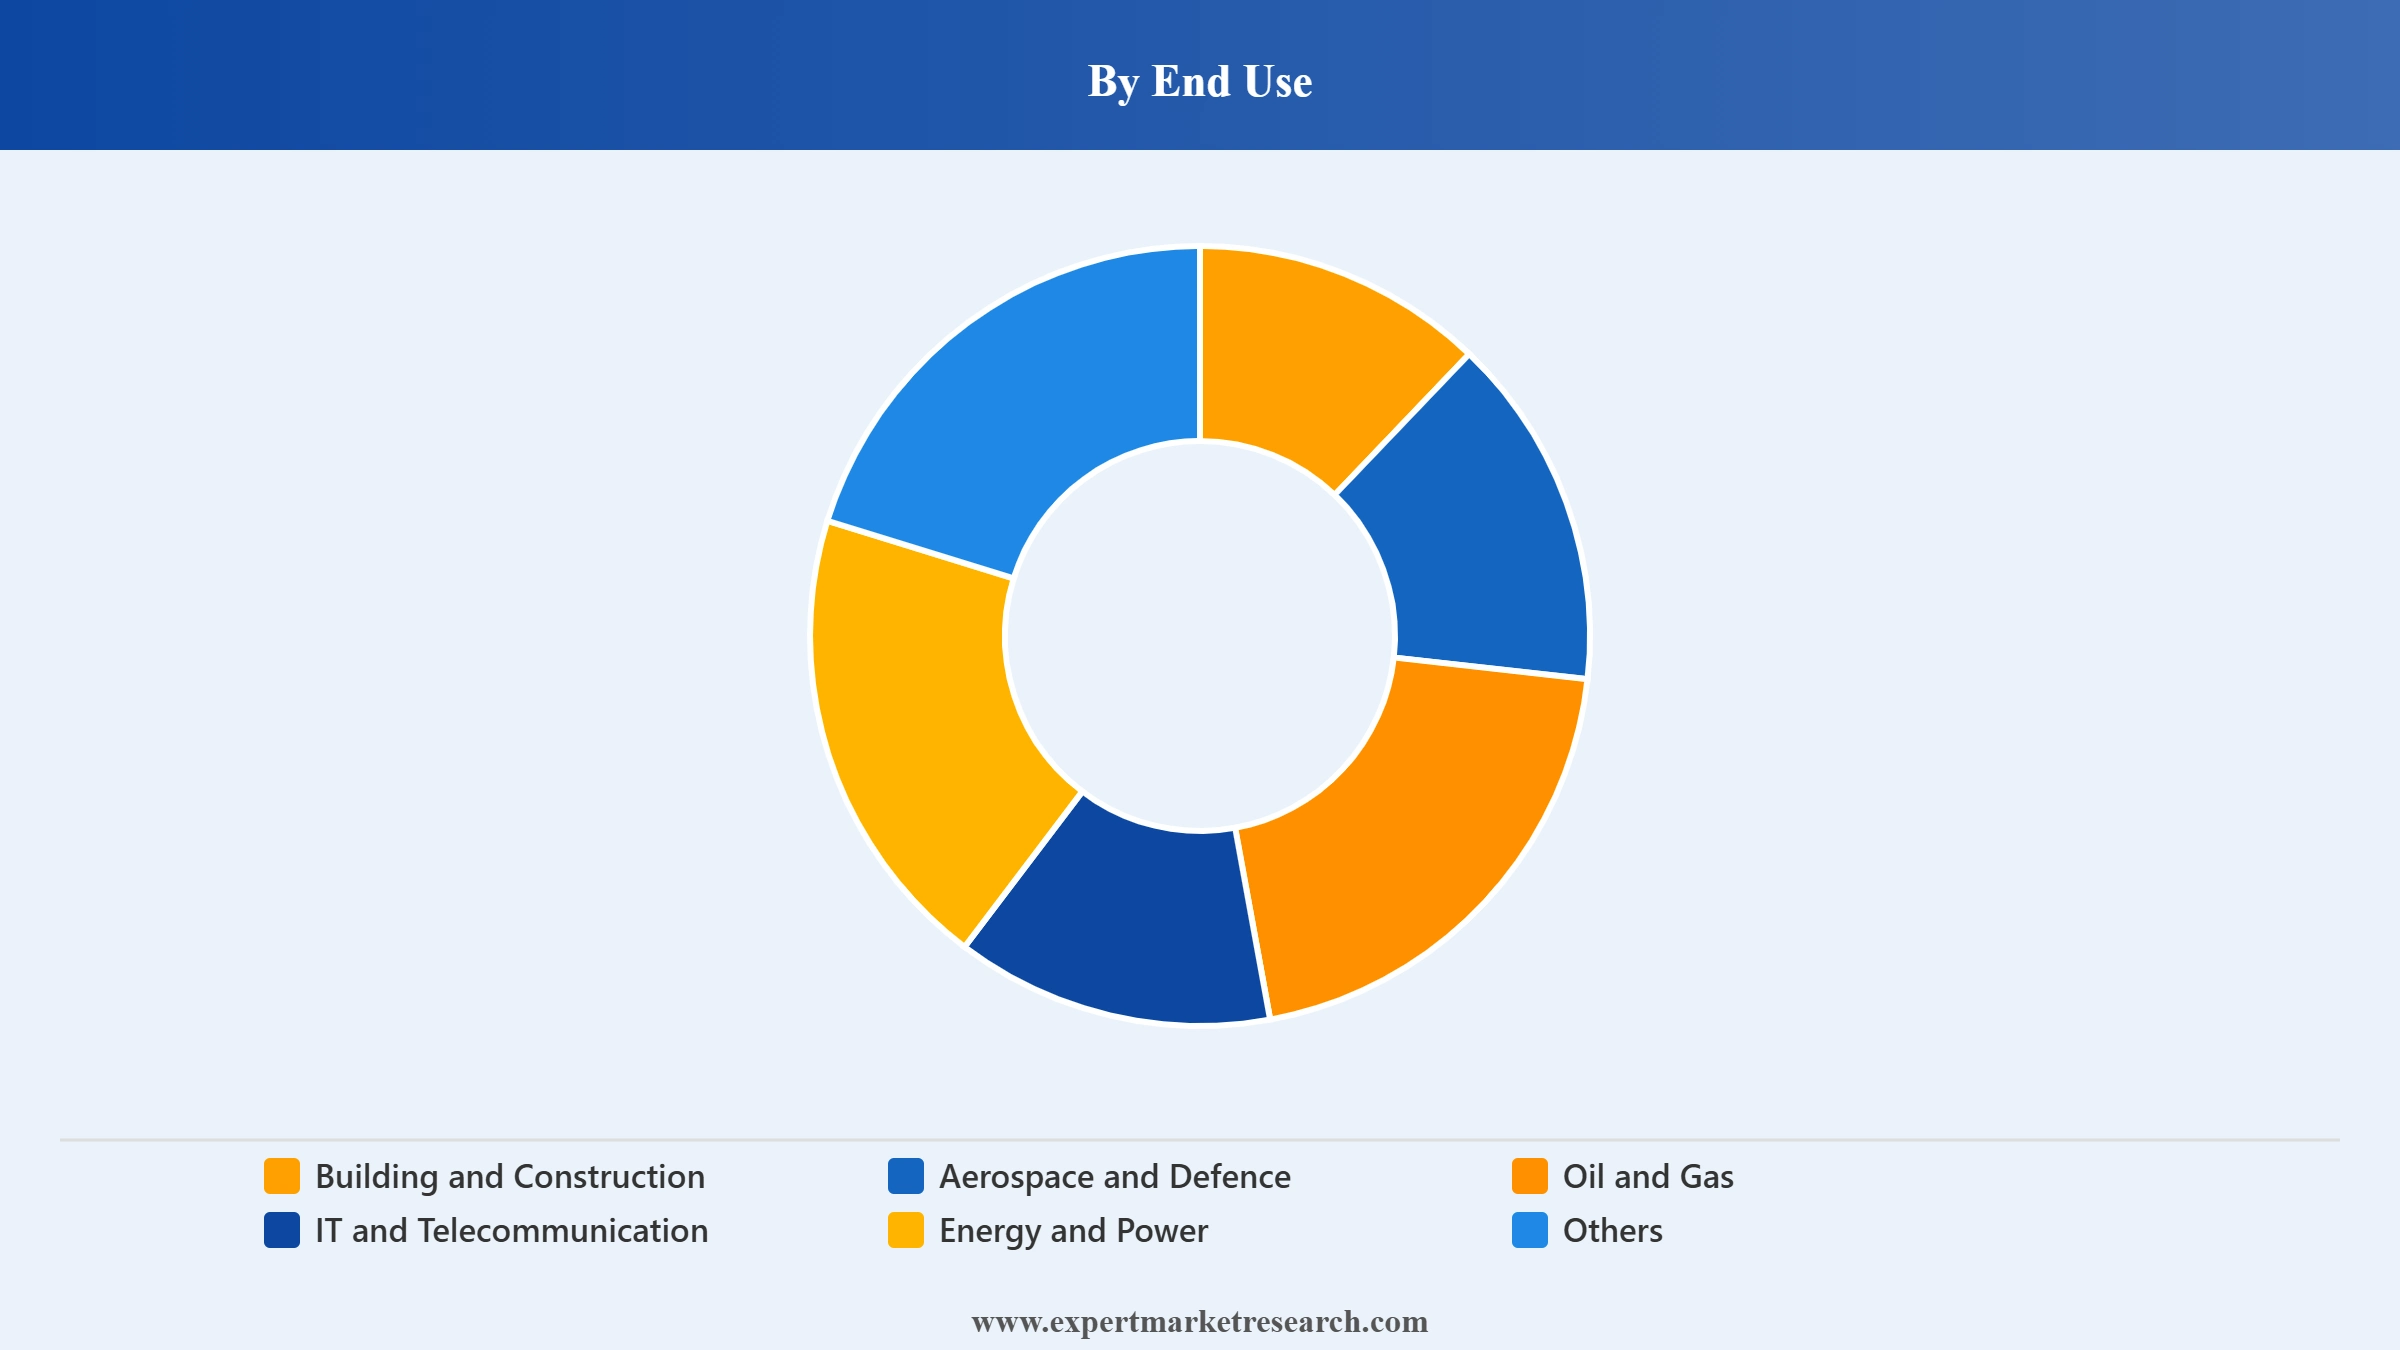
Key Insight: Building and construction is the largest end-use segment in the global wires and cables market, accounting for approximately 35-40% of total demand through residential, commercial, and industrial wiring. Energy and power is the fastest-growing segment driven by grid modernisation, renewable energy integration, and EV charging infrastructure. IT and telecommunication is a rapidly growing segment fuelled by 5G, cloud, and data centre investment globally.
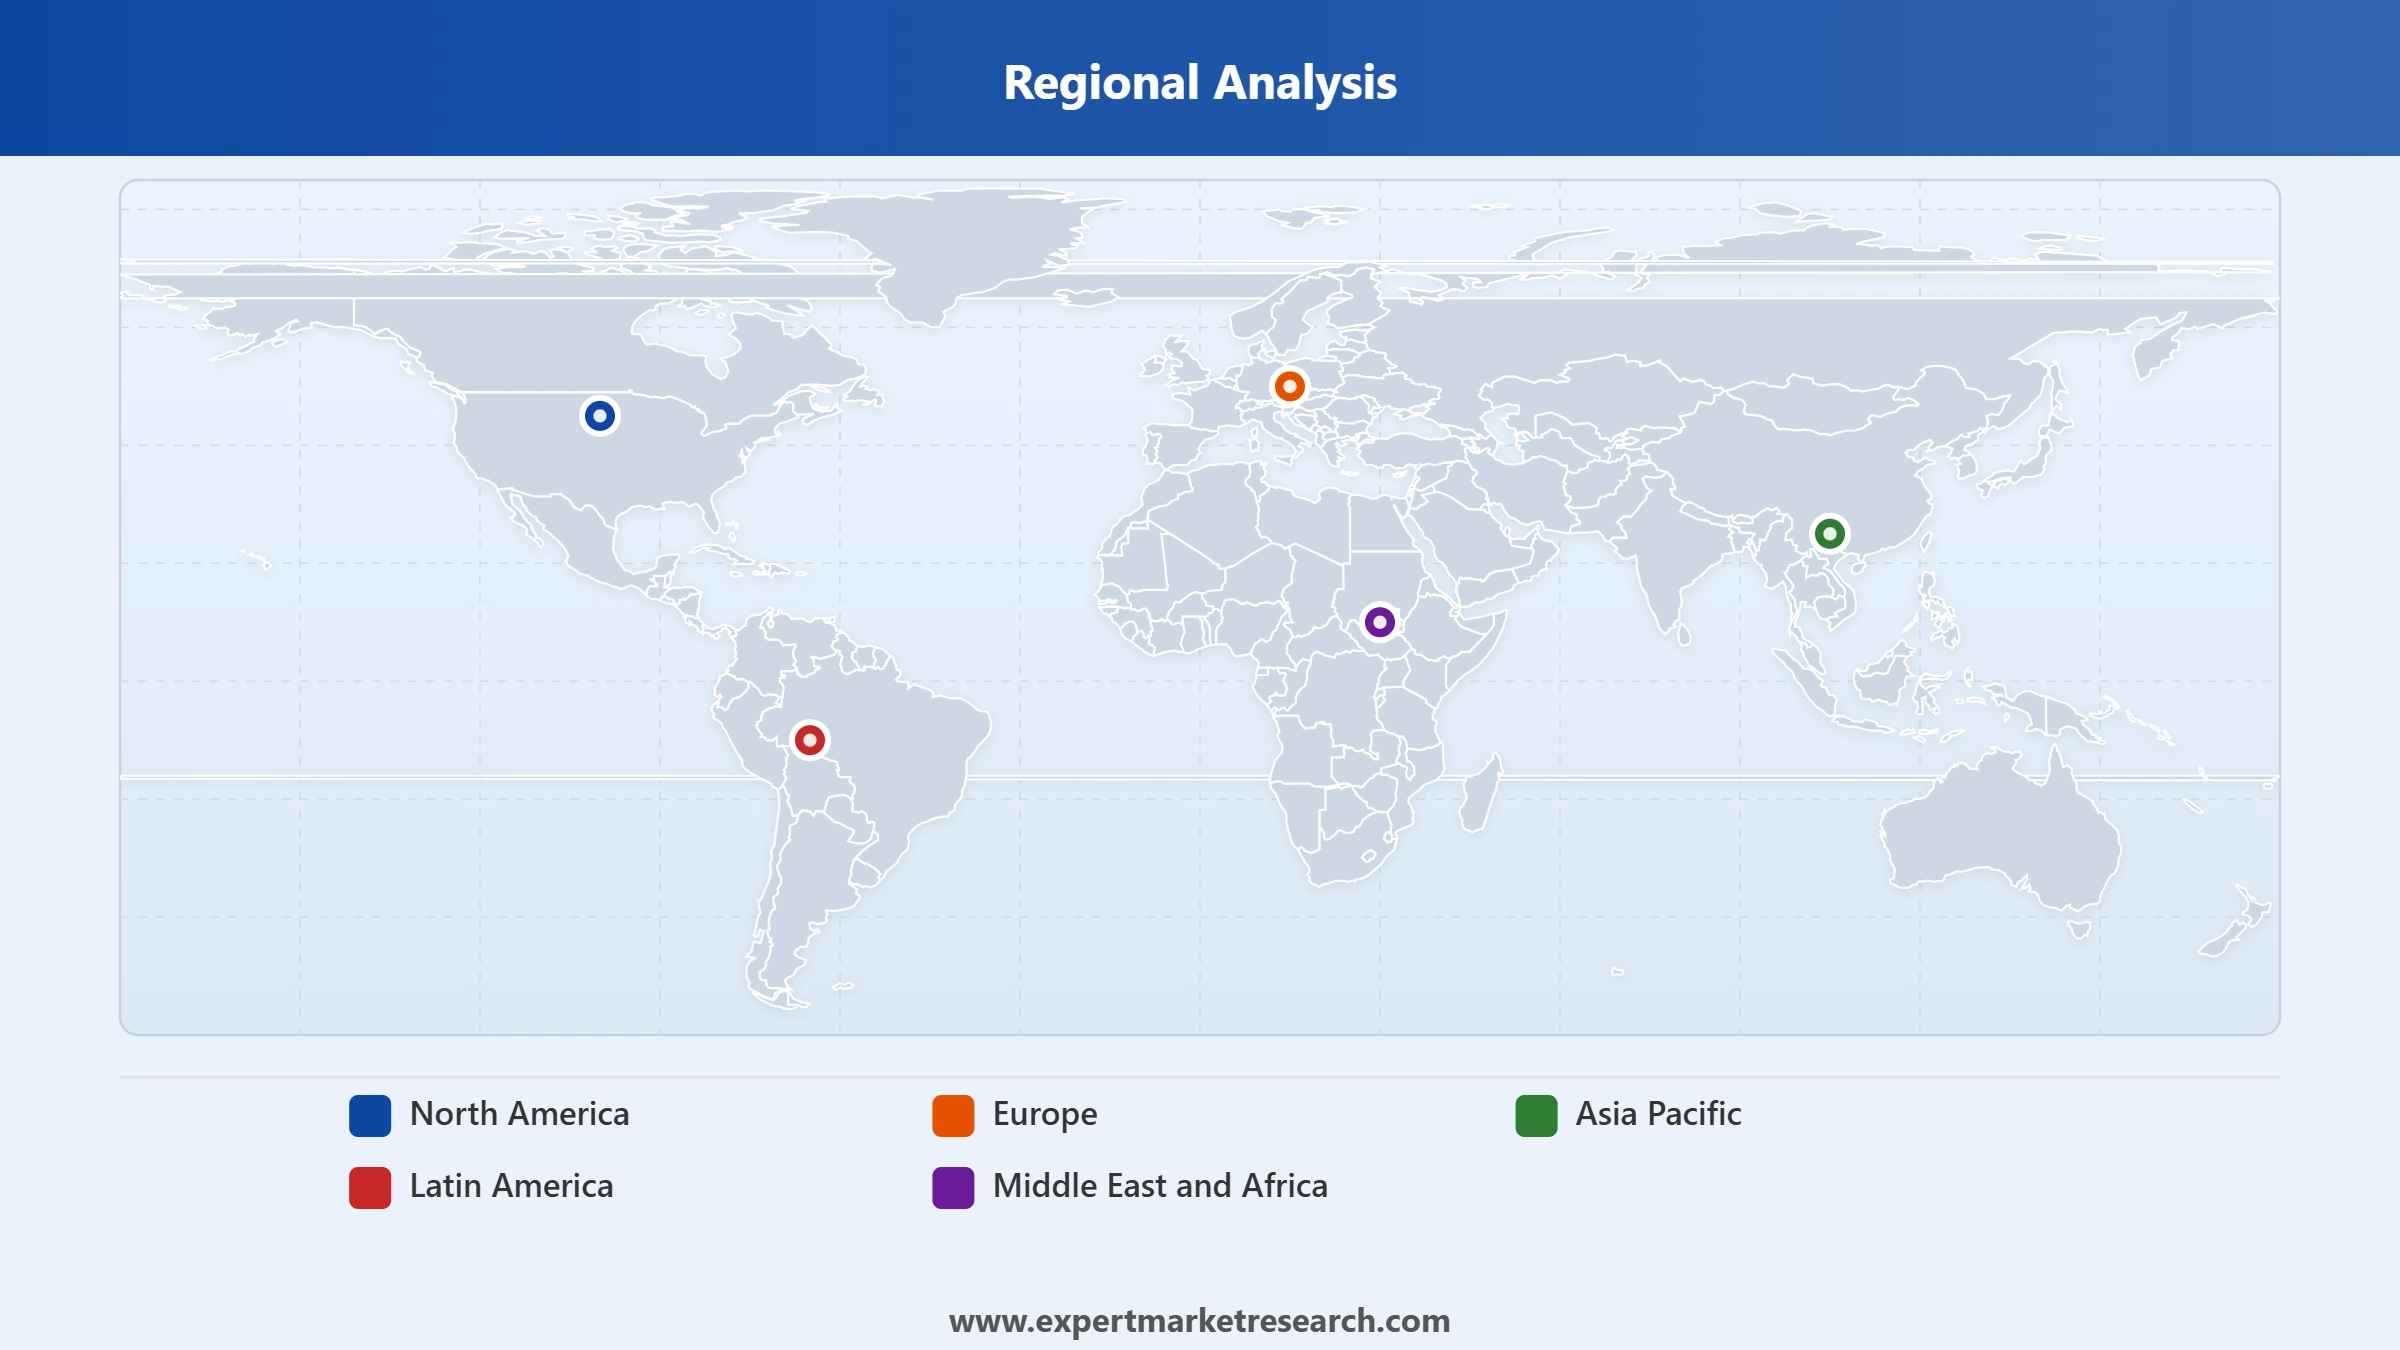
Market Breakup by Region
Key Insight: ASIA PACIFIC accounts for the dominant regional share of the global wires and cables market, representing over 50% of global volume driven by China's state grid expansion and India's electrification programmes. North America is the second largest region, benefiting from the Bipartisan Infrastructure Law, grid modernisation, and growing renewable energy investment. EUROPE is a high-value region focused on offshore wind and cross-border interconnection cable projects.


Read more about this report - REQUEST FREE SAMPLE COPY IN PDF
By Voltage, low voltage accounts for the dominant share of the market due to its extensive use in residential, commercial, and industrial building wiring applications worldwide.
Low voltage cables form the structural backbone of global electrical infrastructure, encompassing all wiring applications below 1kV including residential lighting, appliance circuits, industrial control systems, and consumer electronics. The scale and diversity of building and construction globally ensures consistently high baseline procurement of low voltage cables. KEI Industries Limited and Belden Inc. serve extensive low voltage cable customer bases across construction, manufacturing, and facility management sectors in the global wires and cables market.
Read more about this report - REQUEST FREE SAMPLE COPY IN PDF
Medium and high voltage cables represent the fastest-growing voltage sub-segment in the global wires and cables market, driven by offshore wind farm grid connections, cross-border electricity transmission, and national grid modernisation programmes. In July 2025, LS Cable and System committed USD 689 million to a new Virginia facility targeting this segment, and Sumitomo Electric secured the UK Sea Link 525kV HVDC contract in August 2025, demonstrating the substantial commercial momentum in high-voltage cable procurement across Europe and North America.
By Material, copper accounts for the dominant share of the market due to its superior electrical conductivity and broad application across all cable types and end uses.
Copper cables command the largest material share in the global wires and cables market across all voltage and application categories. Copper's electrical conductivity of approximately 5.96 x 10^7 S/m makes it the default choice for power cables, building wiring, automotive harnesses, and data transmission cables where performance and reliability are paramount. Prysmian S.p.A. and Nexans S.A. both maintain comprehensive copper cable product ranges spanning low, medium, and high voltage classifications serving global markets.
Read more about this report - REQUEST FREE SAMPLE COPY IN PDF
Aluminium is gaining market share as a cost-competitive material in overhead transmission lines and large-scale distribution cables where weight and cost advantages are prioritised. Glass (optical fibre) represents the fastest-growing material in the global wires and cables market, with demand accelerating through 5G network densification, cloud infrastructure, and smart city fibre backbone deployment. Furukawa Electric Co., Ltd. is a major optical fibre cable producer, supplying telecommunications operators and data centre builders across Asia Pacific and beyond.
By End Use, building and construction accounts for the dominant share of the market due to the vast scale of global urbanisation and infrastructure development driving wiring demand.
Building and construction is the largest end-use sector in the global wires and cables market, consuming approximately 35-40% of all cable volumes annually. Rising urbanisation across emerging economies, commercial real estate development, industrial facility construction, and smart building retrofits sustain consistent high-volume procurement of low and medium voltage cables. Leoni AG and KEI Industries Limited serve the construction sector with diverse cable portfolios spanning residential, commercial, and industrial specification ranges.
Read more about this report - REQUEST FREE SAMPLE COPY IN PDF
Energy and power is the fastest-growing end-use segment in the global wires and cables market, driven by the global transition to renewable energy, EV charging infrastructure rollout, and smart grid investment. IT and telecommunication is a high-growth segment propelled by 5G infrastructure build-out and cloud data centre expansion. In September 2025, the acquisition of Nexans Autoelectric by Motherson underlined the strategic importance of the automotive end-use segment as electric vehicle production drives new cable harness demand globally.
Asia Pacific dominates the global wires and cables market due to the region's massive grid expansion programmes, rapid urbanisation, and industrial growth.
Asia Pacific commands over 50% of the global wires and cables market, anchored by China's continuous state grid expansion, India's accelerating power sector investment under the National Infrastructure Pipeline, and ASEAN's rapidly growing construction and energy sectors. China alone accounts for approximately 35-40% of global cable consumption, with state-owned grid operators and independent power producers driving procurement of both domestic and international cable brands including Sumitomo Electric Industries, Ltd. and LS Cable and System Ltd.
Read more about this report - REQUEST FREE SAMPLE COPY IN PDF
North America is a high-value and strategically important region within the global wires and cables market. The United States Bipartisan Infrastructure Law's investments in grid modernisation, EV charging networks, and clean energy transmission are generating sustained procurement demand. In April 2026, Nexans signed its agreement to acquire Republic Wire, establishing an integrated North American cable platform targeting residential, commercial, and data centre applications. In July 2025, LS Cable and System's USD 689 million Virginia investment further demonstrated the market's strategic attractiveness to global cable manufacturers.
The global wires and cables market features a highly competitive landscape with a small number of dominant multinational players supplemented by strong regional manufacturers. Prysmian S.p.A. and Nexans S.A. lead in high-voltage and submarine cable systems, while LS Cable and System Ltd. and Sumitomo Electric command strong positions in energy transmission across Asia Pacific and internationally. The market is characterised by ongoing consolidation as companies acquire regional players and expand manufacturing capacity to capture growing demand from renewable energy and digital infrastructure sectors.
Founded in 1902 and headquartered in Richmond, Virginia, USA, Belden Inc. is a global leader in signal transmission and network infrastructure, producing a broad range of cables and connectivity solutions for industrial automation, enterprise, and broadcast applications. Belden serves clients across manufacturing, oil and gas, IT infrastructure, and media sectors with high-performance cable systems. The company operates manufacturing facilities across North America, Europe, and Asia Pacific, providing global supply chain capability within the global wires and cables market.
Founded in 1884 and headquartered in Tokyo, Japan, Furukawa Electric Co., Ltd. is a global producer of wires, cables, and optical fibre systems serving the energy, telecommunications, and automotive sectors. The company is a major supplier of optical fibre cables globally and operates production facilities across Asia, the Americas, and Europe. Furukawa Electric serves telecommunications operators, grid infrastructure builders, and automotive manufacturers with specialised cable solutions across the global wires and cables market.
Founded in 1962 and headquartered in Anyang, South Korea, LS Cable and System Ltd. is one of the world's leading cable manufacturers, producing power, telecom, and industrial cables for domestic and international markets. In July 2025, the company announced a USD 689 million investment in a new Virginia, USA manufacturing plant, reinforcing its North American market presence. LS Cable and System serves utilities, renewable energy developers, and infrastructure builders across Asia Pacific, North America, and Europe within the global wires and cables market.
Founded in 2000 and headquartered in Paris, France, Nexans S.A. is a global leader in electrification infrastructure, producing cables and cable systems for energy transmission, buildings, and industrial applications. In April 2026, Nexans signed an agreement to acquire Republic Wire in Ohio, USA, establishing an integrated North American low and medium-voltage cable platform. Nexans operates manufacturing facilities across Europe, the Americas, and the Middle East, serving utilities, offshore wind developers, and industrial clients within the global wires and cables market.
Other key players in the market are Hitachi Ltd., KEI Industries Limited, Leoni AG, Prysmian S.p.A., Sumitomo Electric Industries, Ltd., and Others.
*Please note that this is only a partial list; the complete list of key players is available in the full report. Additionally, the list of key players can be customized to better suit your needs.*
Explore the growth opportunities in the global wires and cables industry from 2026 with our comprehensive market report. Gain intelligence on the fastest-growing cable segments, regional demand dynamics, key player strategies, and structural growth drivers reshaping the market. Whether you are a cable manufacturer, energy infrastructure investor, or technology supplier, this report provides the clarity you need. Download your free sample today and discover the key opportunities in the thriving global wires and cables industry through 2035.
Asia Pacific Wires and Cables Market
Europe Wires and Cables Market
United Kingdom Wires and Cables Market
Upto 15% Off
USD
$2499 $2249
$3999 $3599
$4999 $4249
$5999 $5099


*While we strive to always give you current and accurate information, the numbers depicted on the website are indicative and may differ from the actual numbers in the main report. At Expert Market Research, we aim to bring you the latest insights and trends in the market. Using our analyses and forecasts, stakeholders can understand the market dynamics, navigate challenges, and capitalize on opportunities to make data-driven strategic decisions.*
In 2025, the market reached an approximate value of USD 285.27 Billion.
The market is projected to grow at a CAGR of 3.50% between 2026 and 2035.
The industry is expected to expand in the forecast period to reach USD 402.40 Billion by 2035.
Key strategies driving the market include technological innovation, renewable energy integration, smart infrastructure development, capacity expansion, recycling initiatives, strategic partnerships, and regional diversification to meet rising global demand.
The increased investments in smart grids and power transmission and distribution systems is expected to define the market growth in the coming years.
North America, Latin America, Middle East and Africa, Europe, Asia Pacific are the major regions in the market.
The major voltage segments in the market are low voltage, medium and high voltage, and optical fibre.
The leading materials of wires and cables in the industry are copper, aluminium, and glass, among others.
The major end-use segments in the industry are building and construction, aerospace and defence, oil and gas, IT and telecommunication, and energy and power, among others.
The key players in the market report include Belden Inc., Furukawa Electric Co., Ltd., Hitachi Ltd., KEI Industries Limited, Leoni AG, LS Cable & System Ltd., Nexans S.A., Prysmian S.p.A, and Sumitomo Electric Industries, Ltd., among others.
North America dominates the market led by smart grid modernization, EV infrastructure, and data centre growth.
Explore our key highlights of the report and gain a concise overview of key findings, trends, and actionable insights that will empower your strategic decisions.
| REPORT FEATURES | DETAILS |
| Base Year | 2025 |
| Historical Period | 2019-2025 |
| Forecast Period | 2026-2035 |
| Scope of the Report |
Historical and Forecast Trends, Industry Drivers and Constraints, Historical and Forecast Market Analysis by Segment:
|
| Breakup by Voltage |
|
| Breakup by Material |
|
| Breakup by End Use |
|
| Breakup by Region |
|
| Market Dynamics |
|
| Competitive Landscape |
|
| Companies Covered |
|
| Report Price and Purchase Option | Explore our purchase options that are best suited to your resources and industry needs. |
| Delivery Format | Delivered as an attached PDF and Excel through email, with an option of receiving an editable PPT, according to the purchase option. |
Datasheet
One User
USD 2,499
USD 2,249
tax inclusive*
Single User License
One User
USD 3,999
USD 3,599
tax inclusive*
Five User License
Five User
USD 4,999
USD 4,249
tax inclusive*
Corporate License
Unlimited Users
USD 5,999
USD 5,099
tax inclusive*
*Please note that the prices mentioned below are starting prices for each bundle type. Kindly contact our team for further details.*
Flash Bundle
Small Business Bundle
Growth Bundle
Enterprise Bundle
*Please note that the prices mentioned below are starting prices for each bundle type. Kindly contact our team for further details.*
Flash Bundle
Number of Reports: 3
20%
tax inclusive*
Small Business Bundle
Number of Reports: 5
25%
tax inclusive*
Growth Bundle
Number of Reports: 8
30%
tax inclusive*
Enterprise Bundle
Number of Reports: 10
35%
tax inclusive*
How To Order

Select License Type
Choose the right license for your needs and access rights.

Click on ‘Buy Now’
Add the report to your cart with one click and proceed to register.

Select Mode of Payment
Choose a payment option for a secure checkout. You will be redirected accordingly.
Strategic Solutions for Informed Decision-Making
Gain insights to stay ahead and seize opportunities.

Get insights & trends for a competitive edge.

Track prices with detailed trend reports.

Analyse trade data for supply chain insights.

Leverage cost reports for smart savings

Enhance supply chain with partnerships.

Connect For More Information
Our expert team of analysts will offer full support and resolve any queries regarding the report, before and after the purchase.
Our expert team of analysts will offer full support and resolve any queries regarding the report, before and after the purchase.
We employ meticulous research methods, blending advanced analytics and expert insights to deliver accurate, actionable industry intelligence, staying ahead of competitors.
Our skilled analysts offer unparalleled competitive advantage with detailed insights on current and emerging markets, ensuring your strategic edge.
We offer an in-depth yet simplified presentation of industry insights and analysis to meet your specific requirements effectively.


