

Consumer Insights
Uncover trends and behaviors shaping consumer choices today
Procurement Insights
Optimize your sourcing strategy with key market data
Industry Stats
Stay ahead with the latest trends and market analysis.

The Australia financial services market reached USD 13339.63 Billion in 2025. The market is expected to grow at a CAGR of 6.03% between 2026 and 2035, reaching USD 23956.94 Billion by 2035.
Base Year
Historical Period
Forecast Period
In 2023, as per the Australian Banking Association's report, 95 Australian banks supported the expansion of the mutual funds market.
By December 2023, Australia's managed funds sector experienced a $176.6 billion (3.9%) increase, as stated by the Australian Bureau of Statistics, which boosted the Australia financial services demand.
According to the Australia Prudential Regulation Authority's findings, general insurance recorded a net profit after tax of $4.6 billion in 2023.
Compound Annual Growth Rate
6.03%
Value in USD Billion
2026-2035
*this image is indicative*
| Australia Financial Services Market Report Summary | Description | Value |
| Base Year | USD Billion | 2025 |
| Historical Period | USD Billion | 2019-2025 |
| Forecast Period | USD Billion | 2026-2035 |
| Market Size 2025 | USD Billion | 13339.63 |
| Market Size 2035 | USD Billion | 23956.94 |
| CAGR 2019-2025 | Percentage | XX% |
| CAGR 2026-2035 | Percentage | 6.03% |
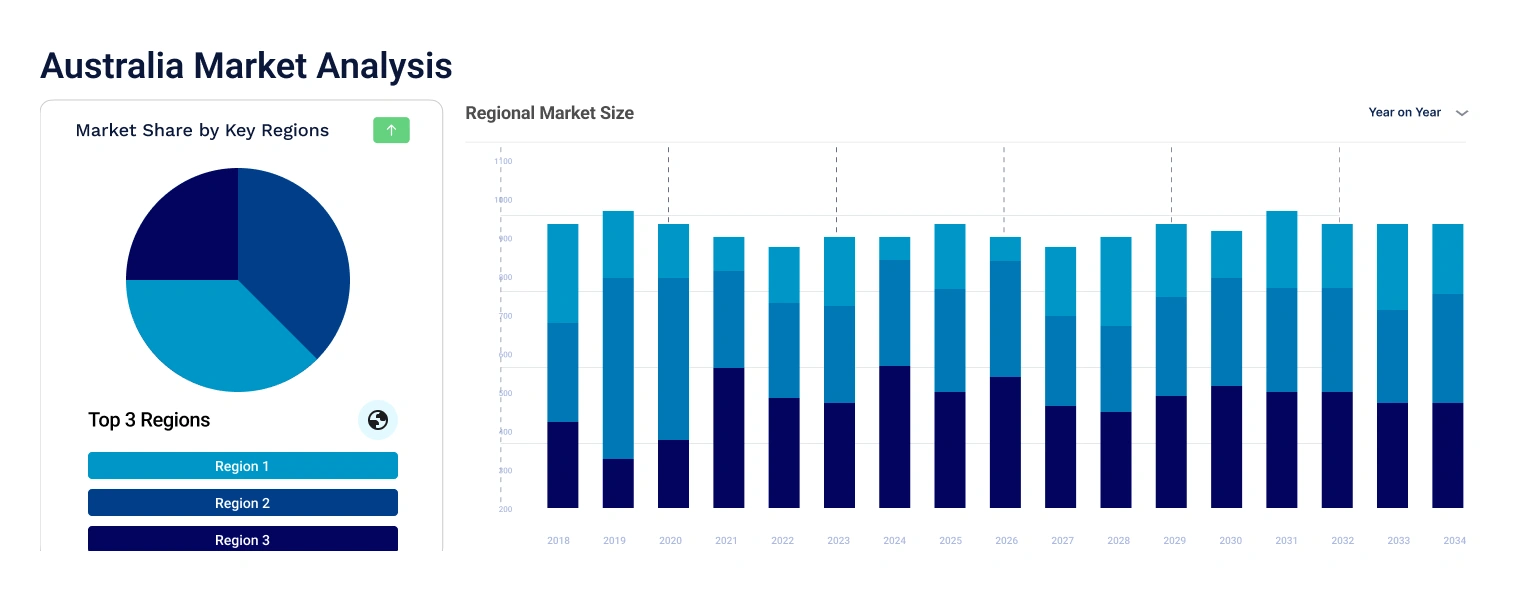
| CAGR 2026-2035 - Market by Region | New South Wales | 6.4% |
| CAGR 2026-2035 - Market by Type | Wealth Management | 6.6% |
| CAGR 2026-2035 - Market by End Use | Business-to-Consumer (B2C) | 7.5% |
Banking contributes to the market growth by serving as intermediaries between depositors and borrowers, thus enabling the smooth flow of funds in the economy
Banks act as financial intermediaries, directing funds from depositors to borrowers, and stimulating economic growth. They provide a range of payment services for smooth transactions and offer risk management products to reduce financial risks, ensuring stability. Regulatory compliance and monetary management contribute to overall financial stability and boost the growth of the Australia financial services market.
Advisory firms provide expert guidance, customized solutions, market insights, and regulatory compliance support. They assist clients in financial decision-making, offering tailored solutions and market analysis. Navigating regulatory frameworks ensures informed decisions, goal achievement, and trust in the financial services industry.
The growing adoption of online banking services is a major trend in Australia financial services market. Moreover, several financial institutions in the country are employing environmental, social, and governance (ESG) in their investment strategies to meet investor demand.
As per the Australia financial services market dynamics and trends, in November 2023, one of Australia's leading businesses, a financial services organization, embraced Oracle Enterprise Performance Management (EPM), particularly the Financial Consolidation and Close (FCC) application. Undertaking a multi-year digital and financial transformation, it executed one of the largest EPM implementations in the Southern Hemisphere.
As per the Australia financial services industry analysis, the Australian Bureau of Statistics stated that consolidated assets of managed funds institutions witnessed an increase of USD 152.1 billion in the December 2023 quarter. The cross invested assets witnessed a growth of 4.5% whereas the unconsolidated assets witnessed a growth of 4.1% in the same time period, which showcased a positive trend in the managed fund sector.
As per the data from March 2024, the total sum of net borrowed in Australia from the rest of the world was around USD 8.3 billion. The main contributors to this sum were the USD 30.2b acquisition by ROW of equity which was issued by Australia and the USD 29.1 billion acquisition by ROW of debt securities issued by Australia, among others, which can impact the Australia financial services industry revenue. The demand for credit was around USD 101.0 billion in the March 2024 quarter, under which households borrowed a sum of USD 31.3 billion, general government an amount of USD 20.5 billion and private non-financial corporations an amount of USD 39.8 billion. Under the household credits, the non-financial assets owned by households witnessed an increase of 2.1% whereas the financial assets of households witnessed an increase of 3.3%.
Wilbur, a provider of insurtech, announced in September 2024 that it has developed innovative AI and Analytics modules for brokers, insurers, and third-party administrators (TPAs), among others. The rising integration of AI into their systems by Australian insurance companies has facilitated the demand for these modules that can reduce the risks of fraud, enhance underwriting practices, and improve claims processing. These modules can also streamline AI operations and reduce the operational cost of insurance services in the long run, aiding the growth of the financial services industry eventually.
"Australia Financial Services Market Report and Forecast 2026-2035" offers a detailed analysis of the market based on the following segments:
Market Breakup by Type
Market Breakup by End Use
Market Breakup by Country
| CAGR 2026-2035 - Market by | Country |
| New South Wales | 6.4% |
| Victoria | 6.2% |
| Queensland | XX% |
| Australian Capital Territory | XX% |
| Western Australia | XX% |
| Others | XX% |
The Australian financial services market key players are:
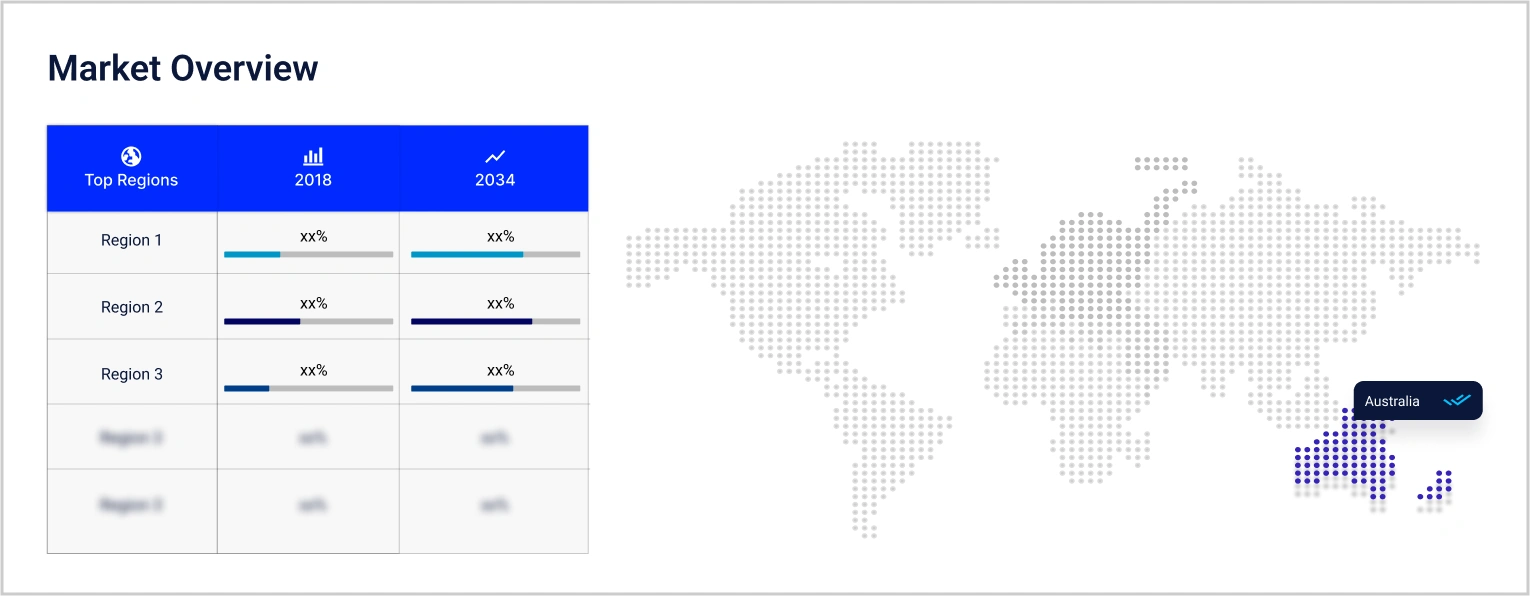
Sydney and Melbourne are two of the most prominent financial centres in the country owing to the presence of a large number of banks, human capital, as well as reputed financial infrastructures, which is expected to boost the demand of Australia financial services market.
United States Financial Services Market


Upto 15% Off
USD
$2499 $2249
$3999 $3599
$4999 $4249
$5999 $5099


*While we strive to always give you current and accurate information, the numbers depicted on the website are indicative and may differ from the actual numbers in the main report. At Expert Market Research, we aim to bring you the latest insights and trends in the market. Using our analyses and forecasts, stakeholders can understand the market dynamics, navigate challenges, and capitalize on opportunities to make data-driven strategic decisions.*
Get in touch with us for a customized solution tailored to your unique requirements and save upto 35%!
The market was valued at USD 13339.63 Billion in 2025.
The market is projected to grow at a CAGR of 6.03% between 2026 and 2035.
The revenue generated from the financial services market is expected to reach USD 23956.94 Billion in 2035.
The financial services market is categorised according to type, which includes banking, wealth management, owner occupied home, and direct investment.
The key players are Goldman Sachs Group Inc., Morgan Stanley & Co. International Plc, Westpac Banking Corp., JP Morgan Chase & Co., American Express Company, Allianz, QBE Insurance Group Ltd., Suncorp Group, HSBC Holdings Plc, and Macquarie Group Limited among others.
The market is broken down into New South Wales, Victoria, Queensland, Australian Capital Territory, Western Australia, and others.
Explore our key highlights of the report and gain a concise overview of key findings, trends, and actionable insights that will empower your strategic decisions.
| REPORT FEATURES | DETAILS |
| Base Year | 2025 |
| Historical Period | 2019-2025 |
| Forecast Period | 2026-2035 |
| Scope of the Report |
Historical and Forecast Trends, Industry Drivers and Constraints, Historical and Forecast Market Analysis by Segment:
|
| Breakup by Type |
|
| Breakup by End Use |
|
| Breakup by Region |
|
| Market Dynamics |
|
| Competitive Landscape |
|
| Companies Covered |
|
Datasheet
One User
USD 2,499
USD 2,249
tax inclusive*
Single User License
One User
USD 3,999
USD 3,599
tax inclusive*
Five User License
Five User
USD 4,999
USD 4,249
tax inclusive*
Corporate License
Unlimited Users
USD 5,999
USD 5,099
tax inclusive*
*Please note that the prices mentioned below are starting prices for each bundle type. Kindly contact our team for further details.*
Flash Bundle
Small Business Bundle
Growth Bundle
Enterprise Bundle
*Please note that the prices mentioned below are starting prices for each bundle type. Kindly contact our team for further details.*
Flash Bundle
Number of Reports: 3
20%
tax inclusive*
Small Business Bundle
Number of Reports: 5
25%
tax inclusive*
Growth Bundle
Number of Reports: 8
30%
tax inclusive*
Enterprise Bundle
Number of Reports: 10
35%
tax inclusive*
How To Order

Select License Type
Choose the right license for your needs and access rights.

Click on ‘Buy Now’
Add the report to your cart with one click and proceed to register.

Select Mode of Payment
Choose a payment option for a secure checkout. You will be redirected accordingly.
Gain insights to stay ahead and seize opportunities.

Get insights & trends for a competitive edge.

Track prices with detailed trend reports.

Analyse trade data for supply chain insights.

Leverage cost reports for smart savings

Enhance supply chain with partnerships.

Connect For More Information
Our expert team of analysts will offer full support and resolve any queries regarding the report, before and after the purchase.
Our expert team of analysts will offer full support and resolve any queries regarding the report, before and after the purchase.
We employ meticulous research methods, blending advanced analytics and expert insights to deliver accurate, actionable industry intelligence, staying ahead of competitors.
Our skilled analysts offer unparalleled competitive advantage with detailed insights on current and emerging markets, ensuring your strategic edge.
We offer an in-depth yet simplified presentation of industry insights and analysis to meet your specific requirements effectively.


Share