

Consumer Insights
Uncover trends and behaviors shaping consumer choices today
Procurement Insights
Optimize your sourcing strategy with key market data
Industry Stats
Stay ahead with the latest trends and market analysis.
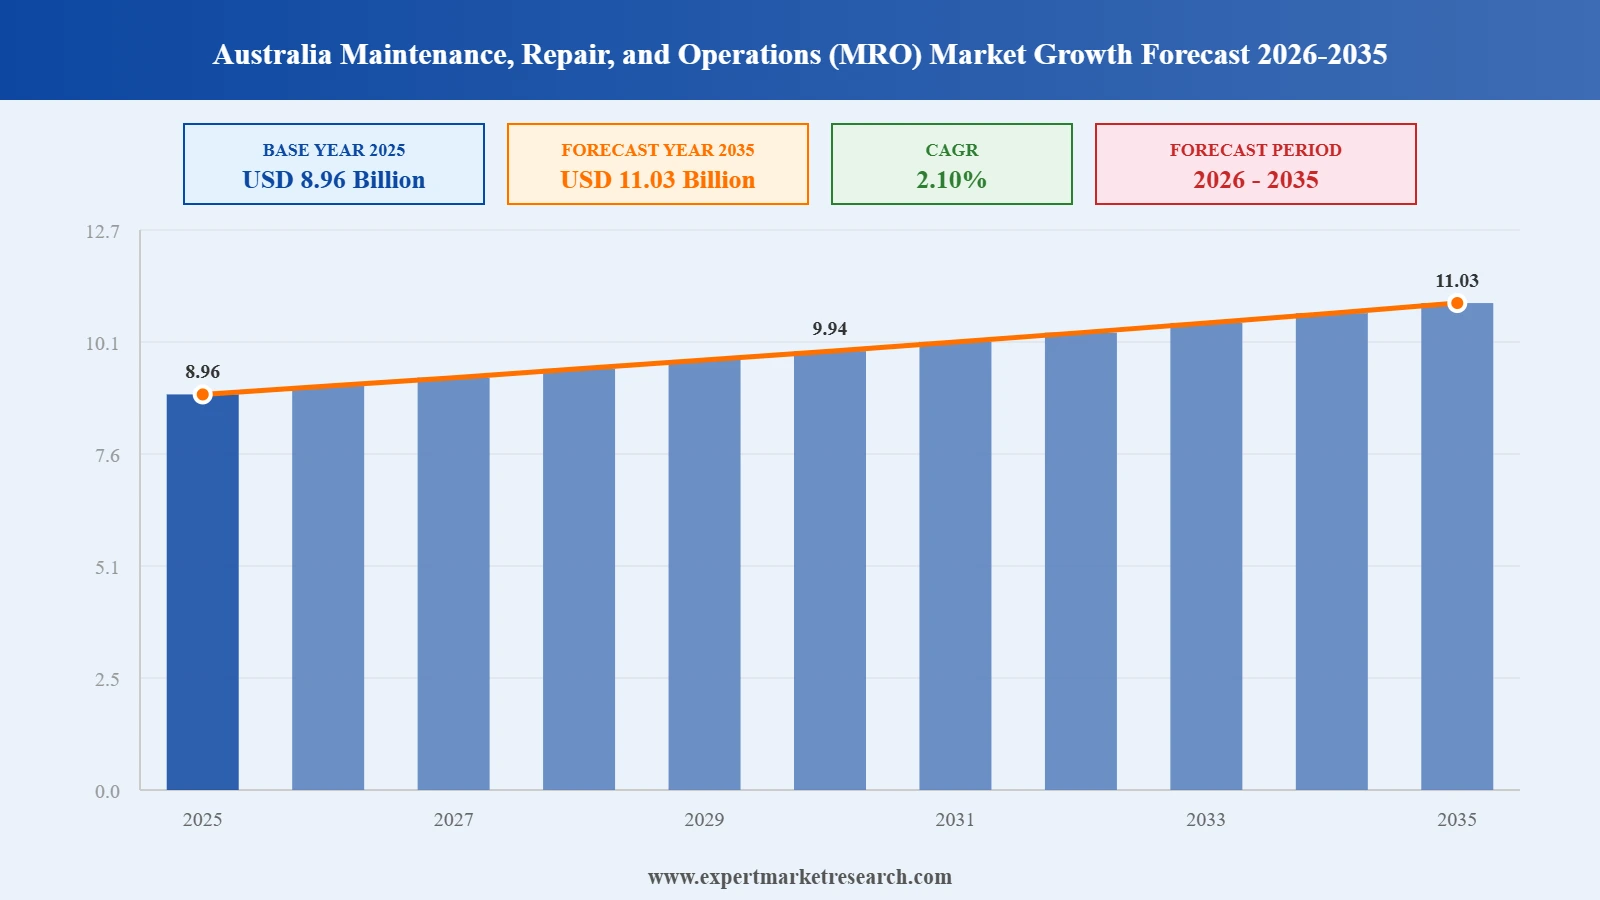
The Australia maintenance, repair, and operations (MRO) market size reached around USD 8.96 Billion in 2025. The market is projected to grow at a CAGR of 2.10% between 2026 and 2035 to reach nearly USD 11.03 Billion by 2035.
Get a sample of the market report in PDF – REQUEST A FREE SAMPLE
| Australia Maintenance, Repair, and Operations (MRO) Market Report Summary | Description | Value |
| Base Year | USD Billion | 2025 |
| Historical Period | USD Billion | 2019-2025 |
| Forecast Period | USD Billion | 2026-2035 |
| Market Size 2025 | USD Billion | 8.96 |
| Market Size 2035 | USD Billion | 11.03 |
| CAGR 2019-2025 | Percentage | XX% |
| CAGR 2026-2035 | Percentage | 2.10% |
| CAGR 2026-2035 - Market by Region | New South Wales | 2.4% |
| CAGR 2026-2035 - Market by Region | Western Australia | 2.0% |
| CAGR 2026-2035 - Market by MRO Type | Industrial MRO | 2.3% |
| CAGR 2026-2035 - Market by Providers | Aftermarket | 2.3% |
| Market Share by Region | Queensland | 11.3% |
Australia has nearly 15.2 million buildings. New South Wales accounts for a share of 27.8% of all the buildings in Australia, followed closely by Victoria and Western Australia (11.8%). The Eureka Tower in Victoria (Melbourne) is Australia’s tallest residential skyscraper building. As per the Australian Bureau of Statistics, the construction of private dwellings in Australia rose by 4.8% from Q3-FY 2023 to Q4-FY 2024. This is expected to accelerate the construction of new residential skyscrapers in urban areas of the country, thereby fuelling the Australia maintenance, repair, and operations (MRO) market expansion.
The anticipated growth of Australia’s aviation industry is also expected to drive the market growth over the forecast period. Engine maintenance currently accounts for nearly 46% of the total MRO demand in Australia, which is around USD 5.7 billion. Over the forecast period, the demand for servicing aircraft components and line maintenance is expected to account for a share of 24% and 18% of the market respectively, while airframe heavy maintenance and other modifications are expected to witness a demand of nearly USD 6 million and USD 8 million, respectively. As per the Australia maintenance, repair, and operations (MRO) market analysis, there are currently over 110 known contracts for aircraft maintenance, repair, and operations in Australia, which are expected to grow with the adoption of modern technologies such as artificial intelligence.
The rise of smart equipment technology; growing use of digital twins; the introduction of drones; and the rising appeal for cloud-based MRO solutions are factors impacting the Australia maintenance, repair, and operations (MRO) market growth.
TP Aerospace established an additional brake and wheel maintenance and warehouse facility in Brisbane, Australia, aimed at providing exceptional services to its customers.
Greenbird AAM, a platform for collaboration between key players of AAM (Advanced Air Mobility) industry, announced that Sigma Aerospace joined its group to seek sustainable aviation fuels and revive aviation in regional parts of Australia.
Heston MRO, Australasia’s largest independent MRO, signed a purchase agreement with Jet Aviation for the acquisition of its Cairns MRO facility. This is expected to accelerate the Australia maintenance, repair, and operations (MRO) market development.
Singapore Airlines (SIA) and Heston MRO extended their MRO partnership for 3 years, which includes handling aircraft transits, local warehousing, defect rectification, and logistics support. Under the agreement, the MRO organisation intends to handle all departing and incoming Singapore Airlines passenger flights in Brisbane, Melbourne, and Perth.
As smart sensors and IoT technologies become more accessible and inexpensive, manufacturers are deploying them to track equipment performance and maintenance needs easily, thereby boosting cost savings.
Digital twins are used by aviation mechanics for monitoring the physical components of aircraft while it is in operation and resolving any potential problems that may arise. This is increasing the inflow of Australia maintenance, repair, and operations (MRO) market revenue.
Drones can easily access hard-to-reach spaces and even transport tools and parts to technicians. They also minimise the risk to workers’ safety during hazardous tasks.
Aviation companies are expected to adopt cloud-based MRO solutions for managing maintenance schedules and ensuring secure data sharing across different teams.
As IoT technologies become increasingly accessible and affordable, companies are expected to use them to replace outdated routines for machinery maintenance. This is expected to fuel the shift towards predictive maintenance while resulting in substantial reductions in operational costs. Data-driven decision-making is expected to enhance supply chain performance and enhance the partnerships between suppliers and manufacturers, thereby driving the Australia maintenance, repair, and operations (MRO) market value.
The EMR’s report titled “Australia Maintenance, Repair, and Operations (MRO) Market Report and Forecast 2026-2035” offers a detailed analysis of the market based on the following segments:
Market Breakup by Provider
Market Breakup by End Use
Market Breakup by Region


Get a sample of the market report in PDF – REQUEST A FREE SAMPLE
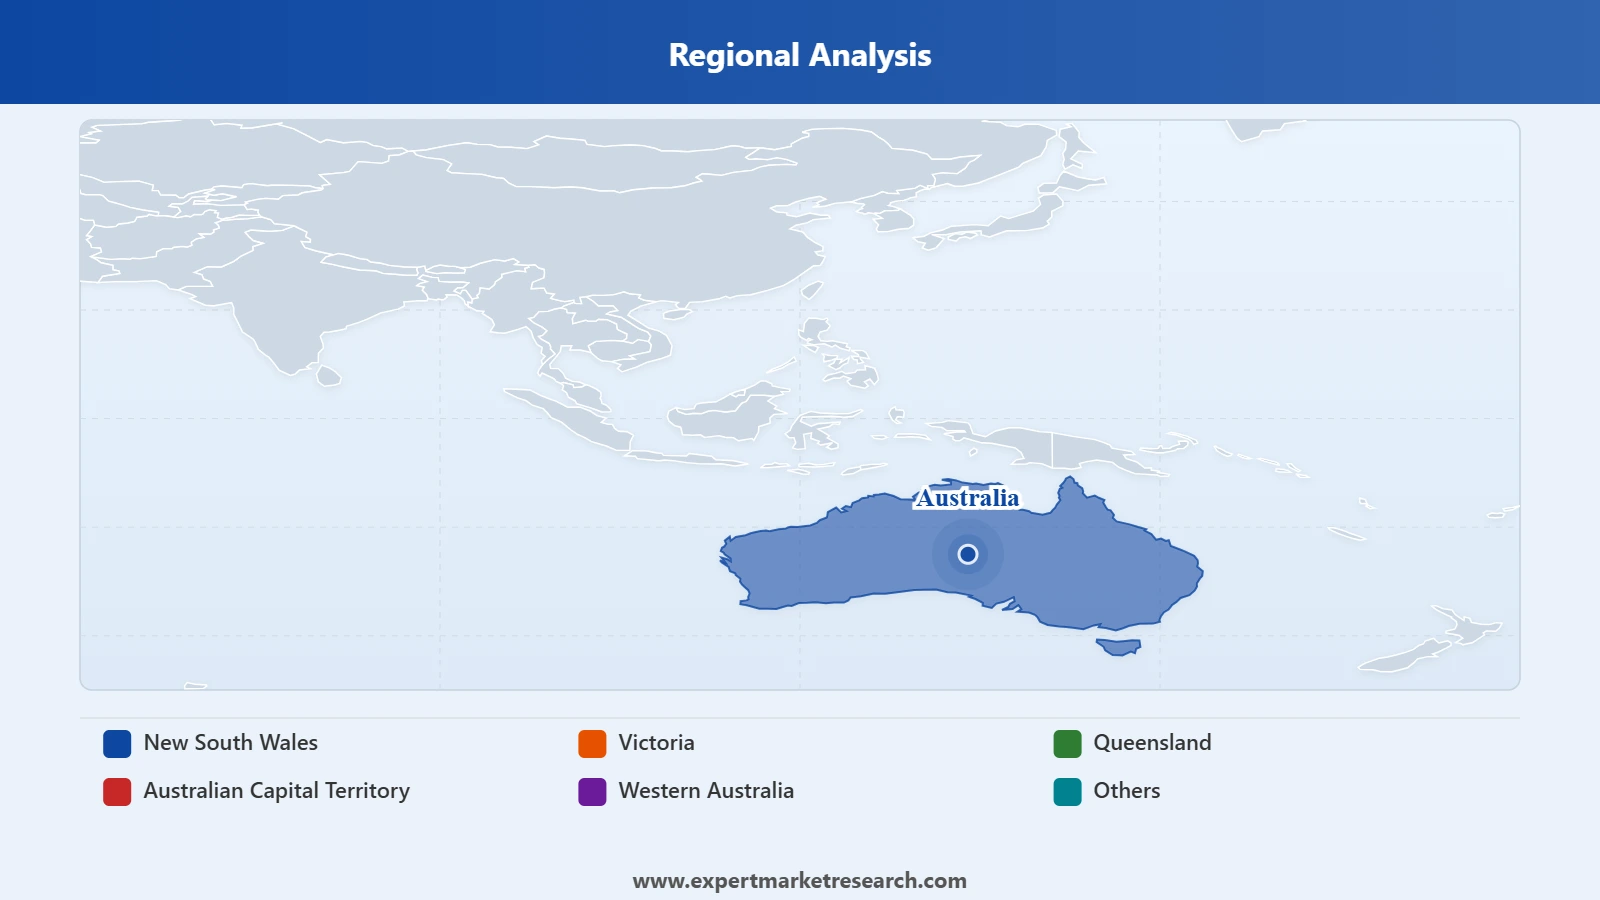
Based on region, the market is segmented into New South Wales, Victoria, Queensland, Australian Capital Territory, and Western Australia, among others. Queensland is projected to dominate the market, representing 11% of the overall market share. Over the forecast period, New South Wales is expected to grow at a CAGR of 2.4% due to the expansion of residential projects in urban areas of the region.
Get a sample of the market report in PDF – REQUEST A FREE SAMPLE
Major MRO companies are expected to adopt blockchain for tracking data regarding mechanical parts and repairs, thereby ensuring the confidentiality of sensitive information. Blockchain is also expected to simplify the management of supply chains while enabling the digital twinning of aircrafts in a secure environment. This is creating a favourable Australia maintenance, repair, and operations (MRO) market outlook.
Heston MRO Group was founded in 1992 and is headquartered in Brisbane, Queensland. It is one of the biggest independent MRO organisations operating within Australasia, specializing in AOG recovery service, line maintenance, and components support.
RS group plc was founded in 1937 and is headquartered in King's Cross, England. It is engaged in providing servicing and product-based solutions to engineers, and designers of industrial machinery for optimum maintenance.
Rexel Australia was founded in 1967 and is headquartered in New South Wales. As per Australia maintenance, repair, and operations (MRO) market analysis, it is a leading wholesaler and distributor of electrical goods, energy storage systems, and lighting supplies worldwide.
SIGMA AEROSPACE was founded in 2016 and is headquartered in Tamworth, New South Wales. It specialises in providing MRO services to leading aviation companies.
*Please note that this is only a partial list; the complete list of key players is available in the full report. Additionally, the list of key players can be customized to better suit your needs.*
Other key players included in the Australia maintenance, repair, and operations (MRO) market report are AMROBA, among others.
Upto 15% Off
USD
$2499 $2249
$3999 $3599
$4999 $4249
$5999 $5099


*While we strive to always give you current and accurate information, the numbers depicted on the website are indicative and may differ from the actual numbers in the main report. At Expert Market Research, we aim to bring you the latest insights and trends in the market. Using our analyses and forecasts, stakeholders can understand the market dynamics, navigate challenges, and capitalize on opportunities to make data-driven strategic decisions.*
The market is projected to grow at a CAGR of 2.10% between 2026 and 2035.
Based on end use, the market is segmented into manufacturing, construction, electrical, facility, mining, aerospace and defence, automotive, food and beverages, pharmaceuticals, chemicals, and oil and gas, among others.
The different providers of maintenance, repair, and operations (MRO) in the market are OEM and aftermarket.
The different regions covered in the market report are New South Wales, Victoria, Queensland, Australian Capital Territory, and Western Australia, among others.
The key players in the market are Heston MRO Group, RS group plc, AMROBA, Rexel Australia, and SIGMA AEROSPACE, among others.
In 2025, the market reached an approximate value of USD 8.96 Billion.
The market is estimated to witness a healthy growth in the forecast period of 2026-2035 to reach a value of USD 11.03 Billion by 2035.
Explore our key highlights of the report and gain a concise overview of key findings, trends, and actionable insights that will empower your strategic decisions.
| REPORT FEATURES | DETAILS |
| Base Year | 2025 |
| Historical Period | 2019-2025 |
| Forecast Period | 2026-2035 |
| Scope of the Report |
Historical and Forecast Trends, Industry Drivers and Constraints, Historical and Forecast Market Analysis by Segment:
|
| Breakup by Provider |
|
| Breakup by End Use |
|
| Breakup by Region |
|
| Market Dynamics |
|
| Competitive Landscape |
|
| Companies Covered |
|
Datasheet
One User
USD 2,499
USD 2,249
tax inclusive*
Single User License
One User
USD 3,999
USD 3,599
tax inclusive*
Five User License
Five User
USD 4,999
USD 4,249
tax inclusive*
Corporate License
Unlimited Users
USD 5,999
USD 5,099
tax inclusive*
*Please note that the prices mentioned below are starting prices for each bundle type. Kindly contact our team for further details.*
Flash Bundle
Small Business Bundle
Growth Bundle
Enterprise Bundle
*Please note that the prices mentioned below are starting prices for each bundle type. Kindly contact our team for further details.*
Flash Bundle
Number of Reports: 3
20%
tax inclusive*
Small Business Bundle
Number of Reports: 5
25%
tax inclusive*
Growth Bundle
Number of Reports: 8
30%
tax inclusive*
Enterprise Bundle
Number of Reports: 10
35%
tax inclusive*
How To Order

Select License Type
Choose the right license for your needs and access rights.

Click on ‘Buy Now’
Add the report to your cart with one click and proceed to register.

Select Mode of Payment
Choose a payment option for a secure checkout. You will be redirected accordingly.
Strategic Solutions for Informed Decision-Making
Gain insights to stay ahead and seize opportunities.

Get insights & trends for a competitive edge.

Track prices with detailed trend reports.

Analyse trade data for supply chain insights.

Leverage cost reports for smart savings

Enhance supply chain with partnerships.

Connect For More Information
Our expert team of analysts will offer full support and resolve any queries regarding the report, before and after the purchase.
Our expert team of analysts will offer full support and resolve any queries regarding the report, before and after the purchase.
We employ meticulous research methods, blending advanced analytics and expert insights to deliver accurate, actionable industry intelligence, staying ahead of competitors.
Our skilled analysts offer unparalleled competitive advantage with detailed insights on current and emerging markets, ensuring your strategic edge.
We offer an in-depth yet simplified presentation of industry insights and analysis to meet your specific requirements effectively.


