

Consumer Insights
Uncover trends and behaviors shaping consumer choices today
Procurement Insights
Optimize your sourcing strategy with key market data
Industry Stats
Stay ahead with the latest trends and market analysis.
The global autonomous last mile delivery market attained a value of USD 30.28 Billion in 2025. The market is further expected to grow in the forecast period of 2026-2035 at a CAGR of 23.30%, to reach USD 245.92 Billion by 2035, driven by factors like technological advancements, such as real-time monitoring, which allows consumer to track and change retail deliveries. North America is the leading regional market, and the region is likely to continue to dominate the market in the coming years.
Overview: The Autonomous Last Mile Delivery sector navigated an unusually turbulent quarter in Q1 2026, with the Iran-US-Israel conflict reshaping both costs and demand. The Strait of Hormuz near-shutdown, with vessel traffic falling from 138/day to just 2 by March 5, 2026 (Z2Data) , grounded approximately 700+ vessels stranded or delayed in the first week of March (Londonlovesbusiness.com), disrupting shipping lanes that carry a significant share of global trade and dramatically increasing freight costs, insurance premiums, and transit times across the global logistics network. The UNCTAD officially briefed member states on the magnitude of shipping disruption (UNCTAD officially briefing member states on shipping disruption (UNCTAD/OSG/TT/INF/2026/1)), with USD 1.2 trillion in annual Gulf trade at risk (Complexity Science Hub Vienna / TU Delft) flagged as directly at risk. These dynamics reshaped freight routing, warehousing demand, and supply chain strategy, creating both near-term disruption and long-term structural recalibration across the autonomous last mile delivery market sector.
United States: US during the first quarter of 2026 was significantly affected by Gulf shipping disruption, with US importers and exporters rerouting cargo through alternative lanes and absorbing elevated freight costs as Hormuz closure reduced global shipping capacity. US domestic logistics demand remained strong, supported by the defense industrial base surge, with the US arms industry having quadrupled production in the three months before Operation Epic Fury (Wikipedia) generating elevated freight volumes for weapons, components, and military logistics support across the country. US LNG export logistics, maximizing throughput from Sabine Pass, Corpus Christi, and Freeport following QatarEnergy force majeure declared following Ras Laffan drone strikes on March 2, 2026, created elevated tanker scheduling and port logistics demand at US Gulf Coast terminals. US e-commerce fulfillment and last-mile delivery maintained strong Q1 2026 volumes, with elevated freight costs partially offset by sustained consumer demand for domestic delivery services independent of international shipping disruption.
Iran & Israel: Israel's Q1 2026 experience Closer to the fighting, Israel maintained operational logistics continuity throughout Q1 2026, activating contingency supply chain routes, increasing inventory buffers, and coordinating with allied-nation logistics partners to sustain civilian and defense supply chains under conflict conditions. Israel's Haifa and Ashdod ports, critical nodes for Israeli import and export logistics, remained operational, with vessel routing adjusted to avoid conflict-proximate maritime risk zones. The Iranian naval commander Alireza Tangsiri was eliminated on March 26, 2026, and the IRGC announced movement restrictions for vessels to and from US, Israeli, and allied ports, creating significant maritime logistics disruption that lifted demand for alternative routing and freight insurance across the global autonomous last mile delivery market sector. Gulf state logistics hubs, Dubai's Jebel Ali, Saudi Arabia's King Abdulaziz Port, managed elevated throughput complexity from conflict-driven vessel rerouting and supply chain contingency demand during Q1 2026.
Government & Policy Watch
Market & Industry Impact
Procurement & Supply Chain Alert
Compound Annual Growth Rate
23.3%
Value in USD Billion
2026-2035
| Global Autonomous Last Mile Delivery Market Report Summary | Description | Value |
| Base Year | USD Billion | 2025 |
| Historical Period | USD Billion | 2019-2025 |
| Forecast Period | USD Billion | 2026-2035 |
| Market Size 2025 | USD Billion | 30.28 |
| Market Size 2035 | USD Billion | 245.92 |
| CAGR 2019-2025 | Percentage | XX% |
| CAGR 2026-2035 | Percentage | 23.30% |
| CAGR 2026-2035 - Market by Region | North America | 24.3% |
| CAGR 2026-2035 - Market by Country | UK | 25.3% |
| CAGR 2026-2035 - Market by Country | USA | 24.8% |
| CAGR 2026-2035 - Market by Platform | Aerial Delivery Drone | 27.4% |
| Market Share by Country 2025 | Australia | 2.8% |
The last mile in supply chain management and logistics planning identifies the movement of goods from the transport hub to the final destination of delivery.
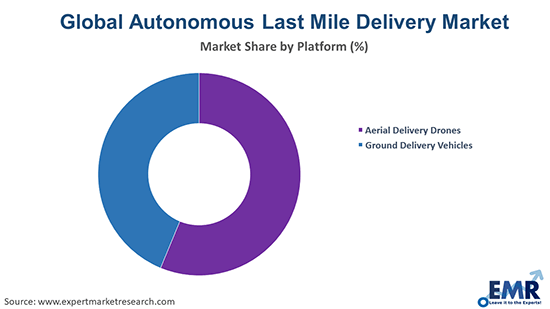
Market Breakup by Platform
Market Breakup by Region
Read more about this report - REQUEST FREE SAMPLE COPY IN PDF
| CAGR 2026-2035 - Market by | Country |
| UK | 25.3% |
| USA | 24.8% |
| Germany | 22.8% |
| Brazil | 22.2% |
| India | 19.9% |
| Canada | XX% |
| France | XX% |
| Italy | XX% |
| China | XX% |
| Japan | XX% |
| Australia | XX% |
| Saudi Arabia | XX% |
| Mexico | 18.9% |


The necessity to increase delivery efficiency and reduce delivery time has led to the use of air delivery drones and ground delivery vehicles to deliver the last-mile package autonomously. The production of sophisticated and cost-effective air delivery drones and ground delivery vehicles is also accelerating the market growth of the autonomous last mile delivery.
The segment of aerial delivery drones is likely to lead the autonomous last mile delivery market, due to their high manoeuvrability and ease of use. The market for aerial drones is being driven by their ability to deliver packages across all geographical terrains and in a short period of time.
The report presents a detailed analysis of the following key players in the global autonomous last mile delivery market, looking into their capacity, competitive landscape, and latest developments like capacity expansions, plant turnarounds, and mergers and acquisitions:
The major manufacturers of aerial delivery drones are:
The key players in ground delivery robots are:
The EMR report gives an in-depth insight into the industry by providing a SWOT analysis as well as an analysis of Porter’s Five Forces model.
Upto 15% Off
USD
$2499 $2249
$3999 $3599
$4999 $4249
$5999 $5099


*While we strive to always give you current and accurate information, the numbers depicted on the website are indicative and may differ from the actual numbers in the main report. At Expert Market Research, we aim to bring you the latest insights and trends in the market. Using our analyses and forecasts, stakeholders can understand the market dynamics, navigate challenges, and capitalize on opportunities to make data-driven strategic decisions.*
In 2025, the autonomous last mile delivery market reached an approximate value of USD 30.28 Billion.
The major drivers of the market include the technological advancements, such as real-time monitoring, increased use of the internet, increasing use of aerial drones, and increased disbursements of enterprises in research and development.
The production of sophisticated and cost-effective air delivery drones and ground delivery vehicles and the expansion of the e-commerce industry are the key trends guiding the growth of the industry.
The major regions in the industry are North America, Latin America, the Middle East and Africa, Europe, and the Asia Pacific, with North America accounting for the largest share in the market.
Aerial delivery drones and ground delivery vehicles are the major platforms of the product in the market.
The major players in the aerial delivery drone sector include Matternet Inc., Zipline International Inc., Flirtey, and Drone Delivery Canada Corp., among others while the major players in the ground delivery vehicles sector are Amazon.com, Inc, Nuro, Inc., Savioke Inc., and Starship Technologies Inc., among others.
The market is projected to grow at a CAGR of 23.30% between 2026 and 2035.
The market is estimated to witness healthy growth in the forecast period of 2026-2035 to reach a value of around USD 245.92 Billion by 2035.
Explore our key highlights of the report and gain a concise overview of key findings, trends, and actionable insights that will empower your strategic decisions.
| REPORT FEATURES | DETAILS |
| Base Year | 2025 |
| Historical Period | 2019-2025 |
| Forecast Period | 2026-2035 |
| Scope of the Report |
Historical and Forecast Trends, Industry Drivers and Constraints, Historical and Forecast Market Analysis by Segment:
|
| Breakup by Platform |
|
| Breakup by Region |
|
| Market Dynamics |
|
| Competitive Landscape |
|
| Companies Covered |
|
| Report Price and Purchase Option | Explore our purchase options that are best suited to your resources and industry needs. |
| Delivery Format | Delivered as an attached PDF and Excel through email, with an option of receiving an editable PPT, according to the purchase option. |
Datasheet
One User
USD 2,499
USD 2,249
tax inclusive*
Single User License
One User
USD 3,999
USD 3,599
tax inclusive*
Five User License
Five User
USD 4,999
USD 4,249
tax inclusive*
Corporate License
Unlimited Users
USD 5,999
USD 5,099
tax inclusive*
*Please note that the prices mentioned below are starting prices for each bundle type. Kindly contact our team for further details.*
Flash Bundle
Small Business Bundle
Growth Bundle
Enterprise Bundle
*Please note that the prices mentioned below are starting prices for each bundle type. Kindly contact our team for further details.*
Flash Bundle
Number of Reports: 3
20%
tax inclusive*
Small Business Bundle
Number of Reports: 5
25%
tax inclusive*
Growth Bundle
Number of Reports: 8
30%
tax inclusive*
Enterprise Bundle
Number of Reports: 10
35%
tax inclusive*
How To Order

Select License Type
Choose the right license for your needs and access rights.

Click on ‘Buy Now’
Add the report to your cart with one click and proceed to register.

Select Mode of Payment
Choose a payment option for a secure checkout. You will be redirected accordingly.
Strategic Solutions for Informed Decision-Making
Gain insights to stay ahead and seize opportunities.

Get insights & trends for a competitive edge.

Track prices with detailed trend reports.

Analyse trade data for supply chain insights.

Leverage cost reports for smart savings

Enhance supply chain with partnerships.

Connect For More Information
Our expert team of analysts will offer full support and resolve any queries regarding the report, before and after the purchase.
Our expert team of analysts will offer full support and resolve any queries regarding the report, before and after the purchase.
We employ meticulous research methods, blending advanced analytics and expert insights to deliver accurate, actionable industry intelligence, staying ahead of competitors.
Our skilled analysts offer unparalleled competitive advantage with detailed insights on current and emerging markets, ensuring your strategic edge.
We offer an in-depth yet simplified presentation of industry insights and analysis to meet your specific requirements effectively.


