

Consumer Insights
Uncover trends and behaviors shaping consumer choices today
Procurement Insights
Optimize your sourcing strategy with key market data
Industry Stats
Stay ahead with the latest trends and market analysis.
The global aviation augmented and virtual reality market size attained a value of USD 4.19 Billion in 2025. The market is further expected to grow at a CAGR of 56.50% between 2026 and 2035, reaching a value of USD 369.28 Billion by 2035.
Compound Annual Growth Rate
56.5%
Value in USD Billion
2026-2035
Aviation augmented and virtual reality refers to the use of augmented reality (AR) and virtual reality (VR) digital tools in aviation applications. AR and VR provide realistic aviation environments by stimulating different scenarios allowing the crew to learn, test, and practice their flying skills. This method also harmonises the budding pilots with multiple controls of an aircraft to improve their handling, especially during emergency situations.

Read more about this report - REQUEST FREE SAMPLE COPY IN PDF
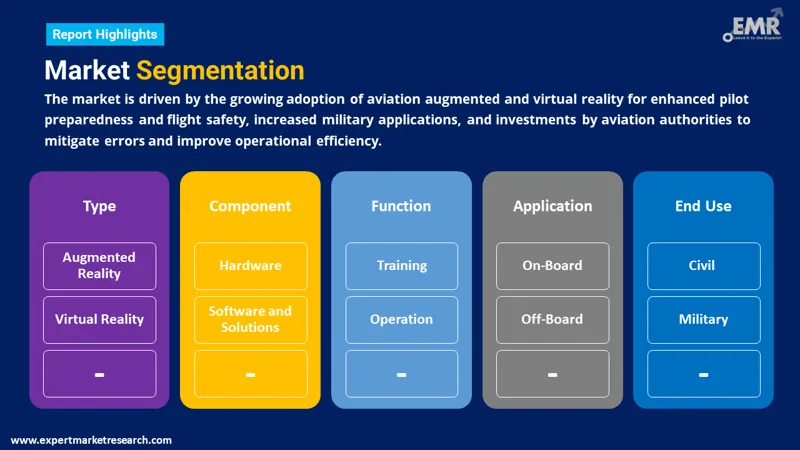
The EMR’s report titled “Global Aviation Augmented and Virtual Reality Market Report and Forecast 2026-2035” offers a detailed analysis of the market based on the following segments:
Market Breakup by Type
Market Breakup by Component
Market Breakup by Function
Market Breakup by Application
Market Breakup by End Use
Market Breakup by Region
Read more about this report - REQUEST FREE SAMPLE COPY IN PDF
The virtual reality segment, based on type, accounts for a healthy share of the aviation augmented and virtual reality market. Virtual reality provides a multiparticipant atmosphere which facilitates interactions between cabin crew and pilot which enhances coordination, leading to an enhanced flight experience. In addition, this technology provides real-life environment at cost-effective rate. It also enhances decision-making by stimulating dangerous situations without real-life risks. Meanwhile, the augmented reality segment is anticipated to witness a steady growth in the forecast period, owing to the real-time remote guidance offered by experts which can reduce the chances of error during flights.


Based on end use, the civil segment accounts for a significant share in the aviation augmented and virtual reality market. Increasing demand for commercial aircrafts and heavy dependence on aviation augmented and virtual reality to facilitate practical training are the major factors contributing towards the growth of this segment. Increasing number of domestic and international travellers are pushing the safety and quality standards of civil aviation industry, which is further propelling the demand for aviation augmented and virtual reality. Moreover, a digital wave of transformation across the civil aviation sector has brought a change in skill development and training procedures.
The comprehensive EMR report provides an in-depth assessment of the market based on the Porter's five forces model along with giving a SWOT analysis. The report gives a detailed analysis of the key players in the global aviation augmented and virtual reality market, covering their competitive landscape and latest developments like mergers, acquisitions, investments and expansion plans.
Microsoft Corporation is one of the largest software makers across the globe, offering personal computer software, systems, and applications, cloud-computing services, video games, and consulting services. The company was founded in 1975 and is headquartered Washington, United States.
Google LLC is a subsidiary of Alphabet Inc., which is a leading provider of search and advertising services on the internet. Founded in 1998 and headquartered in California, United States, this company augments the growth of various businesses belonging to diverse fields.
EON Reality, Inc. is a leading software company which develops and markets virtual reality and augmented reality software, catering to the educational demands of universities other academic institutions. The company was established in 1999 and is currently headquartered in California, United States.
*Please note that this is only a partial list; the complete list of key players is available in the full report. Additionally, the list of key players can be customized to better suit your needs.*
Other market players include Jasoren, Honeywell International Inc., Elbit Systems Ltd., Magic Leap, Inc., Bohemia Interactive Simulations, SITA Group, and TAE Aerospace, among others.
Upto 15% Off
USD
$2499 $2249
$3999 $3599
$4999 $4249
$5999 $5099


*While we strive to always give you current and accurate information, the numbers depicted on the website are indicative and may differ from the actual numbers in the main report. At Expert Market Research, we aim to bring you the latest insights and trends in the market. Using our analyses and forecasts, stakeholders can understand the market dynamics, navigate challenges, and capitalize on opportunities to make data-driven strategic decisions.*
The market reached a value of USD 4.19 Billion in 2025.
The market is estimated to grow at a CAGR of 56.50% between 2026 and 2035.
The market is estimated to witness a healthy growth in the forecast period of 2026-2035 to reach a value of USD 369.28 Billion by 2035.
The increasing adoption of aviation augmented and virtual reality to improve pilot preparedness and flight safety, rising applications in the military sector, and increasing investments by aviation authorities to curb the cases of errors are the major drivers of the market.
The key trends in the market include advancements in augmented and virtual reality, increasing induction of light combat aircrafts and fighter jets in air forces of strong sovereign military powers and rapid digitalisation in the aviation sector.
Hardware, and software and solutions are the primary components of aviation augmented and virtual reality in the market.
Training and operation are the different functions of aviation augmented and virtual reality.
Microsoft Corporation, Google LLC, Jasoren, Honeywell International Inc., Elbit Systems Ltd., Magic Leap, Inc., Bohemia Interactive Simulations, SITA Group, EON Reality, Inc., and TAE Aerospace, among others, are the key players in the aviation augmented and virtual reality market, according to the report.
Explore our key highlights of the report and gain a concise overview of key findings, trends, and actionable insights that will empower your strategic decisions.
| REPORT FEATURES | DETAILS |
| Base Year | 2025 |
| Historical Period | 2019-2025 |
| Forecast Period | 2026-2035 |
| Scope of the Report |
Historical and Forecast Trends, Industry Drivers and Constraints, Historical and Forecast Market Analysis by Segment:
|
| Breakup by Type |
|
| Breakup by Component |
|
| Breakup by Function |
|
| Breakup by Application |
|
| Breakup by End Use |
|
| Breakup by Region |
|
| Market Dynamics |
|
| Competitive Landscape |
|
| Companies Covered |
|
Datasheet
One User
USD 2,499
USD 2,249
tax inclusive*
Single User License
One User
USD 3,999
USD 3,599
tax inclusive*
Five User License
Five User
USD 4,999
USD 4,249
tax inclusive*
Corporate License
Unlimited Users
USD 5,999
USD 5,099
tax inclusive*
*Please note that the prices mentioned below are starting prices for each bundle type. Kindly contact our team for further details.*
Flash Bundle
Small Business Bundle
Growth Bundle
Enterprise Bundle
*Please note that the prices mentioned below are starting prices for each bundle type. Kindly contact our team for further details.*
Flash Bundle
Number of Reports: 3
20%
tax inclusive*
Small Business Bundle
Number of Reports: 5
25%
tax inclusive*
Growth Bundle
Number of Reports: 8
30%
tax inclusive*
Enterprise Bundle
Number of Reports: 10
35%
tax inclusive*
How To Order

Select License Type
Choose the right license for your needs and access rights.

Click on ‘Buy Now’
Add the report to your cart with one click and proceed to register.

Select Mode of Payment
Choose a payment option for a secure checkout. You will be redirected accordingly.
Strategic Solutions for Informed Decision-Making
Gain insights to stay ahead and seize opportunities.

Get insights & trends for a competitive edge.

Track prices with detailed trend reports.

Analyse trade data for supply chain insights.

Leverage cost reports for smart savings

Enhance supply chain with partnerships.

Connect For More Information
Our expert team of analysts will offer full support and resolve any queries regarding the report, before and after the purchase.
Our expert team of analysts will offer full support and resolve any queries regarding the report, before and after the purchase.
We employ meticulous research methods, blending advanced analytics and expert insights to deliver accurate, actionable industry intelligence, staying ahead of competitors.
Our skilled analysts offer unparalleled competitive advantage with detailed insights on current and emerging markets, ensuring your strategic edge.
We offer an in-depth yet simplified presentation of industry insights and analysis to meet your specific requirements effectively.


