

Consumer Insights
Uncover trends and behaviors shaping consumer choices today
Procurement Insights
Optimize your sourcing strategy with key market data
Industry Stats
Stay ahead with the latest trends and market analysis.
The global biomass power market grew at a CAGR of around 8.00% during the forecast period of 2026-2035.
In 2020, bioenergy dominated renewable heat production, supplying 96% of the total, underpinning its critical role in delivering renewable thermal energy globally.
Geothermal energy supplied 4% of renewable heat, reflecting its more limited but stable role in countries and regions where accessible geothermal resources are available.
Solar thermal energy supplied only 0.22%, indicating a very minor contribution to global renewable heat production despite remaining as a viable technology in specific applications, thereby supporting the growth of biomass power market.
Compound Annual Growth Rate
8%
2026-2035
| Global Biomass Power Market Report Summary | Description | Value |
| Base Year | USD Million | 2025 |
| Historical Period | USD Million | 2019-2025 |
| Forecast Period | USD Million | 2026-2035 |
| Market Size 2025 | USD Million | XX |
| Market Size 2035 | USD Million | XX |
| CAGR 2019-2025 | Percentage | XX% |
| CAGR 2026-2035 | Percentage | 8.00% |
| CAGR 2026-2035 - Market by Region | Asia Pacific | 9.2% |
| CAGR 2026-2035 - Market by Country | India | 9.2% |
| CAGR 2026-2035 - Market by Country | China | 8.8% |
| CAGR 2026-2035 - Market by Technology | Anaerobic Digestion | 9.0% |
| CAGR 2026-2035 - Market by Feedstock | Biogas | 9.1% |
| Market Share by Country 2025 | India | 4.1% |
The two major drivers of the biomass power market are expected to remain growing government support and incentives for renewables, and environmental concerns about climate change. Government policies and subsidies across the globe encourage biomass energy as a substitute for fossil fuels-a cleaner alternative-thus boosting growth in the market. In addition to that, the impetus on reducing greenhouse gas emissions and hitting sustainability targets increases the adoption of biomass power. This growing focus on greener sources of energy reflects the global commitment to fighting climate change through shifting to renewable sources of energy and ultimately aid in bolstering the biomass power demand.
Read more about this report - REQUEST FREE SAMPLE COPY IN PDF
The demand for biomass power will grow due to increasing biomass energy generation for heating solutions.
Contributions of bioenergy to the worldwide production of renewable power from 2015 to 2020 depict an increasing trend, well explaining its important role in the renewable energy industry. From the results in 2015, it is clear that approximately 500 TWh of electricity was produced from bioenergy, with this steadily increasing in each subsequent year. In 2020, this contribution increased to more than 600 TWh, reflecting huge growth in its application for the production of electricity. This increase is due to the diversification of sources, such as biomass, biogas, and waste-to-energy technologies that have found more and more applications in different regions, pushing the global biomass power demand growth.
The share of bioenergy in the overall mix of renewable power remained relatively stable across the period, fluctuating from 7 to 9% between 2015 and 2020. That means that while other renewable sources, such as wind and solar, rapidly expanded, the growth of bioenergy was maintained as a stable source of electricity. This steady percentage thus indicates parallel growth in the field of bioenergy at par with the global expansion of renewable energy capacity.
Gasification advancement, feedstock diversification and government initiatives are anticipated to open up new biomass power market dynamics and trends.
One of the trends of the biomass power market are the technological innovations in gasification, combined heat and power systems, and the advent of digital monitoring tools backed with profitability will drive the growth of the biomass power market. This makes biomass power more feasible and sustainable through great improvements in efficiency while reducing both emission and even the operational costs.
Feedstock diversification will increase, including agricultural residues, wood pellets, and energy crops, to keep sustainability in focus, address waste reduction, and offer a more secure and reliable source of raw material supply for biomass energy production in the future.
Government incentives and policies are stepping up the biomass power market. Subsidies, tax incentives, and renewable energy mandates encourage investments in biomass projects, promoting market growth and biomass power market opportunities.
Seiko Epson Corporation has announced that it is planning the construction of the company's first biomass power plant, in Iida City, in Nagano Prefecture, Japan. Epson hopes to have the plant in operation in the 2026 fiscal year (ending March 2027) and is moving to secure the land and buildings, contract construction, and file the paperwork for power generation.
Surging Environmental Consciousness to Augment the Market Growth of Biomass Power
The market is currently being driven by the abundant availability of biomass or raw material, reduced dependency on fossil fuels, absence of harmful emissions, and increased focus on the use of clean energy. The increasing environmental consciousness is driving countries across the globe to expand their renewable energy usage, which is surging the demand for biomass power. Major countries across the globe including China, Germany, the UK, and France, have announced their plans to become carbon-neutral nations in the future, which is resulting in the implementation of favourable policies and regulations that aim to reduce the consumption of coal and promoting the use of bio-based alternatives like biomass for energy generation. Furthermore, the growing demand for biomass power solutions in the generation of bioelectricity is expected to support the market growth in the forecast period. Also, another trend in the biomass power industry is the economic viability offered by biomass power solutions is anticipated to bolster their adoption in the forecast period.
Read more about this report - REQUEST FREE SAMPLE COPY IN PDF
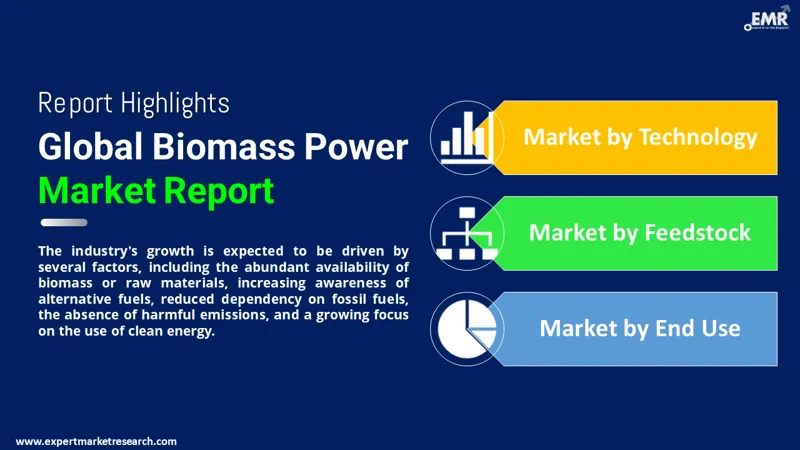
“Global Biomass Power Market Report and Forecast 2026-2035” offers a detailed analysis of the market based on the following segments:
By technology, the market can be divided into:
On the basis of feedstock, the market is segmented into:
Based on end use, the market is categorised into:
Based on region, the market is divided into:
Heightened Utility in the Industrial Sector to Prove Beneficial for the Market Growth of Biomass Power
As per biomass power market analysis, the market is currently being driven by the growing demand for biomass power solutions in the industrial sector, spurred by the increasing focus of various companies on reducing their dependency on fossil fuels. In addition, the growing adoption of clean energy solutions to reduce the overall CO2 emissions is anticipated to support the demand for biomass power in the forecast period. Further, many industries are also installing biomass power plants on-site to burn the waste generated at the site, thereby minimising the cost of waste disposal as well as the energy costs.


Europe to Account for a Significant Share in the Global Market for Biomass Power
The biomass power industry in Europe currently represents the largest market, accounting for 35% of the total production of biomass power, followed by North America. Biomass for energy is the main source of renewable energy in the European Union, accounting for a share of around 60%, which is majorly utilised in the heating and cooling sector. Forestry such as wood-processing residues, fuelwood, and logging residues, among others, represents the main source of biomass energy in the region. In the forecast period, the heightened deployment of biomass power solutions across industry verticals to meet the EU’s renewable energy targets for 2030 is anticipated to prove beneficial for the market growth in the coming years. Meanwhile, the market is also expected to witness considerable growth in regions like the Asia Pacific. This can be attributed to the increasing focus of governments across emerging countries like India and China on curbing the pollution levels and promoting the adoption of green energy sources.
| CAGR 2026-2035 - Market by | Country |
| India | 9.2% |
| China | 8.8% |
| Canada | 8.3% |
| Australia | 6.3% |
| France | 6.3% |
| USA | XX% |
| UK | XX% |
| Germany | XX% |
| Italy | 5.6% |
| Japan | XX% |
| Saudi Arabia | XX% |
| Brazil | XX% |
| Mexico | XX% |
Major companies in the biomass power market have been investing in advanced technological innovations, increasing their operational capacities by growing their units, increasing their efficiency rates, and forming strategic partnerships to scale up their production capacities toward setting new records on the ground of increasing demands for renewable energies.
Vattenfall Group is another one of the independent companies established in 1909 and headquartered in Stockholm, Sweden. The company is one of the big players in the biomass power sector due to the added contribution from co-firing biomass with coal and further developments in the field of dedicated biomass power plants. Vattenfall is working on sustainable biomass solutions using wood pellets and agricultural residues to reduce carbon emissions, hence paving the way for renewable energy.
Babcock & Wilcox Enterprises Inc., a biomasse power technology company based in Akron, Ohio and was founded in 1867, comprises a team of engineers leading-edge biomass power technologies that make the production of greener and more sustainable energy possible. Babcock & Wilcox presents solutions such as its biomass boilers, gasifiers, and combustion systems, which are designed to turn a wide variety of biomass feedstocks into energy. Babcock & Wilcox focuses on improvement in the efficiency and reliability of biomass power plants through better engineering and innovative technology.
Ameresco, Inc., a Framingham, Massachusetts-based company, founded in the year 2000, designs and constructs, while also operating biomass power systems as part of the different biomass energy solutions it has on offer. The firm thus stresses more on renewable development projects and furthering energy efficiency by having sustainable, proficient biomass technologies. This means the production of renewable energy and provision of energy efficiency through anaerobic digestion and combustion systems.
*Please note that this is only a partial list; the complete list of key players is available in the full report. Additionally, the list of key players can be customized to better suit your needs.*
Other key players profiled in the global biomass power market report are Ørsted A/S, Ramboll Group A/S, and Mitsubishi Heavy Industries, Ltd., among others.
Upto 15% Off
USD
$3999 $3599
$2499 $2249
$4999 $4249
$5999 $5099


*While we strive to always give you current and accurate information, the numbers depicted on the website are indicative and may differ from the actual numbers in the main report. At Expert Market Research, we aim to bring you the latest insights and trends in the market. Using our analyses and forecasts, stakeholders can understand the market dynamics, navigate challenges, and capitalize on opportunities to make data-driven strategic decisions.*
The biomass power market grew at a CAGR of 8.00% between 2026 and 2035.
The major drivers of the industry, such as abundant availability of biomass or raw material, rising awareness of the alternative fuel, reduced dependency on fossil fuels, absence of harmful emissions, and increasing focus on use of clean energy, are expected to aid the market growth.
The key market trends guiding the industry growth include the rising competition and ongoing R&D activities.
The major regions in the industry are North America, Latin America, the Middle East and Africa, Europe, and the Asia Pacific, with Europe accounting for the largest share in the market.
The major sources of the product in the industry are solid biomass, biogas, municipal waste, and liquid biomass.
The leading end use sector of the product is the industrial sector.
The major players in the industry are Vattenfall Group., Babcock & Wilcox Enterprises, Inc., Ameresco, Inc., Ørsted A/S, Ramboll Group A/S, Mitsubishi Heavy Industries, Ltd., and others.
Explore our key highlights of the report and gain a concise overview of key findings, trends, and actionable insights that will empower your strategic decisions.
| REPORT FEATURES | DETAILS |
| Base Year | 2025 |
| Historical Period | 2019-2025 |
| Forecast Period | 2026-2035 |
| Scope of the Report |
Historical and Forecast Trends, Industry Drivers and Constraints, Historical and Forecast Market Analysis by Segment:
|
| Breakup by Technology |
|
| Breakup by Feedstock |
|
| Breakup by End Use |
|
| Breakup by Region |
|
| Market Dynamics |
|
| Competitive Landscape |
|
| Companies Covered |
|
| Report Price and Purchase Option | Explore our purchase options that are best suited to your resources and industry needs. |
| Delivery Format | Delivered as an attached PDF and Excel through email, with an option of receiving an editable PPT, according to the purchase option. |
Single User License
One User
USD 3,999
USD 3,599
tax inclusive*
Datasheet
One User
USD 2,499
USD 2,249
tax inclusive*
Five User License
Five User
USD 4,999
USD 4,249
tax inclusive*
Corporate License
Unlimited Users
USD 5,999
USD 5,099
tax inclusive*
*Please note that the prices mentioned below are starting prices for each bundle type. Kindly contact our team for further details.*
Flash Bundle
Small Business Bundle
Growth Bundle
Enterprise Bundle
*Please note that the prices mentioned below are starting prices for each bundle type. Kindly contact our team for further details.*
Flash Bundle
Number of Reports: 3
20%
tax inclusive*
Small Business Bundle
Number of Reports: 5
25%
tax inclusive*
Growth Bundle
Number of Reports: 8
30%
tax inclusive*
Enterprise Bundle
Number of Reports: 10
35%
tax inclusive*
How To Order

Select License Type
Choose the right license for your needs and access rights.

Click on ‘Buy Now’
Add the report to your cart with one click and proceed to register.

Select Mode of Payment
Choose a payment option for a secure checkout. You will be redirected accordingly.
Strategic Solutions for Informed Decision-Making
Gain insights to stay ahead and seize opportunities.

Get insights & trends for a competitive edge.

Track prices with detailed trend reports.

Analyse trade data for supply chain insights.

Leverage cost reports for smart savings

Enhance supply chain with partnerships.

Connect For More Information
Our expert team of analysts will offer full support and resolve any queries regarding the report, before and after the purchase.
Our expert team of analysts will offer full support and resolve any queries regarding the report, before and after the purchase.
We employ meticulous research methods, blending advanced analytics and expert insights to deliver accurate, actionable industry intelligence, staying ahead of competitors.
Our skilled analysts offer unparalleled competitive advantage with detailed insights on current and emerging markets, ensuring your strategic edge.
We offer an in-depth yet simplified presentation of industry insights and analysis to meet your specific requirements effectively.


