

Consumer Insights
Uncover trends and behaviors shaping consumer choices today
Procurement Insights
Optimize your sourcing strategy with key market data
Industry Stats
Stay ahead with the latest trends and market analysis.
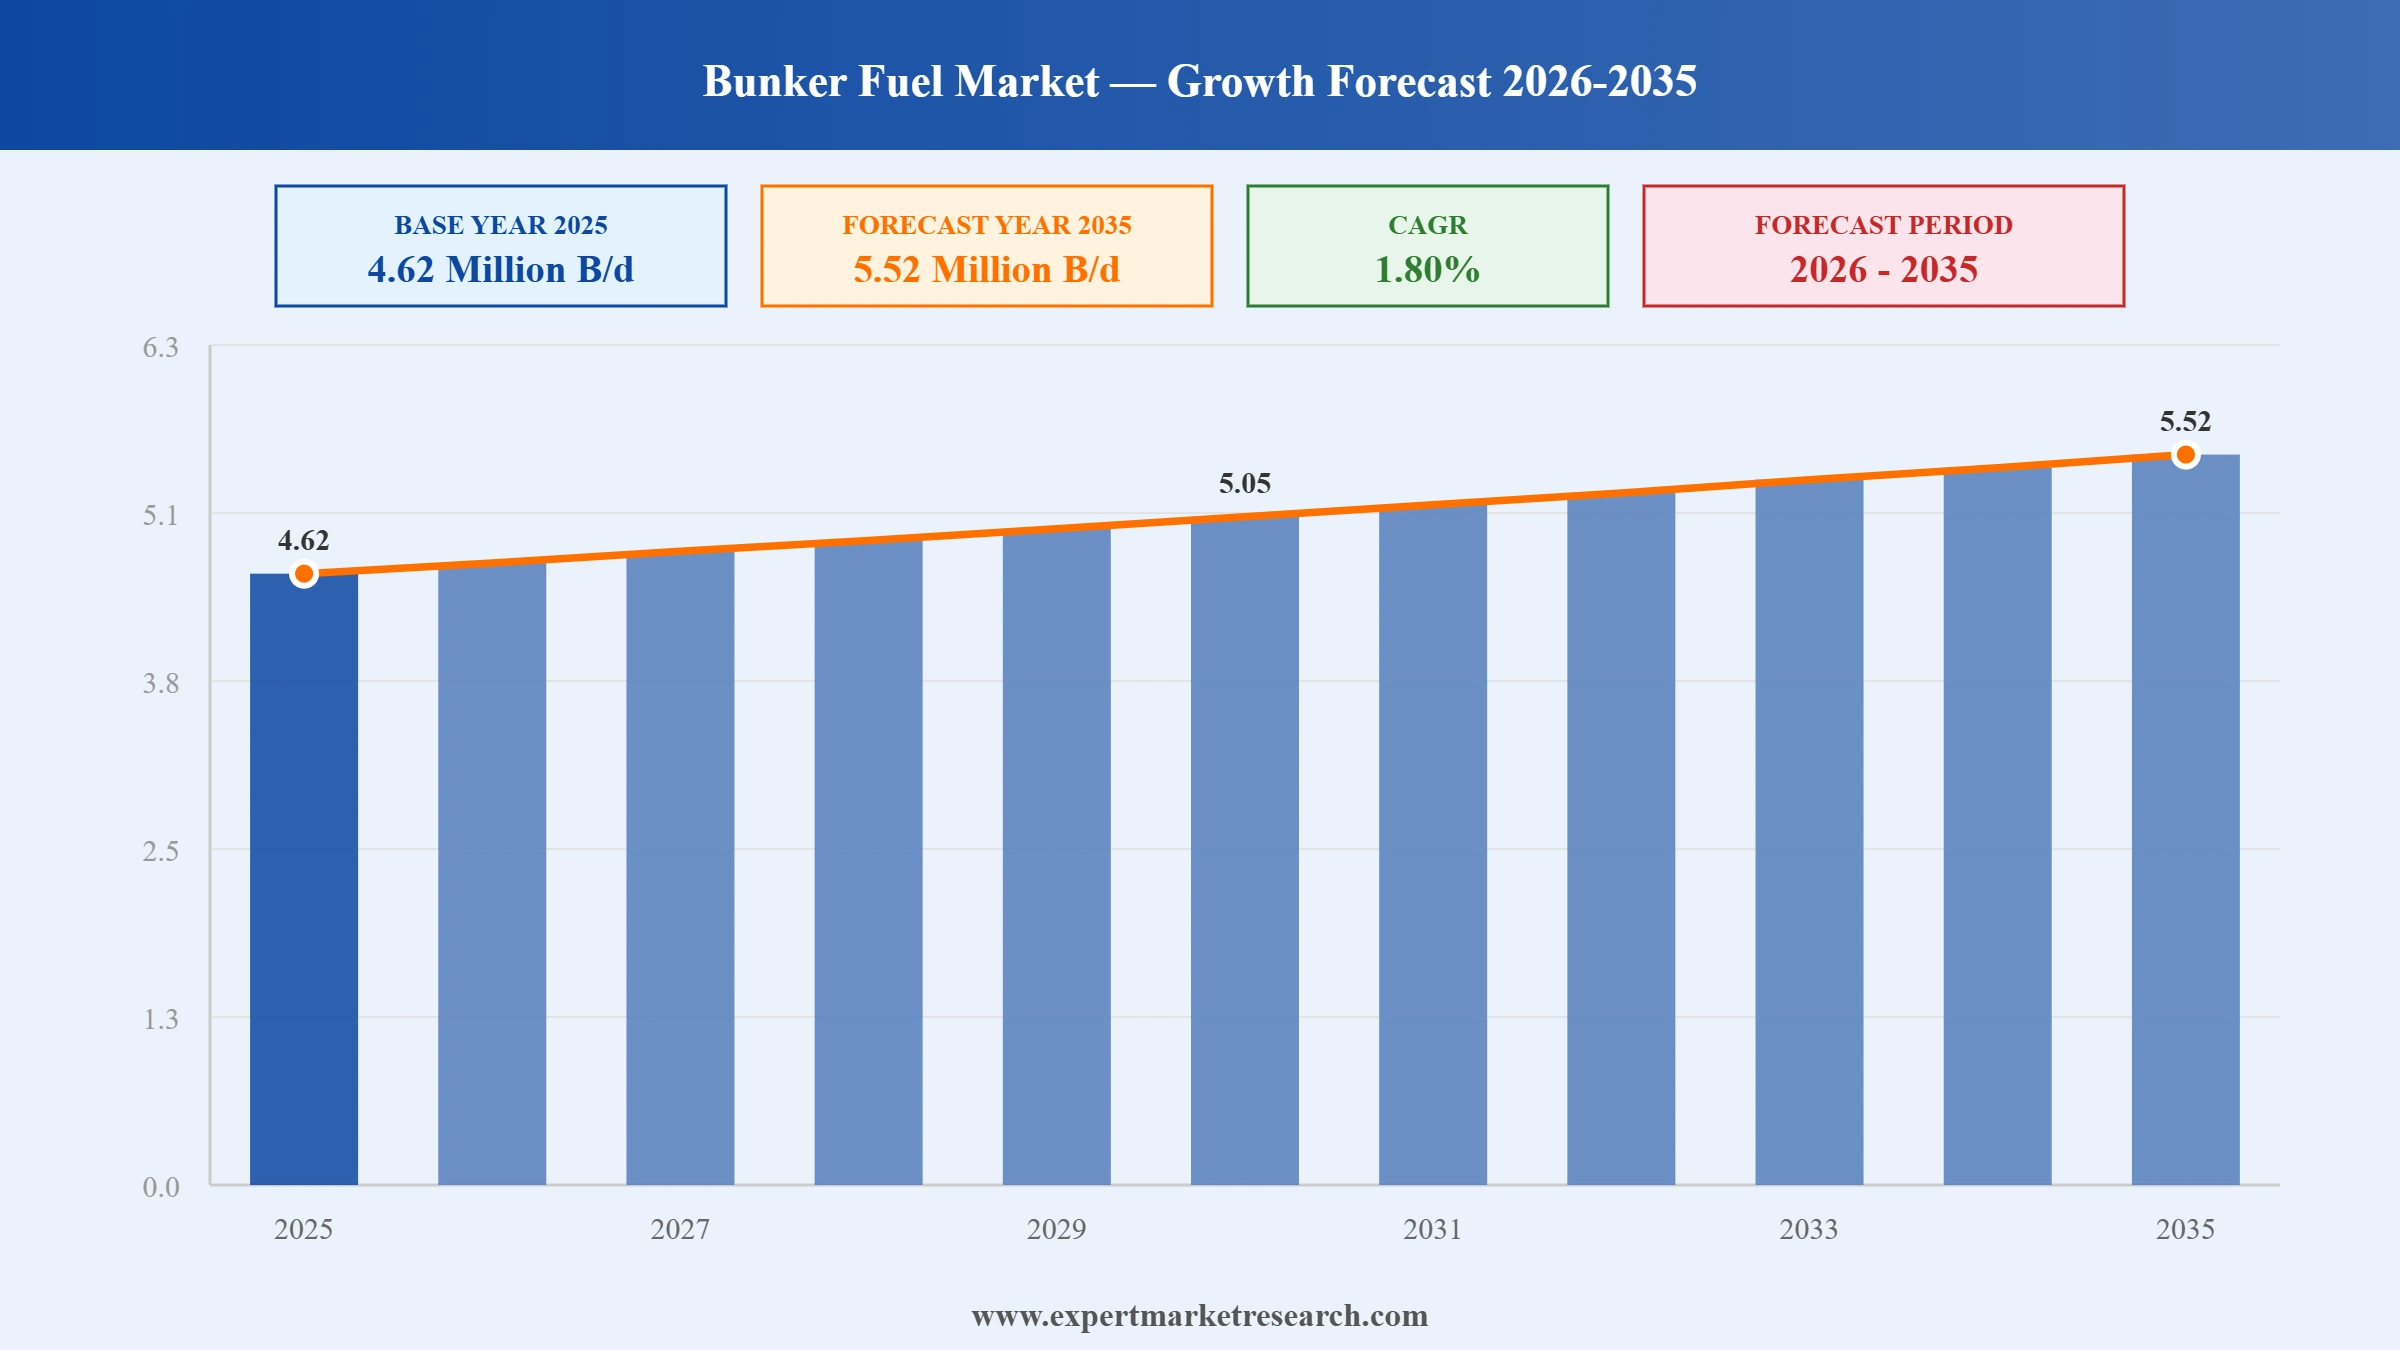
The global bunker fuel market reached 4.62 Million B/d in 2025. The market is further expected to grow at a CAGR of 1.80% in the forecast period of 2026-2035 to reach a volume of about 5.52 Million B/d by 2035, driven by IMO regulations, VLSFO adoption, LNG bunkering, and maritime decarbonization.
Bunker fuel, the general term for the heavy marine fuel oils, distillates, and alternative fuels used to power ocean-going vessels, is one of the most strategically significant commodity markets in the global economy, underpinning approximately 90% of world trade that moves by sea. The market's modest headline CAGR masks a profound structural transformation underway in marine fuel composition: regulatory pressure from the International Maritime Organization (IMO), decarbonization commitments from the world's largest shipping lines, and the rapid commercial expansion of alternative marine fuels including liquefied natural gas (LNG), green methanol, and ammonia are reshaping the bunker fuel value chain in ways that will fundamentally alter competitive dynamics among suppliers, trading hubs, and shipping operators over the forecast decade.
The IMO 2020 sulfur cap, which reduced the global limit for sulfur content in marine fuel from 3.5% to 0.50% effective January 1, 2020, permanently restructured demand away from high-sulfur fuel oil (HSFO) toward very low sulfur fuel oil (VLSFO), marine gasoil (MGO), and exhaust gas cleaning system-equipped vessels running compliant-equivalent fuel. The ongoing tightening of the IMO's Carbon Intensity Indicator (CII) framework, which assigns vessels an annual rating from A to E and requires corrective action plans for persistently underperforming ships, is intensifying the pressure on operators to switch to lower-carbon marine fuels, further accelerating the transition to LNG, methanol, and eventually ammonia and hydrogen as viable bunker alternatives.
Read more about this report - REQUEST FREE SAMPLE COPY IN PDF
| Global Bunker Fuel Market Report Summary | Description | Value |
| Base Year | Million B/d | 2025 |
| Historical Period | Million B/d | 2019-2025 |
| Forecast Period | Million B/d | 2026-2035 |
| Market Size 2025 | Million B/d | 4.62 |
| Market Size 2035 | Million B/d | 5.52 |
| CAGR 2019-2025 | Percentage | XX% |
| CAGR 2026-2035 | Percentage | 1.80% |
| CAGR 2026-2035 - Market by Region | Asia Pacific | 2.1% |
| CAGR 2026-2035 - Market by Country | India | 2.7% |
| CAGR 2026-2035 - Market by Country | China | 2.3% |
| CAGR 2026-2035 - Market by Type | Residual Fuel | 2.0% |
| CAGR 2026-2035 - Market by End Use | Tankers | 2.4% |
| Market Share by Country 2025 | UK | 3.4% |
Global Maritime Trade Growth: The Volume Foundation
The fundamental driver of bunker fuel volume growth is the expansion of global seaborne trade. Approximately 90% of the world's merchandise trade moves by sea, a proportion that has been remarkably stable over decades, and as global GDP grows, trade volumes increase, requiring more vessel voyages and greater fuel consumption. The growth of containerized trade driven by global supply chains, the expansion of LNG shipping as countries diversify energy supply away from Russian pipeline gas, the growth of agricultural commodity trade connecting production surpluses in the Americas with consumption deficits in Asia and Africa, and the expansion of e-commerce generating growing demand for fast container services are all structural drivers of vessel fuel consumption.
IMO Regulatory Framework: From Sulfur Cap to Carbon Intensity
The regulatory framework administered by the International Maritime Organization is the most powerful structural force reshaping the composition, if not the absolute volume, of the global bunker fuel market. The IMO 2020 sulfur cap, which reduced the global sulfur limit in marine fuel from 3.5% to 0.50%, permanently shifted demand from HSFO to VLSFO and MGO for non-scrubber-equipped vessels, and drove significant investment in exhaust gas cleaning systems that allow continued HSFO consumption with sulfur-equivalent compliance. VLSFO now accounts for approximately 43 to 53% of the global bunker fuel market by volume, having become the standard marine fuel of reference for the world's non-scrubber fleet.
The IMO Carbon Intensity Indicator (CII) framework, which entered its operational phase in 2023 and is tightening annual reduction targets through 2026, is the next major regulatory driver reshaping bunker fuel demand patterns. CII rates vessels on an annual A to E scale based on CO2 emissions per unit of transport work, and requires ships rated D for three consecutive years or E for a single year to submit corrective action plans demonstrating a path to a C rating or above. In 2026, the CII framework has evolved from a compliance exercise into a core commercial and financial performance driver: CII ratings now influence vessel chartering decisions, freight rates, port state inspection priorities, and asset valuations, creating powerful economic incentives for operators to switch to lower-carbon fuels, reduce vessel speeds, or retrofit vessels with energy efficiency technologies.
LNG Bunkering: The Leading Alternative Fuel Transition
LNG is the leading alternative marine fuel by volume, with established bunkering infrastructure at major global ports and a growing fleet of LNG dual-fuel vessels. LNG reduces SOx emissions by virtually 100%, NOx by up to 85%, and CO2 by approximately 20% compared to conventional VLSFO on a tank-to-wake basis. The CII framework's CO2 intensity calculation creates commercial advantage for LNG-powered vessels over conventional fuel oil vessels at equivalent operational profiles.
Major oil and gas companies are investing significantly in LNG bunkering infrastructure. BP acquired a 40% stake in a Singapore LNG supplier, adding two 10,000 cubic meter LNG bunkering barges to its fleet. TotalEnergies and ADNOC are pooling resources to develop floating LNG storage in Fujairah, extending Gulf LNG bunkering capability into Asia-bound shipping lanes. Singapore's LNG bunker sales reached 571,000 tonnes in 2025, up 23.9% year-on-year, reflecting accelerating uptake as more dual-fuel capable vessels enter commercial service.
Green Methanol: The Emerging Low-Carbon Alternative
Green methanol produced from renewable energy and sustainable feedstocks, including agricultural waste, municipal solid waste, and captured CO2, is emerging as a commercially viable zero-carbon marine fuel candidate with particular appeal to container shipping lines, including CMA CGM, Maersk, and COSCO, that have made public decarbonization commitments. Methanol is liquid at ambient conditions, can be stored in conventional tanks with modest modifications, and has a growing bunkering supply chain at key ports.
In March 2025, CMA CGM partnered with Preem to secure 50,000 tonnes of renewable methanol annually from 2026. In September 2025, Methanex, the world's largest methanol producer, launched commercial bunkering operations in the ARA region through Tank Match and in South Korea through Alpha Maritime. In February 2026, the United Kingdom's first commercial biomethanol bunkering service was launched at the Port of Immingham through a partnership between Exolum, Methanex, and Orsted. The Port of Singapore awarded three new methanol bunkering licences effective January 1, 2026, and the first Singapore methanol bunkering operation was completed on January 20, 2026, on the Singapore-flagged Brave Pioneer by Golden Island Pte. Singapore's methanol bunker sales grew 87.5% in 2025, though from a very small base of just 3,000 tonnes, indicating the category is in its very early commercial stages.
The global fleet of methanol-capable vessels is expected to grow from approximately 106 to 112 in early 2026, with nearly 300 methanol- or ammonia-capable vessels on order globally as of late 2024, signaling the pace at which the shipping industry is preparing for alternative fuel-capable operations.
Ammonia: The Long-Term Zero-Carbon Candidate
Green ammonia produced by combining green hydrogen with nitrogen using renewable energy is theoretically one of the most compelling long-term zero-carbon marine fuels due to its high energy density per unit weight and the global availability of nitrogen as a feedstock. However, ammonia bunkering is currently at an earlier developmental stage than LNG or methanol, with no commercial ammonia bunkering operations yet established and significant technical, safety, and infrastructure challenges to overcome before commercial-scale deployment.
Shell and the Port of Rotterdam announced a EUR 120 million commitment to develop an ammonia bunkering terminal at Rotterdam, targeting a 2028 operational start-up the most significant announced investment in ammonia bunkering infrastructure to date. In Singapore, the Maritime and Port Authority (MPA) is preparing to publish the world's first Technical Reference standard for ammonia bunkering operations during Q2 2026, a regulatory milestone that will provide the safety and operational framework necessary for commercial ammonia bunkering to begin at the world's largest bunkering port.
Mitsui O.S.K. Lines has ordered two ammonia-fuelled Capesize bulk carriers from Japan Marine United for 2027 delivery, among the first commercial ammonia-capable vessels ordered for the dry bulk sector.
Bunker fuel refers to the fuel used in ships, especially large vessels like tankers and cargo ships, derived from the residue of crude oil distillation. Common types include High Sulfur Fuel Oil (HSFO), Very Low Sulfur Fuel Oil (VLSFO), Marine Gas Oil (MGO), and Liquefied Natural Gas (LNG). Bunker fuels offer several benefits, including cost-effectiveness, with fuels like HSFO being cheaper to produce. Their high energy density allows ships to operate efficiently over vast ocean routes without frequent refuelling.
The bunker fuel demand growth is being fuelled by the increased development of hydrogen resources in offshore areas. Additionally, the rising need for bunker fuel in product tankers and crude oil transportation is playing a significant role in expanding the market. Moreover, the growth of marine trade, spurred by heightened import and export activities, is further contributing to this trend.
Read more about this report - REQUEST FREE SAMPLE COPY IN PDF
The bunker fuel industry growth is being boosted by the increasing adoption of LNG. Liquefied natural gas (LNG) is gaining traction as a bunker fuel due to its lower environmental impact compared to traditional fuels. LNG emits significantly fewer pollutants, including sulfur oxides (SOx) and nitrogen oxides (NOx), making it a popular option for shipping companies aiming to comply with environmental regulations and reduce their carbon footprint.
The bunker fuel market dynamics and trends are influenced by the integration of digital technologies, including AI and blockchain, which optimise fuel consumption and enhance supply chain transparency. Digital tools such as real-time fuel monitoring, route optimization software, and automated engine tuning are helping ships reduce fuel usage and improve operational efficiency. These innovations are driving demand for bunker fuels that optimize performance and support sustainability goals.
The shipping industry is also exploring renewable energy sources such as wind and solar power to supplement traditional bunker fuels. Hybrid systems that integrate renewable energy with conventional marine engines are under development, offering the potential to significantly reduce fuel consumption and emissions. These advancements are part of a broader effort to decarbonise the maritime industry and reduce its environmental footprint, further driving demand in the bunker fuel market.
According to the UNCTAD secretariat, between 2002 and 2022, international maritime trade expanded significantly across various cargo types. In 2002, main bulk cargo, such as coal and iron ore, accounted for approximately 17,000 billion ton-miles, while oil contributed around 12,000 billion ton-miles, and container trade stood at about 3,000 billion ton-miles. Gas trade reached nearly 1,000 billion ton-miles, with chemicals at 2,000 billion. By 2005, main bulk rose to 20,000 billion ton-miles, oil to 13,000 billion, container trade to 5,500 billion, gas to 1,000 billion, and chemicals to 2,000 billion ton-miles. This upward trend continued in 2010, with main bulk growing to 24,000 billion ton-miles, oil reaching 14,500 billion, containers climbing to 7,000 billion, gas at 2,500 billion, and chemicals at 3,500 billion ton-miles.
In 2015, the main bulk increased to 28,000 billion ton-miles, oil maintained around 15,000 billion, container trade advanced to 13,500 billion, gas rose to 6,500 billion, and chemicals to 4,500 billion. By 2020, main bulk had expanded to 32,000 billion ton-miles, oil to 17,000 billion, container trade to 14,500 billion, gas to 7,500 billion, and chemicals to 5,000 billion ton-miles. In 2021, main bulk reached 32,500 billion, oil 15,500 billion, containers 15,000 billion, gas 8,000 billion, and chemicals 5,500 billion ton-miles. In 2022, the trade for main bulk reached 33,000 billion ton-miles, oil at 16,000 billion, containers at 15,500 billion, gas at 8,500 billion, and chemicals at 6,000 billion ton-miles. Increasing maritime trade is boosting the bunker fuel industry's revenue through heightened fuel demand as more vessels operate and transport larger cargo volumes over longer distances.
ExxonMobil Corporation
Royal Dutch Shell plc.
BP Plc
“Global Bunker Fuel Market Report and Forecast 2026-2035” offers a detailed analysis of the market based on the following segments:
Market Breakup by Type
Market Breakup by Fuel Grade
Market Breakup by Commercial Distributors
Market Breakup by End Use
Market Breakup by Region
Marine diesel oil (MDO) is becoming a significant driver in the growth of the bunker fuel industry, over high sulfur fuel oil (HSFO) for several key reasons, largely due to regulatory changes and environmental concerns. One of the primary factors boosting MDO’s growth is compliance with the International Maritime Organization’s (IMO) 2020 regulations, which mandate that ships must use fuels with a sulfur content of no more than 0.5%. HSFO, with its higher sulfur content, is restricted in most regions unless ships are fitted with costly scrubber systems to reduce emissions.
Liquefied natural gas (LNG) is increasingly driving demand in the bunker fuel market over very low sulfur fuel oil (VLSFO) due to several key advantages, particularly around environmental benefits and long-term sustainability. One of the most significant factors is LNG’s ability to significantly reduce harmful emissions compared to VLSFO. LNG emits lower levels of sulfur oxides (SOx), nitrogen oxides (NOx), carbon dioxide (CO2), and particulate matter, making it a much cleaner alternative. As the maritime industry faces growing pressure to reduce its environmental impact, LNG provides a better option for meeting both current and future emission regulations.
Read more about this report - REQUEST FREE SAMPLE COPY IN PDF
The companies specialise in the exploration, production, and distribution of oil and gas, as well as providing a range of energy solutions, including refining, marketing, and the development of renewable energy sources.


Upto 15% Off
USD
$2499 $2249
$3999 $3599
$4999 $4249
$5999 $5099


*While we strive to always give you current and accurate information, the numbers depicted on the website are indicative and may differ from the actual numbers in the main report. At Expert Market Research, we aim to bring you the latest insights and trends in the market. Using our analyses and forecasts, stakeholders can understand the market dynamics, navigate challenges, and capitalize on opportunities to make data-driven strategic decisions.*
In 2025, the bunker fuel market attained a volume of nearly 4.62 Million B/d .
The market is projected to grow at a CAGR of 1.80% between 2026 and 2035.
The market is estimated to witness healthy growth in the forecast period of 2026-2035, reaching a value of around 5.52 Million B/d by 2035.
The major drivers of the industry, such as the rising marine trade, growing oil and gas exploration activities, rising demand from the developing regions, and increasing demand for MDO, are expected to aid the market growth.
The key market trend guiding the growth of the bunker fuel market includes the exploration of these untapped reserves to meet the growing energy demand.
The market is broken down into North America, Europe, Asia Pacific, Latin America, the Middle East, and Africa.
The leading types of bunker fuel in the market are distillate fuel and residual fuel.
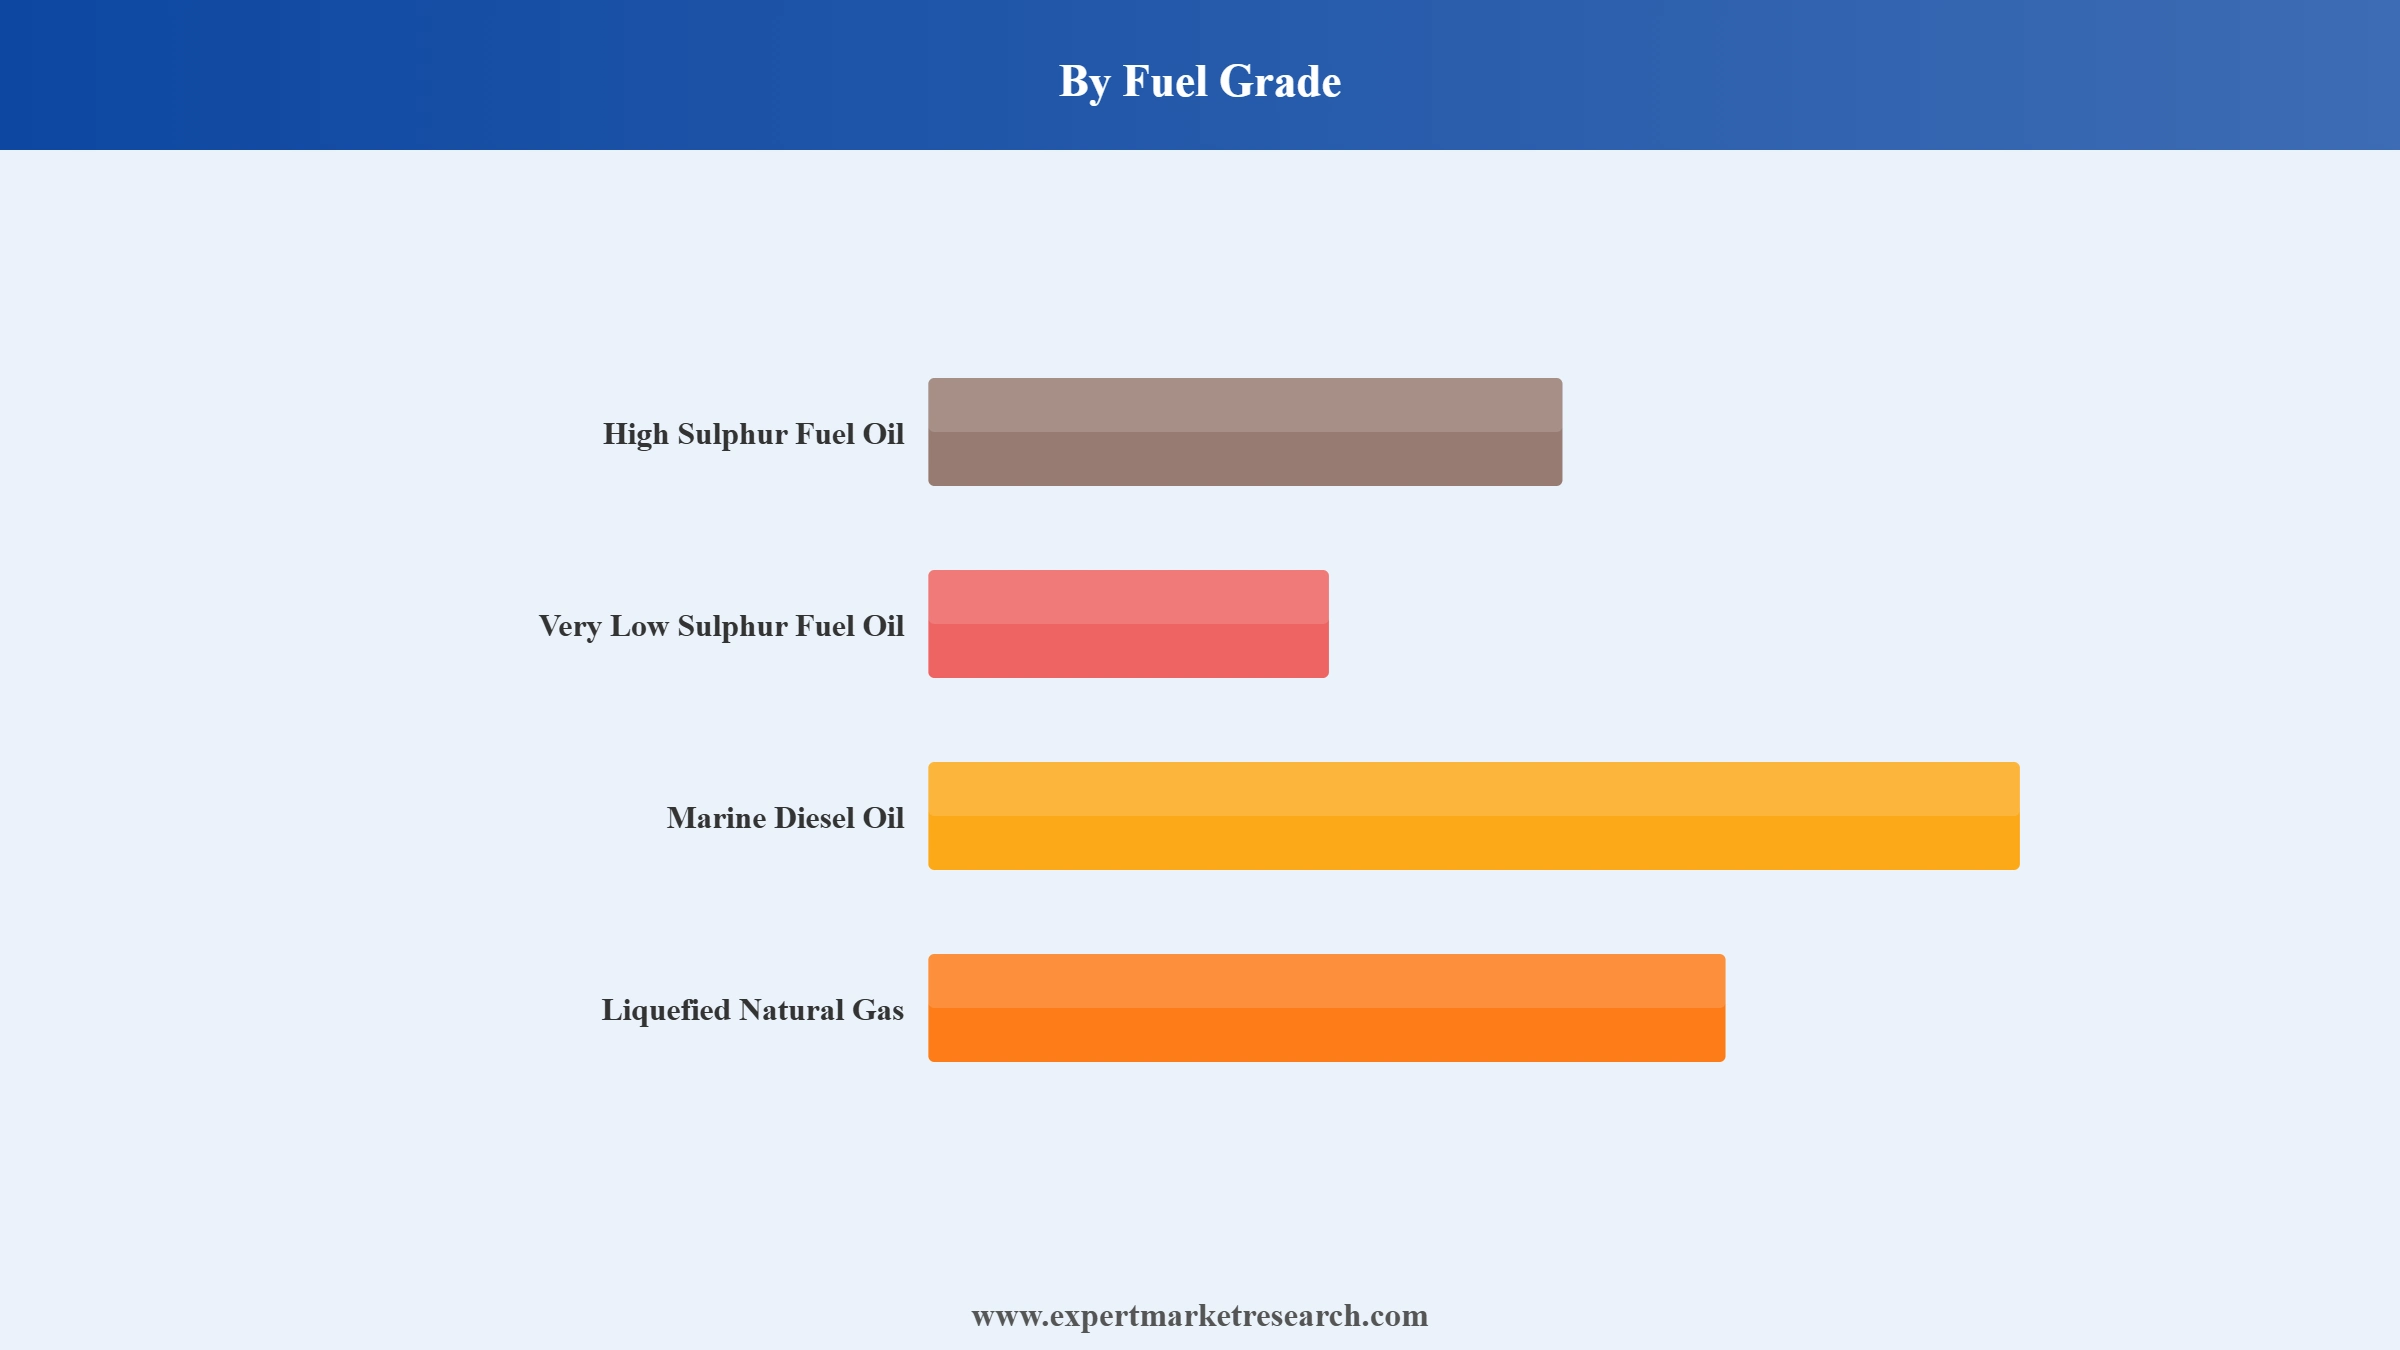
By fuel grade, the market is divided into high sulphur fuel oil (HSFO), very low sulphur fuel oil (VLSFO), marine diesel oil (MDO), liquefied natural gas (LNG), and others.
Based on commercial distributors, the market is segmented into oil majors, large independent, and small independent.
The leading end use sectors in the industry are oil majors, large independent, and small independent.
The competitive landscape consists of ExxonMobil Corporation, Royal Dutch Shell plc., BP Plc, Total SA, Chevron Corporation, and Neste Oyj, among others.
Explore our key highlights of the report and gain a concise overview of key findings, trends, and actionable insights that will empower your strategic decisions.
| REPORT FEATURES | DETAILS |
| Base Year | 2025 |
| Historical Period | 2019-2025 |
| Forecast Period | 2026-2035 |
| Scope of the Report |
Historical and Forecast Trends, Industry Drivers and Constraints, Historical and Forecast Market Analysis by Segment:
|
| Breakup by Type |
|
| Breakup by Fuel Grade |
|
| Breakup by Commercial Distributors |
|
| Breakup by End Use |
|
| Breakup by Region |
|
| Market Dynamics |
|
| Competitive Landscape |
|
| Companies Covered |
|
| Report Price and Purchase Option | Explore our purchase options that are best suited to your resources and industry needs. |
| Delivery Format | Delivered as an attached PDF and Excel through email, with an option of receiving an editable PPT, according to the purchase option. |
Datasheet
One User
USD 2,499
USD 2,249
tax inclusive*
Single User License
One User
USD 3,999
USD 3,599
tax inclusive*
Five User License
Five User
USD 4,999
USD 4,249
tax inclusive*
Corporate License
Unlimited Users
USD 5,999
USD 5,099
tax inclusive*
*Please note that the prices mentioned below are starting prices for each bundle type. Kindly contact our team for further details.*
Flash Bundle
Small Business Bundle
Growth Bundle
Enterprise Bundle
*Please note that the prices mentioned below are starting prices for each bundle type. Kindly contact our team for further details.*
Flash Bundle
Number of Reports: 3
20%
tax inclusive*
Small Business Bundle
Number of Reports: 5
25%
tax inclusive*
Growth Bundle
Number of Reports: 8
30%
tax inclusive*
Enterprise Bundle
Number of Reports: 10
35%
tax inclusive*
How To Order

Select License Type
Choose the right license for your needs and access rights.

Click on ‘Buy Now’
Add the report to your cart with one click and proceed to register.

Select Mode of Payment
Choose a payment option for a secure checkout. You will be redirected accordingly.
Strategic Solutions for Informed Decision-Making
Gain insights to stay ahead and seize opportunities.

Get insights & trends for a competitive edge.

Track prices with detailed trend reports.

Analyse trade data for supply chain insights.

Leverage cost reports for smart savings

Enhance supply chain with partnerships.

Connect For More Information
Our expert team of analysts will offer full support and resolve any queries regarding the report, before and after the purchase.
Our expert team of analysts will offer full support and resolve any queries regarding the report, before and after the purchase.
We employ meticulous research methods, blending advanced analytics and expert insights to deliver accurate, actionable industry intelligence, staying ahead of competitors.
Our skilled analysts offer unparalleled competitive advantage with detailed insights on current and emerging markets, ensuring your strategic edge.
We offer an in-depth yet simplified presentation of industry insights and analysis to meet your specific requirements effectively.




