

Consumer Insights
Uncover trends and behaviors shaping consumer choices today
Procurement Insights
Optimize your sourcing strategy with key market data
Industry Stats
Stay ahead with the latest trends and market analysis.
The busbar market size reached around USD 18.43 Billion in 2025. The market is projected to grow at a CAGR of 5.30% between 2026 and 2035 to reach nearly USD 30.89 Billion by 2035.
According to T&D India, Hitachi Energy and Adani Energy Solutions commissioned one of the world's largest HVDC city center infeeds in Mumbai on April 13, lifting external power supply by 50 percent for over 20 million residents. The project, featuring compact converter stations and 50 km of underground cables, is accelerating demand for high-capacity busbars across substations, converter halls, and renewable energy transmission corridors.
According to Fortune, US data center development has hit snags as the power grid approaches capacity limits, prompting hyperscalers to adopt on-site generation and 800-volt DC power architectures. This shift is intensifying demand for compact, high-density busbar systems in behind-the-meter setups and server halls. Surging AI-driven loads continue to accelerate orders for copper and laminated busbars supporting resilient power distribution.
Compound Annual Growth Rate
5.3%
Value in USD Billion
2026-2035
Read more about this report - REQUEST FREE SAMPLE COPY IN PDF
Busbar is a metallic strip or bar, used in electric power distribution, usually found inside panel boards, switchgear, and busway enclosures for local high-current power distribution. The most common metals used for manufacturing busbars are copper, aluminium, brass, and other efficient alloys that are capable of offering low energy loss during transmission and high conductivity.
The design of the busbar simplifies electrical distribution systems, saves space, and offers scalability for future expansions. It is instrumental in managing power distribution in various electrical installations, making them an essential element in modern electrical infrastructure.
The history of busbar technology reflects the evolution of electrical power distribution systems. Busbar technology continued to evolve over the years, reflecting changes in electrical distribution requirements and advances in technology. Today, busbars are used in a variety of high and low-voltage applications, including production plants, workshops, assembly lines, warehouses, distribution centres, and retail outlets, which is expected to propel the busbar market demand. They offer several advantages over conventional power distribution methods, such as reduced installation times, increased design flexibility, enhanced safety features, and simplicity in design and installation.
The report finds the Asia Pacific to be the largest market in terms of share due to the increase in investments in developing countries by the key players in the market. The Asia Pacific market for busbar is dominated by China, followed by India.
Read more about this report - REQUEST FREE SAMPLE COPY IN PDF
The EMR’s report titled “Busbar Market Report and Forecast 2026-2035” offers a detailed analysis of the market based on the following segments:
The major market segments based on the power rating of busbar are as follows:
The market can be divided on the basis of the type of conductor into:
The market can be broadly categorised on the basis of its end-uses into:
On the basis of industry, the market is divided into:
The report also covers the major regional markets for busbar, which are as follows:


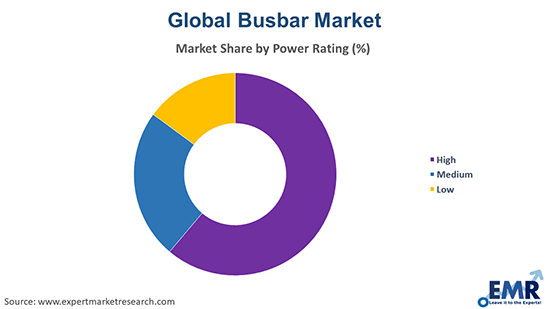
Among these, the low-power segment holds the largest market share. This dominance can be attributed to the widespread use of low-power busbars in distribution panels and switchboards across various utilities and industries. The ongoing investments in the renovation and redevelopment of existing commercial facilities, along with a positive outlook for the industrial sector's development, are stimulating the growth of the low-power busbar market.
High-power busbars, which typically cater to power ranges above 36Kv, are also significant in the market. They are gaining traction due to the need for modernising ultra-high transmission lines to reduce line losses and meet the growing electricity demand.
In the market, copper holds the highest busbar market share compared to aluminium. This predominance is due to several key factors such as copper’s superior electrical conductivity compared to aluminium. This higher conductivity means that copper can carry more current than aluminium of the same size, making it more efficient for use in high-power applications.
Copper also has a higher thermal conductivity, which allows it to dissipate heat more effectively. This is an important characteristic in preventing overheating in electrical systems. Due to its properties, copper is more versatile and can be used in a wider range of applications, including those that require higher power capacities and those where space is limited.
The commercial sector dominates the busbar market. This dominance is driven by increasing power requirements due to rapid urbanisation and commercialisation. In commercial buildings like offices, shopping centres, and hotels, busbars are used for distributing power across different floors and sections. They are preferred over traditional cabling for their ability to handle high power loads and ease of installation and maintenance.
Busbars are critical in data centres for reliable power distribution to server racks and IT equipment. They support high power densities and can be easily reconfigured or expanded as data centre power needs change. Commercial spaces often require extensive lighting systems. Busbars provide a streamlined and efficient way to distribute power to lighting fixtures, especially in large spaces like warehouses, exhibition centres, and retail stores.
The manufacturing sector encompasses a wide range of industries, each requiring efficient and reliable power distribution systems. Busbars are essential in this context due to their ability to effectively distribute high electrical currents over short and medium distances. Manufacturing plants often have high energy demands due to the use of heavy machinery, production lines, and continuous operations. Busbars provide a robust solution for handling such high current loads.
In manufacturing, downtime can prove to be costly. Busbars offer a reliable and efficient way of distributing power, which is crucial for maintaining continuous operations in manufacturing facilities.
The adoption of smart cities and other similar projects will boost the demand for busbars as they are more convenient to be used without any hassle of wires. Rapid urbanisation and commercialisation of the business landscape will increase the demand for busbar as this will surge the electricity demand in these sectors. The need for an effective conductor and lower energy loss during transmission has replaced conventional power distribution methods with highly conductive metal busbars. Besides, busbar helps reduce the cost of installation as it substitutes cables and other related components. Moreover, busbars are safe, reliable, and environmentally friendly, which contributes further to the busbar market growth.
Nevertheless, the availability of cheap and poor-quality goods can limit the growth of the market. Furthermore, the lack of research and development activities and the high price of raw materials may hamper market expansion.
The Asia Pacific region represents a significant energy market, with the expansion of the electrical power distribution sector. Busbars are used to conduct and distribute electrical power in a variety of settings, including industrial, commercial, and residential environments.
The market in the Asia Pacific has been experiencing growth, driven by factors such as increasing electricity demand, industrialisation, and urbanisation in the region. Countries like China, India, and Japan are key players in this market due to their large populations and rapidly growing industrial sectors. The market is also influenced by technological advancements. Innovations in materials, design, and manufacturing processes are some of the crucial busbar market trends that have led to more efficient, safer, and cost-effective busbar solutions. For instance, advancements in insulation materials have enhanced the safety and performance of busbars.
The report presents a detailed analysis of the following key players in the global busbar market, looking into their capacity, market shares, and latest developments like capacity expansions, plant turnarounds, and mergers and acquisitions:
The comprehensive report investigates the macro and micro aspects of the market. The EMR report gives an in-depth insight into the market by providing a SWOT analysis as well as an analysis of Porter’s Five Forces model.
Upto 15% Off
USD
$2499 $2249
$3999 $3599
$4999 $4249
$5999 $5099


*While we strive to always give you current and accurate information, the numbers depicted on the website are indicative and may differ from the actual numbers in the main report. At Expert Market Research, we aim to bring you the latest insights and trends in the market. Using our analyses and forecasts, stakeholders can understand the market dynamics, navigate challenges, and capitalize on opportunities to make data-driven strategic decisions.*
In 2025, the market attained a value of nearly USD 18.43 Billion.
The market is assessed to grow at a CAGR of 5.30% between 2026 and 2035.
The market is estimated to witness a healthy growth in the forecast period of 2026-2035 to reach about USD 30.89 Billion by 2035.
The major market drivers include rising demand for effective conductors, increasing investments in electric power distribution in developing countries, and rapid urbanisation.
The key trends guiding the market include the growing development of smart cities, the rising attempts to reduce energy loss during electric transmission, and the safe, reliable, and environmentally friendly benefits offered by busbars.
The major regions in the market are North America, Latin America, the Middle East and Africa, Europe, and the Asia Pacific.
The major power rating segments of busbar in the market are high, medium, and low.
The significant conductors of busbar considered in the market report include copper and aluminium.
The major end uses of the product are industrial, commercial, residential, and utilities.
The various industries considered in the market report include chemicals and petroleum, metals and mining, and manufacturing, among others.
The major players in the market are Siemens, ABB, Schneider Electric, Eaton Corporation, Mersen, Oriental Copper Co., Ltd, Legrand Electric Ltd, and Southwire Company LLC, among others.
Explore our key highlights of the report and gain a concise overview of key findings, trends, and actionable insights that will empower your strategic decisions.
| REPORT FEATURES | DETAILS |
| Base Year | 2025 |
| Historical Period | 2019-2025 |
| Forecast Period | 2026-2035 |
| Scope of the Report |
Historical and Forecast Trends, Industry Drivers and Constraints, Historical and Forecast Market Analysis by Segment:
|
| Breakup by Power Rating |
|
| Breakup by Conductor |
|
| Breakup by End Use |
|
| Breakup by Industry |
|
| Breakup by Region |
|
| Market Dynamics |
|
| Competitive Landscape |
|
| Companies Covered |
|
Datasheet
One User
USD 2,499
USD 2,249
tax inclusive*
Single User License
One User
USD 3,999
USD 3,599
tax inclusive*
Five User License
Five User
USD 4,999
USD 4,249
tax inclusive*
Corporate License
Unlimited Users
USD 5,999
USD 5,099
tax inclusive*
*Please note that the prices mentioned below are starting prices for each bundle type. Kindly contact our team for further details.*
Flash Bundle
Small Business Bundle
Growth Bundle
Enterprise Bundle
*Please note that the prices mentioned below are starting prices for each bundle type. Kindly contact our team for further details.*
Flash Bundle
Number of Reports: 3
20%
tax inclusive*
Small Business Bundle
Number of Reports: 5
25%
tax inclusive*
Growth Bundle
Number of Reports: 8
30%
tax inclusive*
Enterprise Bundle
Number of Reports: 10
35%
tax inclusive*
How To Order

Select License Type
Choose the right license for your needs and access rights.

Click on ‘Buy Now’
Add the report to your cart with one click and proceed to register.

Select Mode of Payment
Choose a payment option for a secure checkout. You will be redirected accordingly.
Strategic Solutions for Informed Decision-Making
Gain insights to stay ahead and seize opportunities.

Get insights & trends for a competitive edge.

Track prices with detailed trend reports.

Analyse trade data for supply chain insights.

Leverage cost reports for smart savings

Enhance supply chain with partnerships.

Connect For More Information
Our expert team of analysts will offer full support and resolve any queries regarding the report, before and after the purchase.
Our expert team of analysts will offer full support and resolve any queries regarding the report, before and after the purchase.
We employ meticulous research methods, blending advanced analytics and expert insights to deliver accurate, actionable industry intelligence, staying ahead of competitors.
Our skilled analysts offer unparalleled competitive advantage with detailed insights on current and emerging markets, ensuring your strategic edge.
We offer an in-depth yet simplified presentation of industry insights and analysis to meet your specific requirements effectively.


