

Consumer Insights
Uncover trends and behaviors shaping consumer choices today
Procurement Insights
Optimize your sourcing strategy with key market data
Industry Stats
Stay ahead with the latest trends and market analysis.
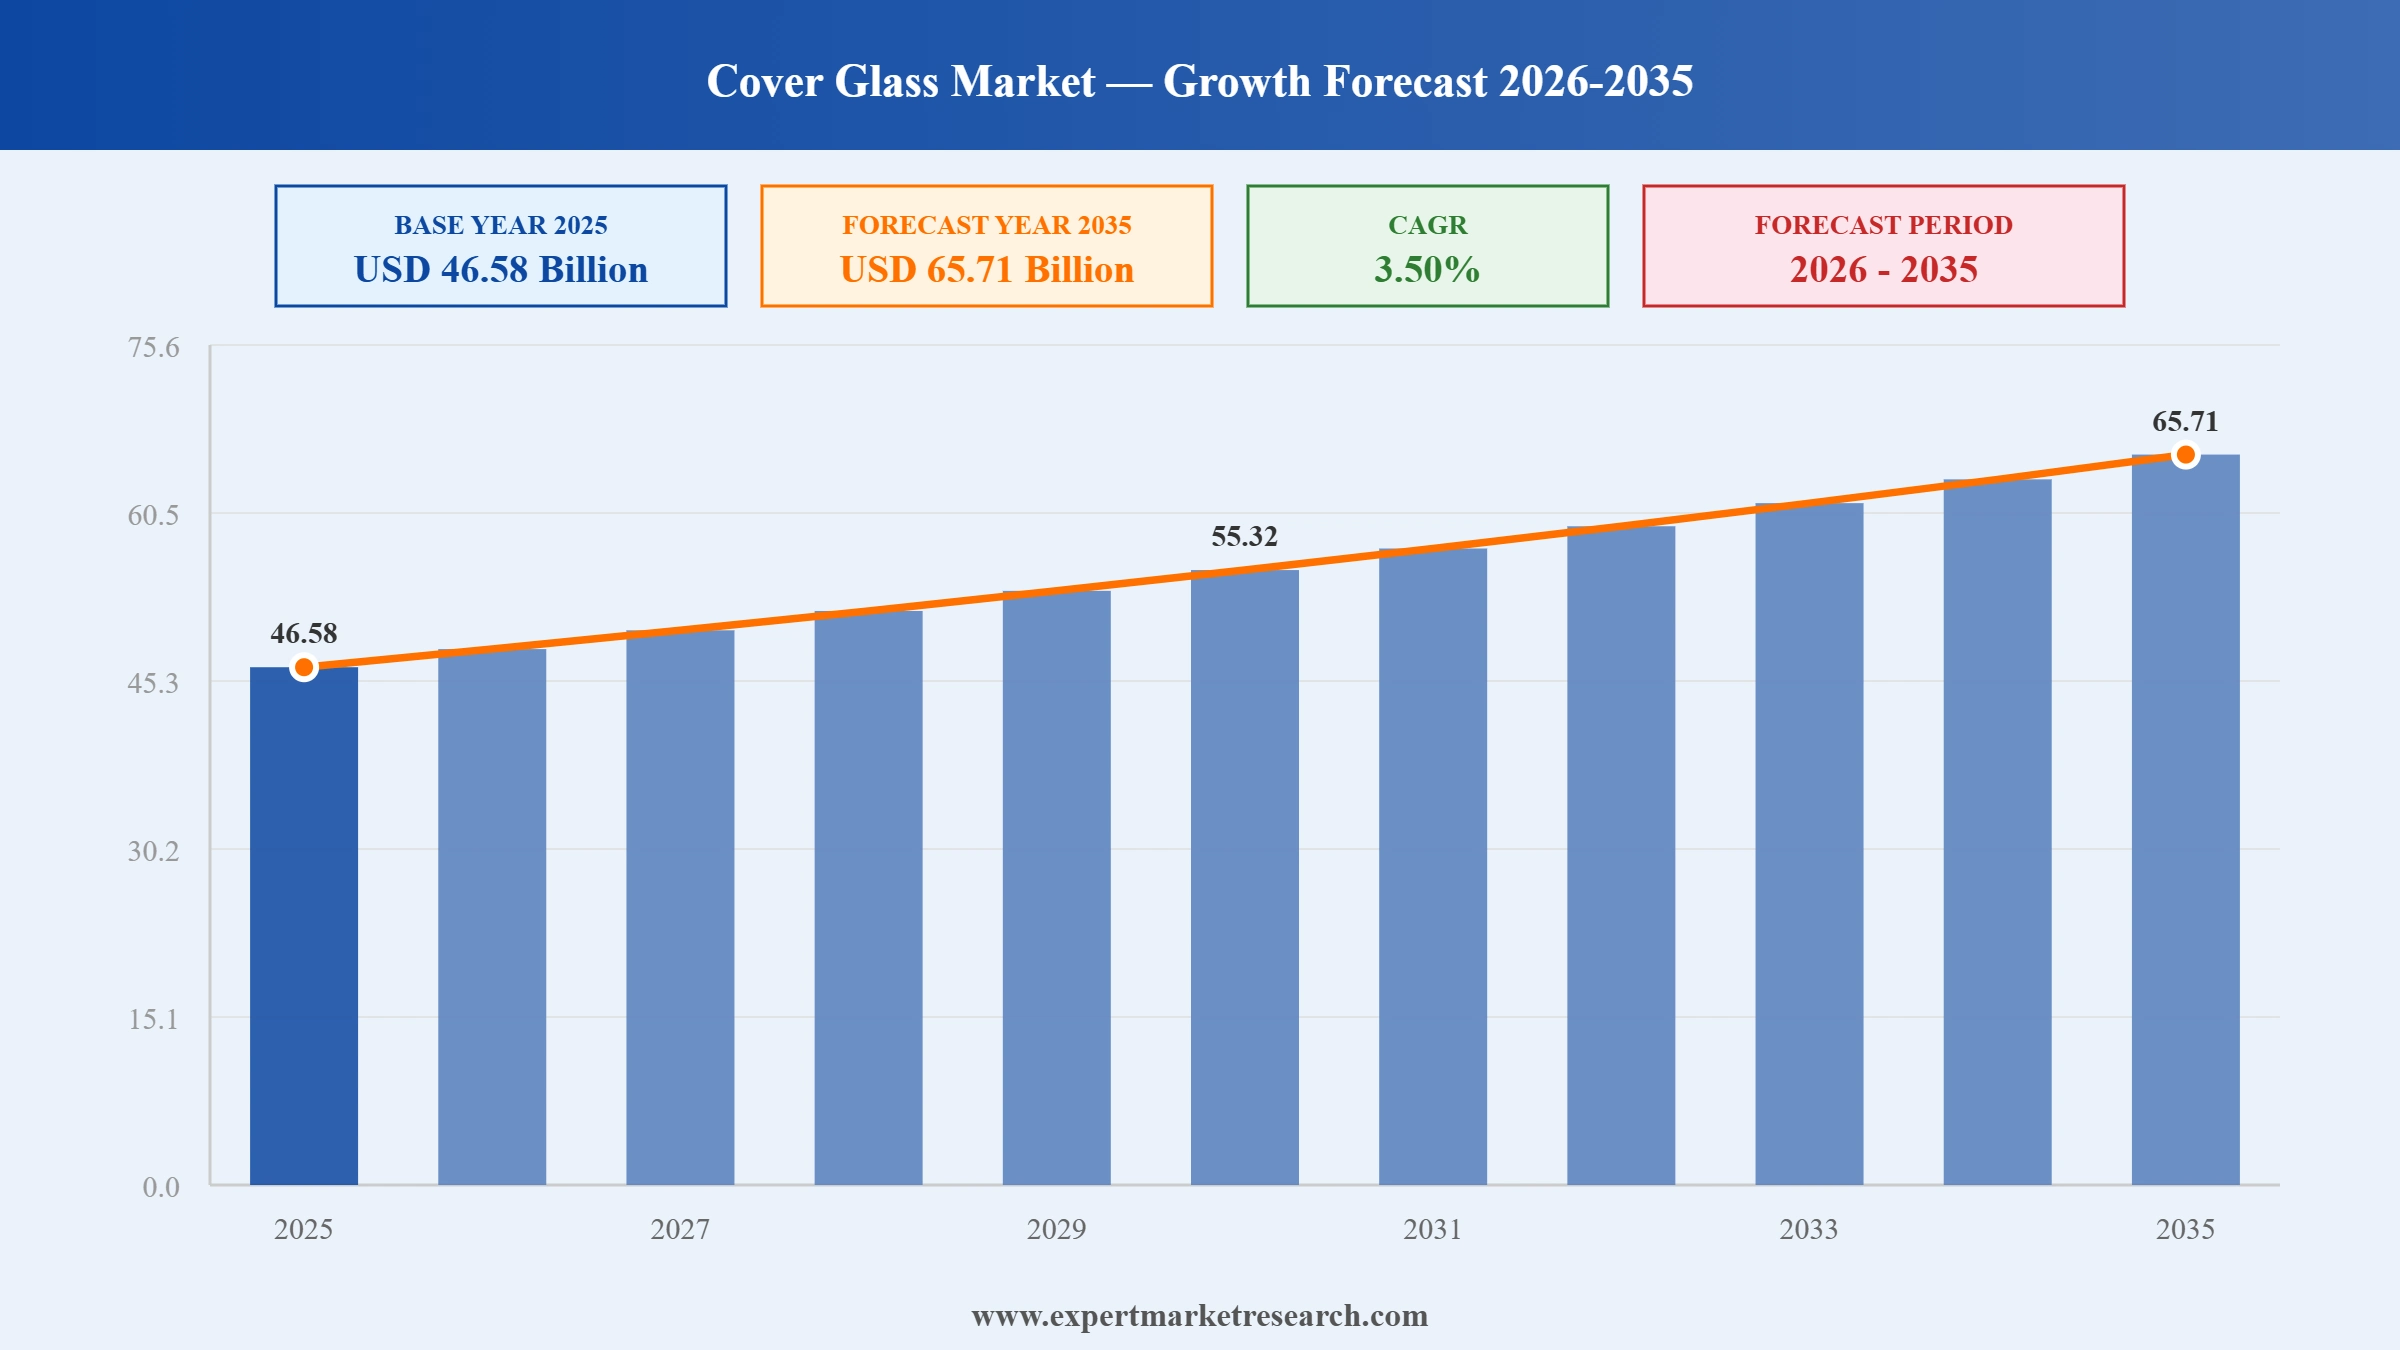
The global cover glass market has reached a value of USD 46.58 Billion at 2025 and is expected to grow at a CAGR of around 3.50% during the forecast period of 2026-2035. Growth is propelled by the sale of smartphones, foldable devices, and wearable adoption, expanding automotive display integration, and continuous glass-ceramic hybrid material innovation delivering superior drop and scratch resistance, pushing the market toward USD 65.71 Billion by 2035.
Read more about this report - REQUEST FREE SAMPLE COPY IN PDF
The global cover glass market is in an fast-moving phase of material innovation, with glass-ceramic compounds and nano-coated surfaces replacing conventional aluminosilicate formulations in flagship programmes. Automotive display integration, foldable smartphones, and smartwatch proliferation are broadening the application base well beyond traditional smartphone protection.
Corning Incorporated launched Gorilla Glass Ceramic 3 in March 2026. It is designed for enhanced drop durability and survives at least 20 repeated one-meter drops onto asphalt-simulating surfaces. The material was selected for the Motorola's razr fold which was the first foldable device to incorporate glass ceramic technology, showcased at Mobile World Congress 2026 in Barcelona.
Corning received CES 2026 Innovation Awards in December 2025, speicifically, for two glass surface treatments. Gorilla Matte Pro is recognized in Computer Peripherals and Accessories. It also combines durability and strength with advanced optical clarity.
Corning announced Gorilla Glass Ceramic in March 2025 as a glass-ceramic material. It was delivering better drop performance on rough surfaces than conventional aluminosilicate glass. The material expanded Corning's OEM portfolio and was initially deployed on a Motorola device, which supports its strategy of successive glass-ceramic generations targeting the premium cover glass tier.
Samsung and Corning announced in January 2025 that the Galaxy S25 Ultra would feature Gorilla Armor 2, the first scratch-resistant and anti-reflective glass ceramic for mobile devices. The material combines superior toughness with optical clarity, setting a new benchmark for mobile display protection and picking up pace consumer awareness of glass ceramic technology.
Foldable and rollable smartphone commercialisation is creating a fast-growing demand segment for ultrathin glass capable of repeated folding without fracture or delamination. OEMs in South Korea and China deploy specialty ultrathin glass from Corning, Schott, and Nippon Electric Glass for inner flexible displays, representing the most technically demanding and value-accretive application for cover glass producers.
Rapid growth in in-vehicle infotainment, digital instrument clusters, and head-up displays is pushing demand for automotive cover glass. Automotive specifications need better thermal stability, anti-reflective coatings, and also vibration resistance.
Advanced scratch-resistant and anti-reflective coatings enable cover glass producers to differentiate premium products beyond impact resistance. Corning's Gorilla Glass Ceramic range combines glass and ceramic properties for unprecedented scratch resistance alongside impact protection. Growing consumer expectations for optical clarity throughout multi-year device ownership are picking up pace coating technology investment.
AR/VR headset commercialization essentially creates a technically demanding premium segment. It requires an ultrathin, optically precise, lightweight glass balancing transmission clarity with better structural resilience. Brands like Meta, Apple, Microsoft, and Asian electronics manufacturers specify advanced cover glass for headset optics and waveguides because it requires a more dedicated material development effort, unlike smartphone panel applications.
Growing OEM sustainability mandates are picking up pace recycled glass content and energy-efficient melting adoption across cover glass manufacturing. Apple and Samsung have committed to increasing recycled content across supply chains, creating downstream demand for cover glass suppliers to certify and report recycling input levels at commercial scale.
The report of the Expert Market Research's titled "Global Cover Glass Market Report and Forecast 2026-2035" offers a detailed analysis of the market based on the following segments:
Market Breakup by Type
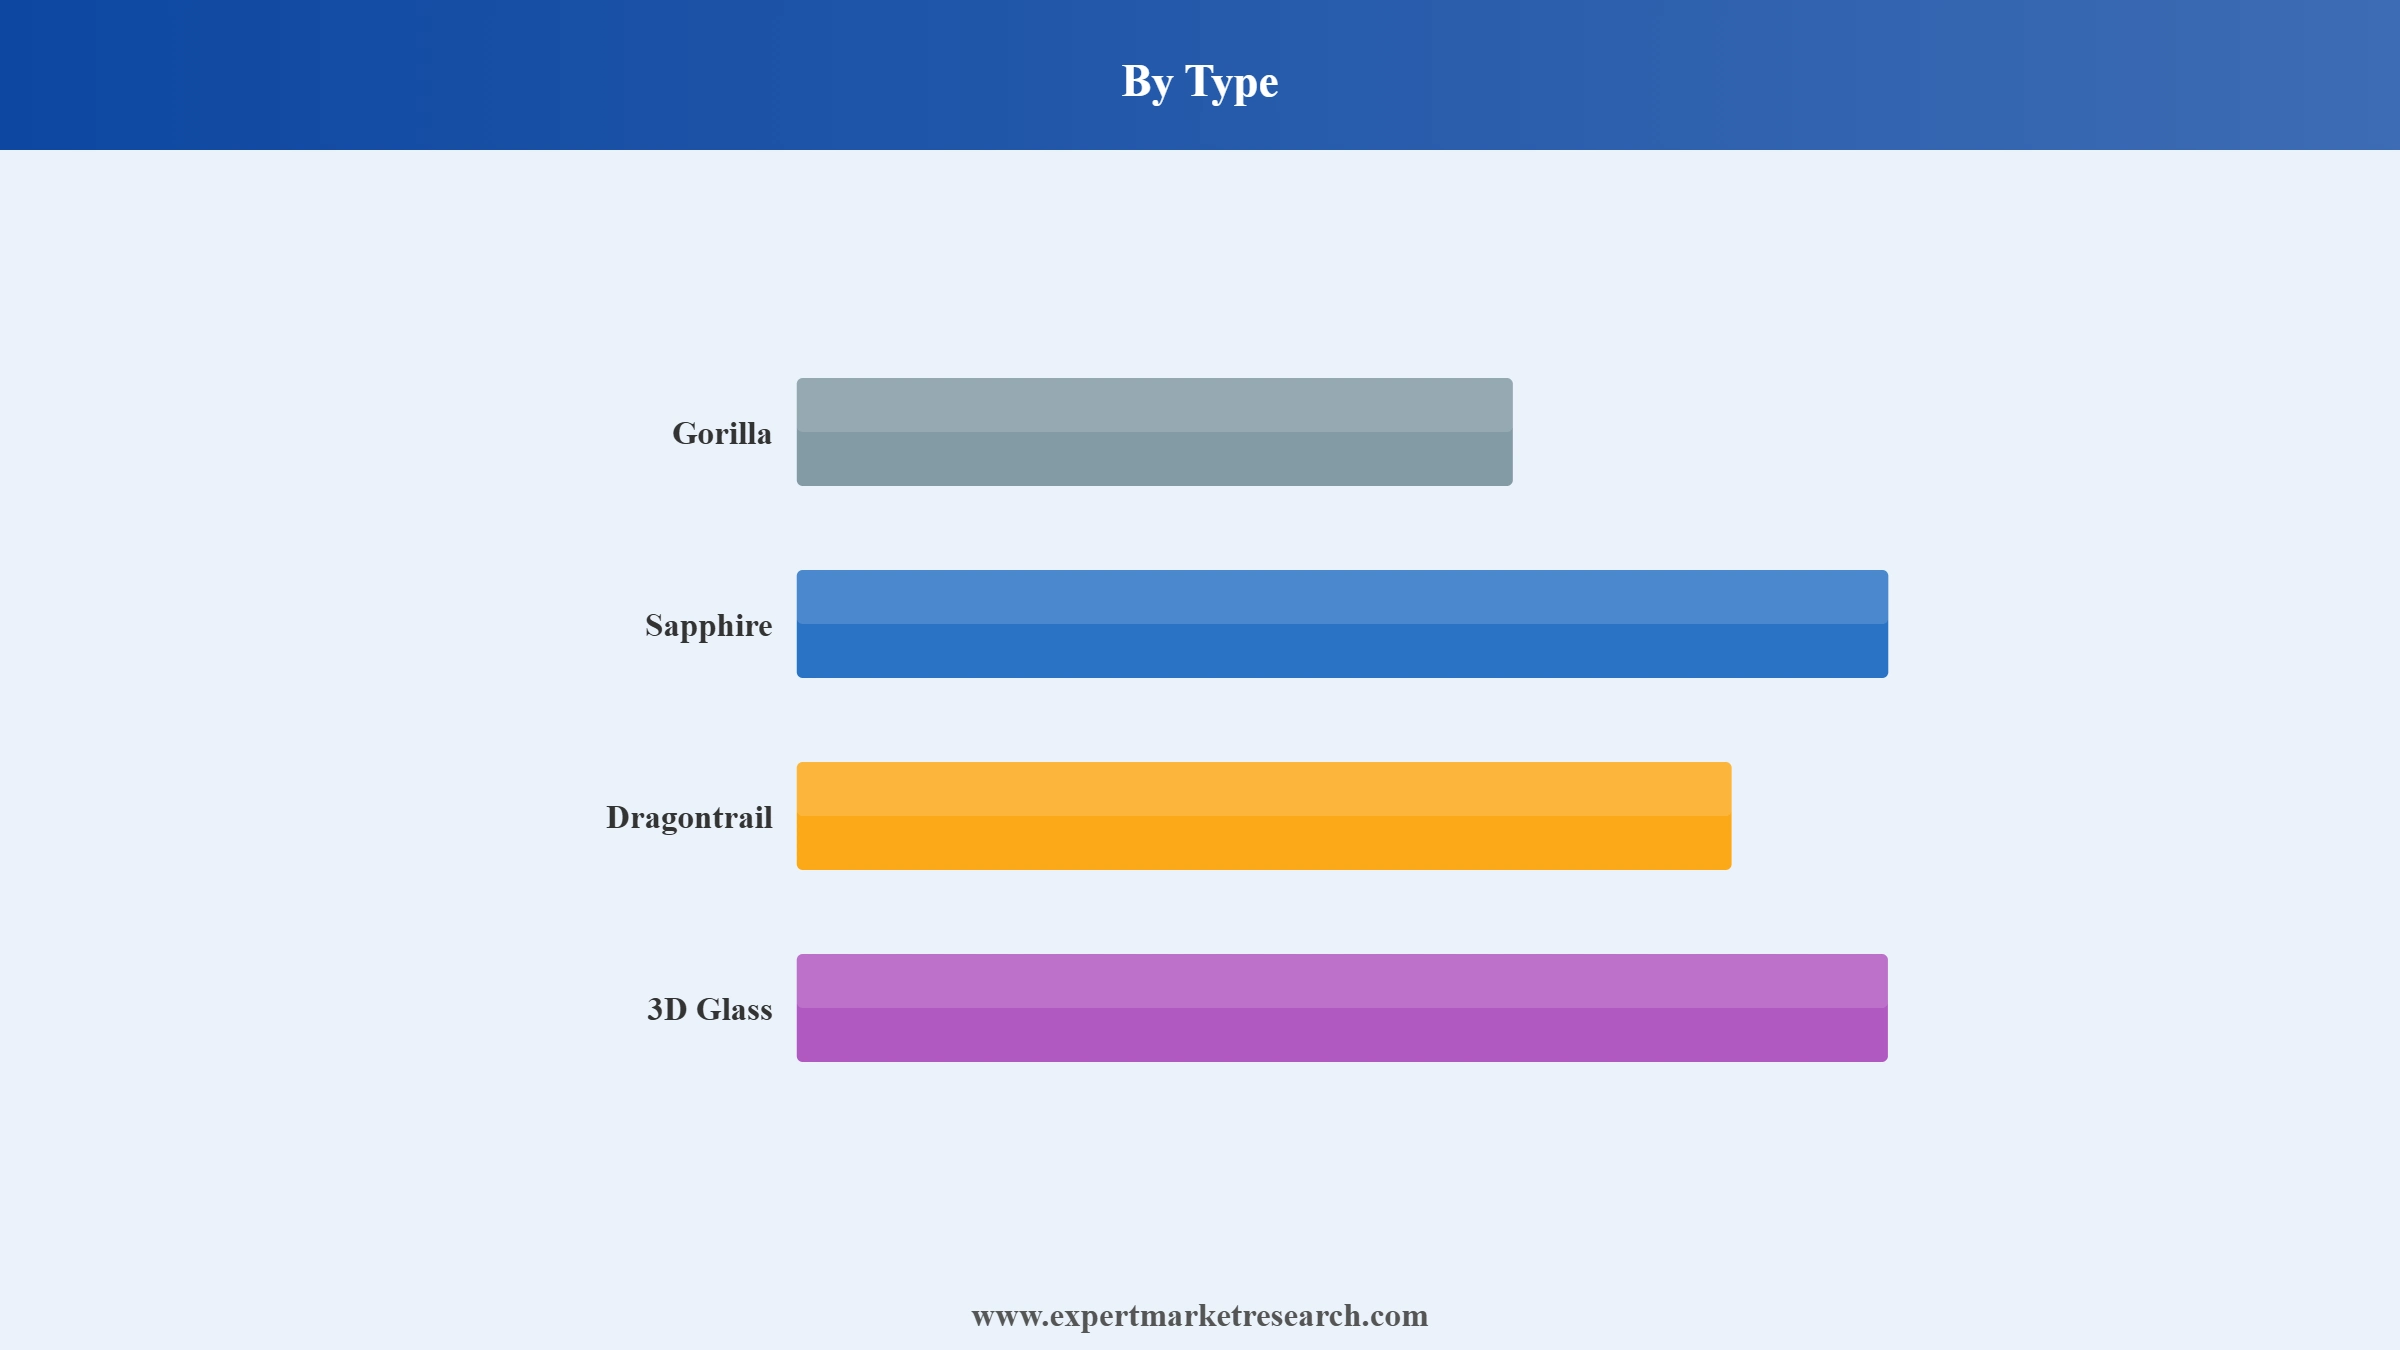
Key Insight: Gorilla glass holds the dominant share by type, driven by wide adoption from entry-level to flagship smartphones, proven performance credentials, and Corning’s deeply embedded OEM qualification relationships.
Market Breakup by Application
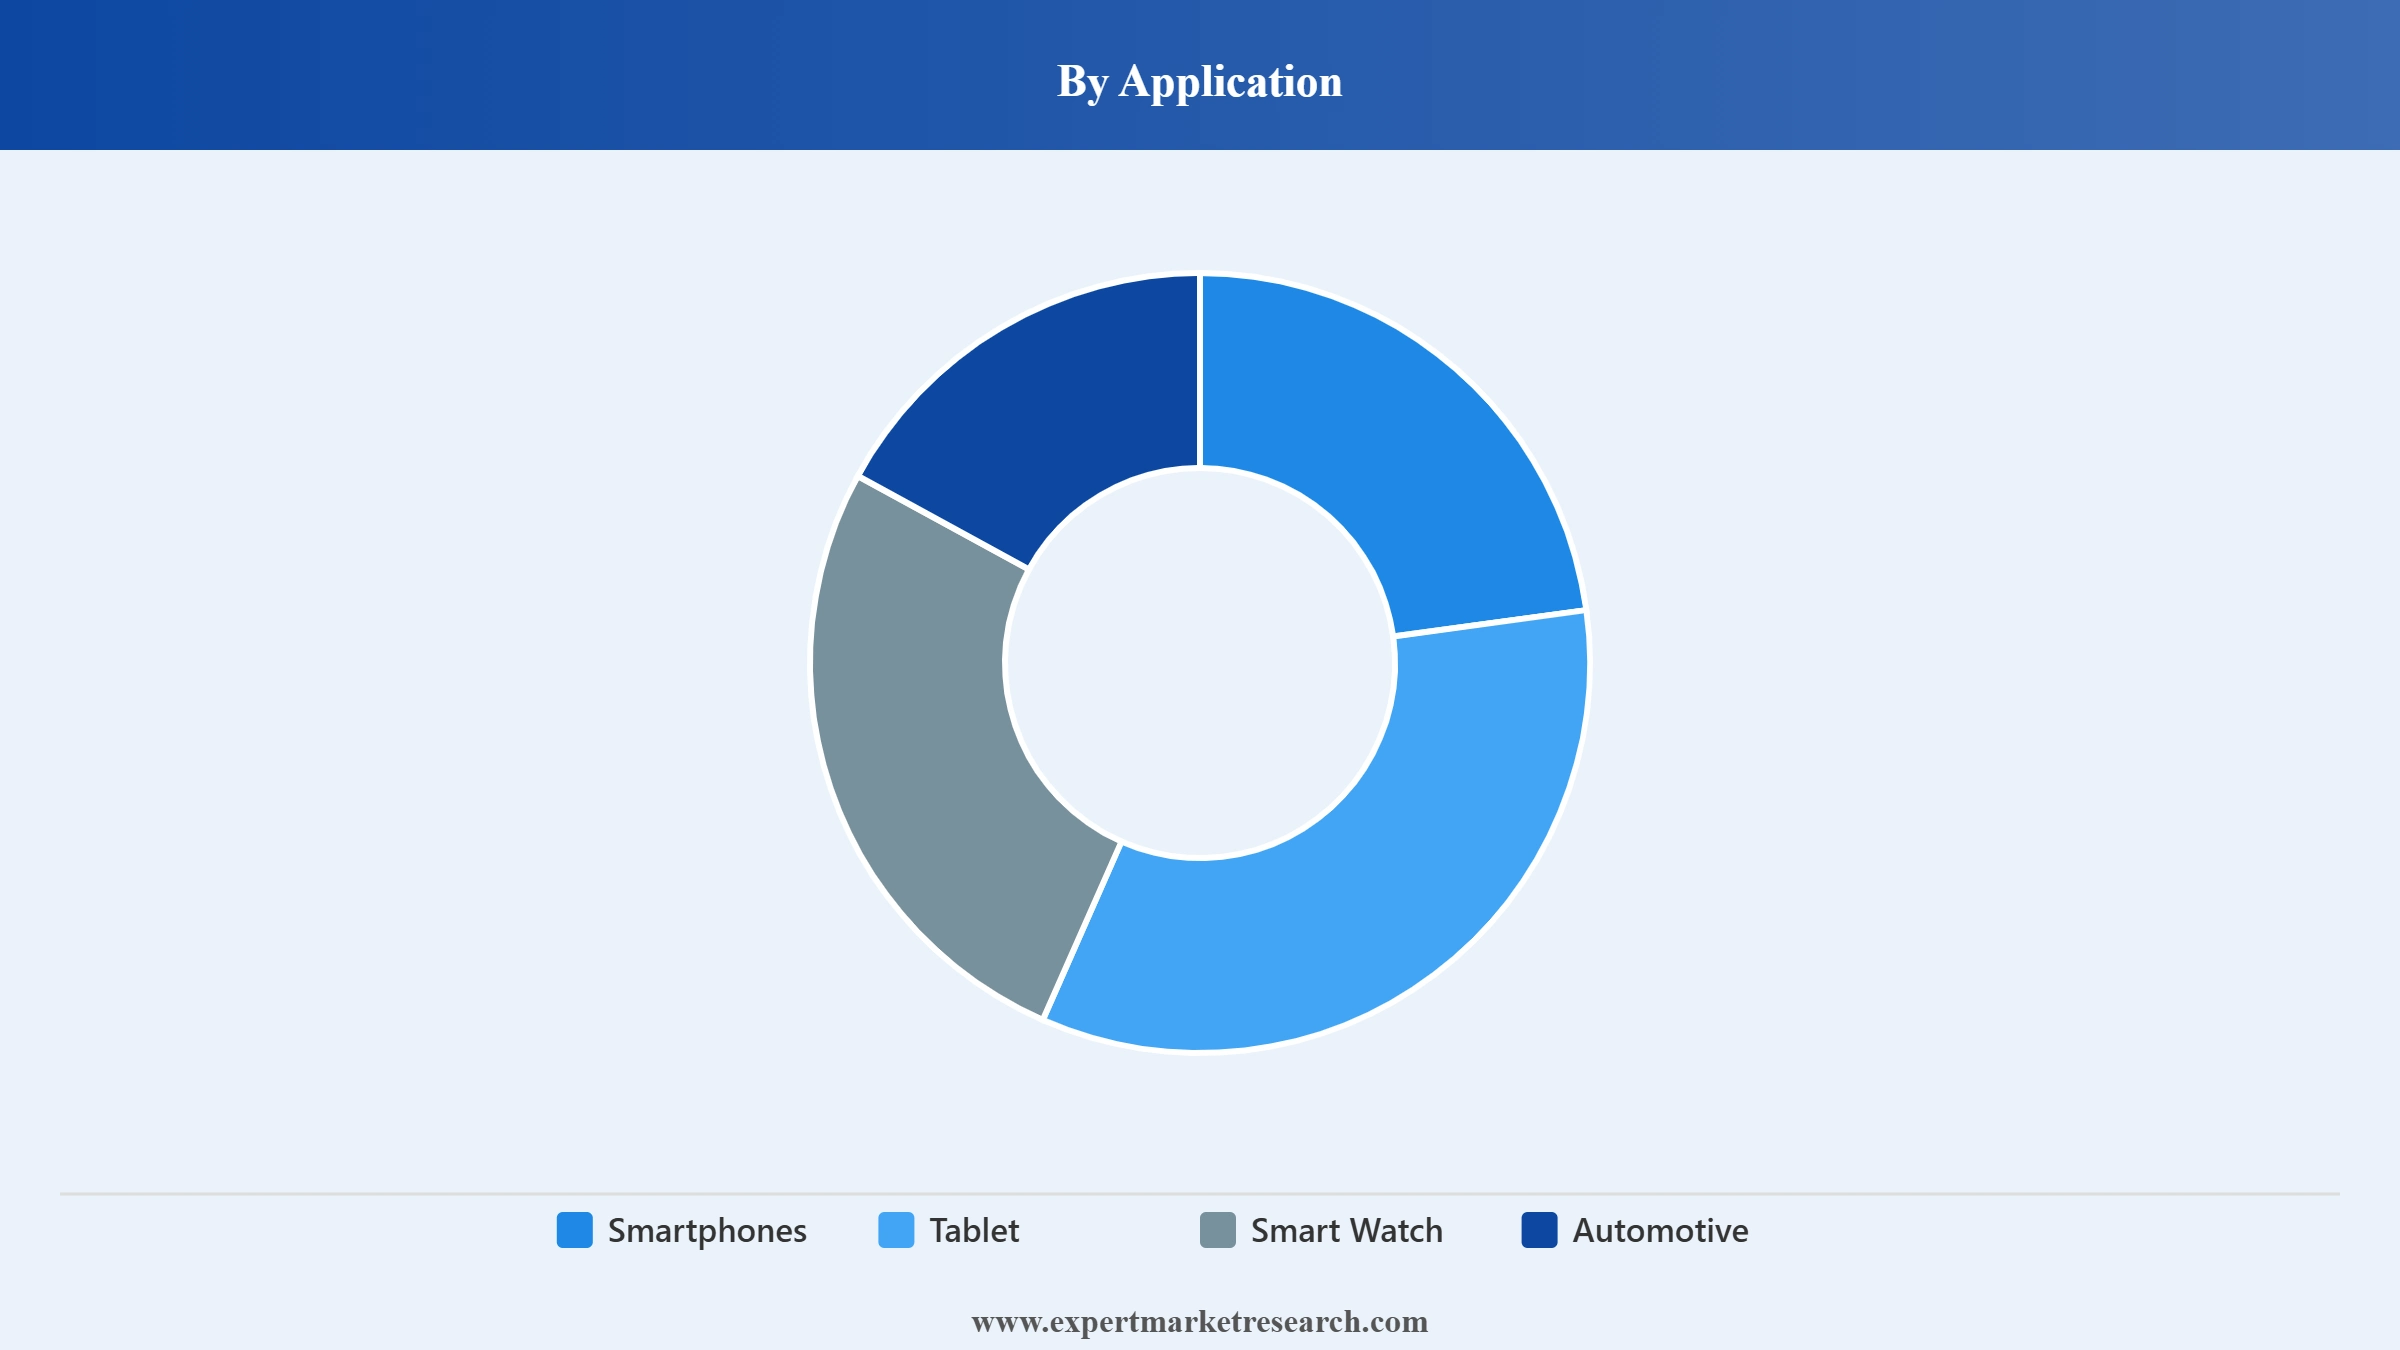
Key Insight: Smartphones account for the largest application share, driven by near-universal toughened cover glass adoption across all device price tiers. Smartwatches are the fastest-growing application, fuelled by rising shipment volumes from Samsung, Apple, and Chinese OEMs. Automotive is an emerging structural growth driver as in-vehicle display penetration expands from premium to mass-market vehicles.
Market Breakup by Region
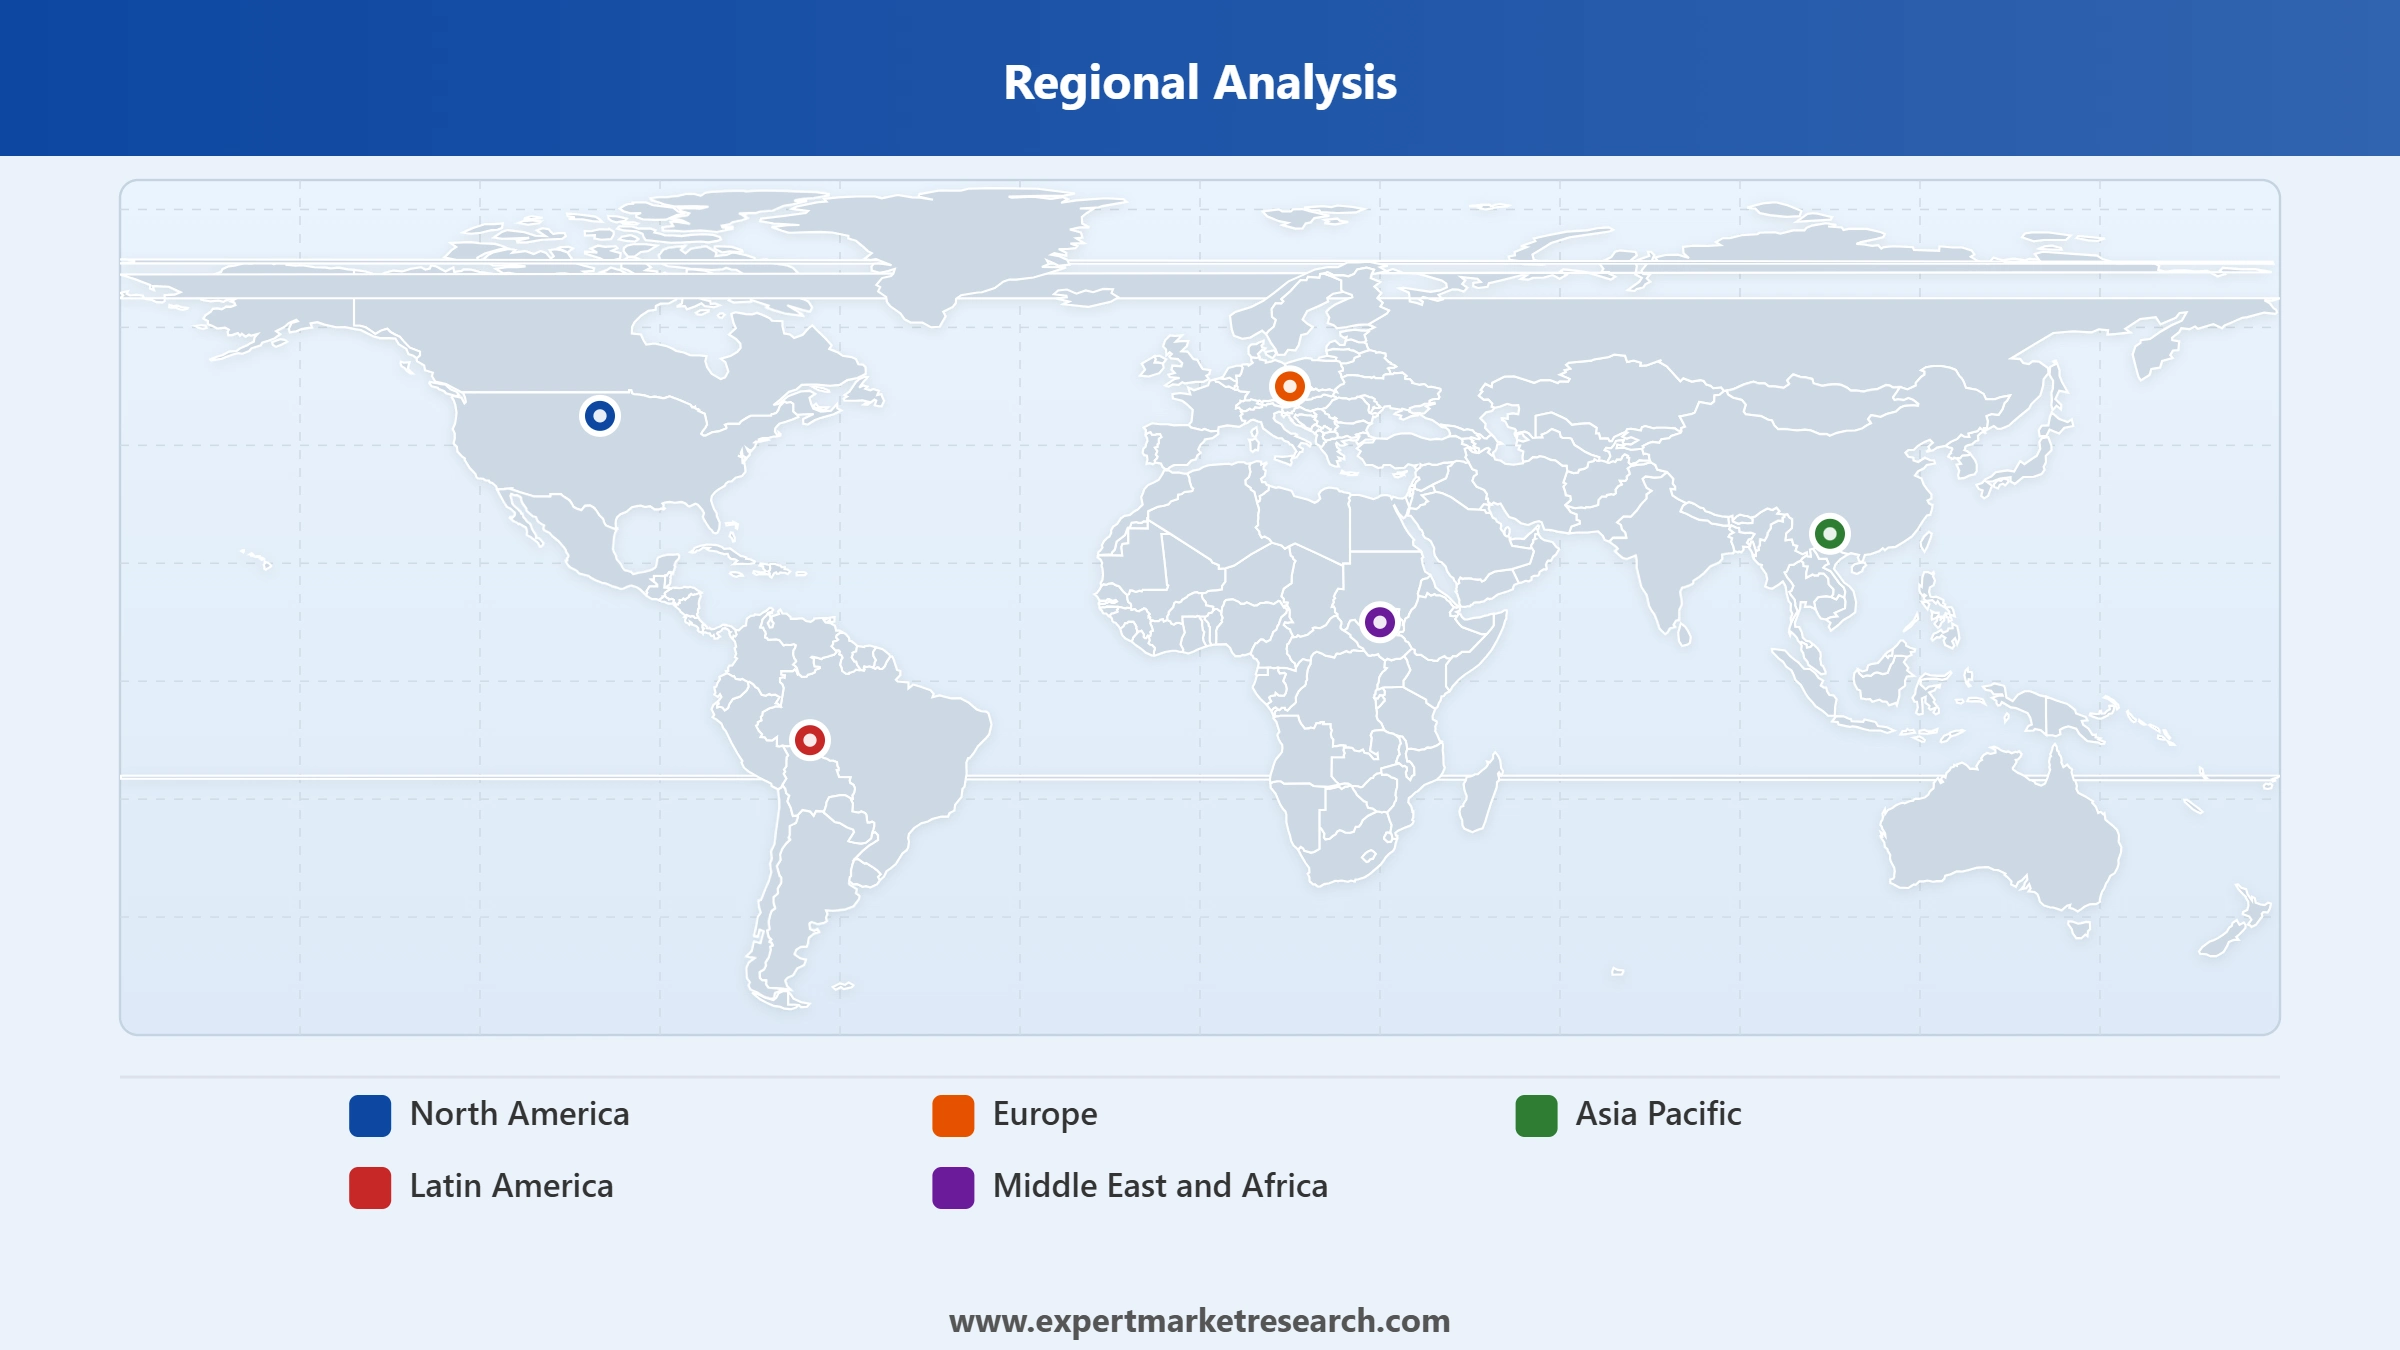
Key Insight: Asia Pacific holds the dominant and fastest-growing regional share, anchored by China’s smartphone manufacturing scale, South Korea’s flagship device production, and Taiwan’s display ecosystem. North America maintains a premium position backed by high-value smartphone procurement, automotive display adoption, and Corning’s New York headquarters advantage in glass material innovation.


Read more about this report - REQUEST FREE SAMPLE COPY IN PDF
By Type, Gorilla glass dominates the market due to its extensive OEM qualification base, proven toughness credentials, and continuous innovation through glass-ceramic hybrid technologies.
Gorilla Glass has built a dominant position through successive product generations delivering measurably improved drop and scratch resistance that underpin OEM qualification programmes. The material spans the full smartphone range from budget Android handsets to premium flagship devices from Samsung, Apple, and Chinese brands. Sapphire glass holds a niche premium position, valued for exceptional scratch hardness preferred for luxury smartwatch faces and premium camera lens covers. Its high production cost limits mass-market penetration, but its use in high-end wearables provides a durable premium revenue stream.
Read more about this report - REQUEST FREE SAMPLE COPY IN PDF
By Application, the smartphones segment accounts for the dominant share of the market due to the high-volume demand for toughened cover glass across all device price tiers globally.
Smartphones underpin the global cover glass market, with virtually every device globally incorporating toughened cover glass as a standard protective component. Annual shipments in the hundreds of millions from Chinese, South Korean, and Taiwanese manufacturers sustain base demand. Meanwhile, premium glass-ceramic and foldable ultrathin glass adoption supports revenue growth. Automotive is the structurally fastest-growing segment, driven by the transition from single instrument clusters to multi-display cockpit architectures. Automotive specifications require broader temperature ranges, anti-glare performance, and higher mechanical shock resistance than consumer electronics.
Read more about this report - REQUEST FREE SAMPLE COPY IN PDF
Asia Pacific dominates the global cover glass market due to its concentrated consumer electronics manufacturing ecosystems in China, South Korea, and Taiwan, which absorb the majority of global cover glass production volumes.
Asia Pacific holds the largest and fastest-growing regional share, led by China's smartphone manufacturing scale, South Korea's Samsung and LG supply chains, and Taiwan's display manufacturing ecosystem. Huawei, Xiaomi, OPPO, and Vivo collectively ship hundreds of millions of devices annually.
North America holds the second-largest regional position, backed by Apple’s iPhone procurement volume, premium automotive cover glass demand, and Corning’s New York headquarters, allowing technology leadership in glass innovation. North American automotive display adoption is picking up pace as US vehicle manufacturers expand digital cockpit architectures.
Read more about this report - REQUEST FREE SAMPLE COPY IN PDF
The global cover glass market is highly concentrated, with Corning holding a commanding leadership position through its Gorilla Glass franchise spanning entry-level to ultra-premium device tiers. continued innovation competition among a small group of technically advanced producers focuses on drop height survival, scratch resistance, and optical clarity.
Founded in 1851 and headquartered in Corning, New York, Corning Incorporated is the world’s leading specialty glass and ceramics innovator, with Gorilla Glass commanding dominant market share. The company’s glass science, ceramic science, and optical physics expertise underpins its ability to introduce performance-leading materials ahead of competitors.
Founded in 1907 and headquartered in Tokyo, AGC Inc. is one of the world’s largest glass manufacturers, competing in cover glass through its Dragontrail chemically strengthened product line for smartphones, tablets, and wearables.
Founded in 1884 and headquartered in Mainz, Germany, Schott AG is a specialty glass manufacturer with ultrathin glass capabilities for foldable displays, pharmaceutical glass, and high-performance automotive glass. Schott’s Xensation range targets premium smartphone and wearable applications. Meanwhile, its ultrathin glass products serve the foldable smartphone display segment.
Founded in 1996 and headquartered in Hong Kong, Biel Crystal Manufactory Limited is one of the world’s largest assembled cover glass component manufacturers, serving major Chinese and international smartphone brands with precision-cut glass panels at tens of millions of units monthly.
Other leading companies in the market are TPK Holding Co., Ltd., Nippon Electric Glass Co., Ltd., O-film Tech Co., Ltd., and Others.
*Please note that this is only a partial list; the complete list of key players is available in the full report. Additionally, the list of key players can be customized to better suit your needs.*
Unlock comprehensive intelligence on the global cover glass industry from 2026 with our detailed market research report. Explore material innovation trends, application diversification, competitive strategies, and regional growth opportunities. Download your free sample today and discover key opportunities through 2035.
Upto 15% Off
USD
$2499 $2249
$3999 $3599
$4999 $4249
$5999 $5099


*While we strive to always give you current and accurate information, the numbers depicted on the website are indicative and may differ from the actual numbers in the main report. At Expert Market Research, we aim to bring you the latest insights and trends in the market. Using our analyses and forecasts, stakeholders can understand the market dynamics, navigate challenges, and capitalize on opportunities to make data-driven strategic decisions.*
The major drivers of the market include rising disposable incomes, increasing population, rising smartphone market, and the growing demand for smartwatches.
The thriving sales of smartphones is a key trend bolstering the growth of the market.
North America, Europe, the Asia Pacific, Latin America, and the Middle East and Africa are the leading regions in the market.
Gorilla is the dominant type of the product in the market.
The leading application segments in the market are smartphones, tablet, smart watch, and automotive, among others.
The leading players in the market are Corning Inc., AGC Inc., Schott AG, Biel Crystal Manufactory Limited, TPK Holding Co., Ltd., Nippon Electric Glass Co., Ltd., O-film Tech Co., Ltd., Others.
In 2025, the cover glass market reached an approximate value of USD 46.58 Billion.
The market is assessed to grow at a CAGR of 3.50% between 2026 and 2035.
The market is estimated to witness healthy growth in the forecast period of 2026-2035 to reach a value of around USD 65.71 Billion by 2035.
Explore our key highlights of the report and gain a concise overview of key findings, trends, and actionable insights that will empower your strategic decisions.
| REPORT FEATURES | DETAILS |
| Base Year | 2025 |
| Historical Period | 2019-2025 |
| Forecast Period | 2026-2035 |
| Scope of the Report |
Historical and Forecast Trends, Industry Drivers and Constraints, Historical and Forecast Market Analysis by Segment:
|
| Breakup by Type |
|
| Breakup by Application |
|
| Breakup by Region |
|
| Market Dynamics |
|
| Competitive Landscape |
|
| Companies Covered |
|
| Report Price and Purchase Option | Explore our purchase options that are best suited to your resources and industry needs. |
| Delivery Format | Delivered as an attached PDF and Excel through email, with an option of receiving an editable PPT, according to the purchase option. |
Datasheet
One User
USD 2,499
USD 2,249
tax inclusive*
Single User License
One User
USD 3,999
USD 3,599
tax inclusive*
Five User License
Five User
USD 4,999
USD 4,249
tax inclusive*
Corporate License
Unlimited Users
USD 5,999
USD 5,099
tax inclusive*
*Please note that the prices mentioned below are starting prices for each bundle type. Kindly contact our team for further details.*
Flash Bundle
Small Business Bundle
Growth Bundle
Enterprise Bundle
*Please note that the prices mentioned below are starting prices for each bundle type. Kindly contact our team for further details.*
Flash Bundle
Number of Reports: 3
20%
tax inclusive*
Small Business Bundle
Number of Reports: 5
25%
tax inclusive*
Growth Bundle
Number of Reports: 8
30%
tax inclusive*
Enterprise Bundle
Number of Reports: 10
35%
tax inclusive*
How To Order

Select License Type
Choose the right license for your needs and access rights.

Click on ‘Buy Now’
Add the report to your cart with one click and proceed to register.

Select Mode of Payment
Choose a payment option for a secure checkout. You will be redirected accordingly.
Strategic Solutions for Informed Decision-Making
Gain insights to stay ahead and seize opportunities.

Get insights & trends for a competitive edge.

Track prices with detailed trend reports.

Analyse trade data for supply chain insights.

Leverage cost reports for smart savings

Enhance supply chain with partnerships.

Connect For More Information
Our expert team of analysts will offer full support and resolve any queries regarding the report, before and after the purchase.
Our expert team of analysts will offer full support and resolve any queries regarding the report, before and after the purchase.
We employ meticulous research methods, blending advanced analytics and expert insights to deliver accurate, actionable industry intelligence, staying ahead of competitors.
Our skilled analysts offer unparalleled competitive advantage with detailed insights on current and emerging markets, ensuring your strategic edge.
We offer an in-depth yet simplified presentation of industry insights and analysis to meet your specific requirements effectively.


