

Consumer Insights
Uncover trends and behaviors shaping consumer choices today
Procurement Insights
Optimize your sourcing strategy with key market data
Industry Stats
Stay ahead with the latest trends and market analysis.
The global direct thermal ticket paper market was valued at USD 511.21 Million in 2025. The market is expected to grow at a CAGR of 7.00% during the forecast period of 2026-2035 to reach a value of USD 1005.63 Million by 2035. The expansion of automated ticketing infrastructure across public transportation networks is a major driving factor supporting the growth of the market.
The rapidly increasing investments in automated ticket printing technologies in various sectors such as transportation, parking facilities, and entertainment industry settings are driving demand in the direct thermal ticket paper market. Direct thermal technology becomes highly advantageous due to fast ticket printing processes and reduced printer maintenance requirements for organizations dealing with high transaction rates. Moreover, rising interest in phenol-free and eco-friendly thermal ink formulations is stimulating research into more sustainable substrate chemicals and paper options that can be recycled. Such advancements are promoting the widespread use of thermal printing supplies within public transport systems and event management systems.
In addition to that, transit companies and railways are making use of self-service ticket vending machines, portable ticket vending machines, and electronic fare collection equipment, which is expanding the direct thermal ticket paper market scope. These systems make significant use of direct thermal printing technology, owing to its advantages such as quick processing, ease of use, and low costs. This is because direct thermal print does not require any consumables like ink and ribbons in order to print tickets.
Besides, regulatory focus on safer and more durable chemical composition is driving the trend towards usage of phenol-free thermal ticket papers, which have better stability characteristics. As a result of all this, procurement of quality direct thermal paper is increasing in transportation systems. For instance, in March 2026, Indian Railways floated a multi-zone tender for the large-scale procurement of phenol-free thermal ticket rolls for suburban and parcel ticketing applications, supporting the deployment of additional ticket vending machines.
Compound Annual Growth Rate
7%
Value in USD Million
2026-2035
Read more about this report - REQUEST FREE SAMPLE COPY IN PDF
Koehler Paper improved its manufacturing facility in Kehl, Germany, to increase the production capacity of its BPA- and BPS-free thermal paper products. The initiative met regulatory requirements for ticket and label uses and augmented supply potential boosting the direct thermal ticket paper market opportunities.
Western Railway confirmed its intention to install 273 automated ticketing machines with thermal printers in suburban railway stations in Mumbai, India. The initiative improved ticket printing efficiency and strengthened consistent demand in the direct thermal ticket paper market.
Jujo Thermal reported receiving SKIDATA's certification for its JujoT KTN 182 thermal paper for parking and access ticketing. This development encouraged widespread usage of quality ticket-grade thermal paper and helped develop ticketing infrastructure.
South Western Railway installed thermal printers at KSR Bengaluru Railway Station in India for efficient and secure ticket printing. The machine printed tamper-proof tickets with QR code verification and indicated increasing demand for thermal printers in transport systems.
Growing demand for energy-efficient and environmentally friendly printing technologies is motivating paper manufacturers to design modern thermal papers which operate with improved efficiency. Linerless thermal papers do not have backing liners. This helps to reduce material waste, enhance roll loading capabilities, and facilitate extended printing cycles. This technology is expected to gain traction in large-scale operations such as tickets and transactions, where efficiency is of considerable importance, thereby boosting the direct thermal ticket paper market growth. Consistent with this development trend, in April 2024, Lecta launched its Termax TCLLX series of linerless thermal papers.
Increased demands on printing substrates that exhibit durability and good performance are leading to the creation of advanced thermal papers with superior stiffness, toughness, and image retention capabilities. This trend ensures the successful operation of printers in transit networks, retail outlets, and ticketing systems. Increased substrate toughness ensures efficient processing of prints in high-speed printing machines commonly used in transactional industries. In response to this trend in the direct thermal ticket paper market, Lecta introduced its Termax line of high-substance thermal papers in September 2024.
The evolving direct thermal ticket paper market trends driven by strict environment regulations and safety standards are paving the way for adoption of phenol free thermal papers without any traces of BPA and BPS substances. Companies are opting for safe coating technologies which provide clear prints along with minimizing environmental impact. These trends are promoting technological advancement within various industrial applications such as tickets and receipts printing systems. The adoption of phenol free technology was also evidenced by the introduction of phenol free thermal paper in the United States by Beontag in April 2025.
The increasing use of automated printing equipment in developing countries is leading to increased purchases of thermal paper in global markets. The growth of the retail, transport, and logistics industries is leading to increased collaboration among suppliers and organizations that are buying thermal paper from thermal paper manufacturers. Large-scale orders show the growing use of thermal printing media in developing countries, thereby accelerating the direct thermal ticket paper market expansion. For example, in June 2025, Casperg Paper Industrial Co., Ltd. got a new order for thermal papers from customers in Uganda.
Regulations regarding trade policies are becoming increasingly influential in the competitive environment of the thermal paper industry. Governments are now scrutinizing their import practices and subsidies to maintain healthy competition within the market, affecting procurement and regional production decisions. These factors might even affect prices and availability in printing media markets across the globe. In November 2025, the European Commission initiated a case for the investigation of subsidies on Chinese imports of lightweight thermal paper.
The Expert Market Research's report titled “Global Direct Thermal Ticket Paper Market Report and Forecast 2026-2035” offers a detailed analysis of the market based on the following segments:
The market can be broadly categorised on the basis of thickness into:
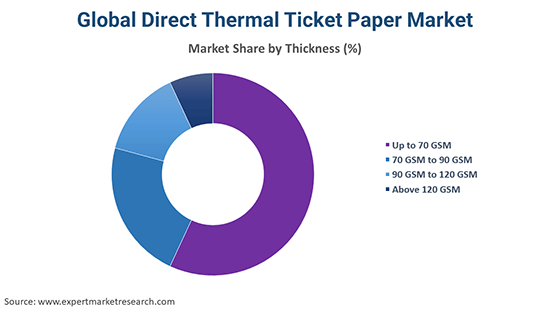
Key Insight: The direct thermal ticket paper market scope comprises thermal ticket papers of various thicknesses including up to 70 GSM, 70 GSM to 90 GSM, 90 GSM to 120 GSM, and over 120 GSM, catering to diverse applications and needs. Papers up to 70 GSM are frequently employed in mass transit tickets owing to their affordability. Papers from 70 GSM to 90 GSM and from 90 GSM to 120 GSM are better suited for event and lottery tickets because of enhanced durability and resistance to distortion during printing processes. Over 120 GSM papers offer increased durability and are utilized in premium tickets. Suppliers like Lecta are constantly improving their coatings to aid performance in all thicknesses.
The market can be divided based on its application segments as:
Key Insight: As per the direct thermal ticket paper market report, key application areas include tickets for travel, including tickets for road transportation, air transport, and seaways transport. Tickets for admissions and events, include sports events, concerts, cultural programs, artistic performances, amusement parks, movies, and other related activities. Examples of lottery tickets include bill tickets, tote/gaming tickets, valet parking tickets, barcode tickets, baggage counter tickets, customized tickets, and various other lottery tickets. Increasing investments in automated fare collection solutions and event ticketing systems are driving the demand for different products available in the global industry.
The market can be broadly categorised on the basis of region into:
Key Insight: The direct thermal ticket paper market landscape covers North America, Europe, Asia Pacific, Latin America, and the Middle East and Africa. North America and Europe boast a highly developed public transportation system coupled with an increased use of automated ticketing solutions. There is substantial growth in the Asia Pacific owing to the expansion in rail and metro transportations in the region. The market further observes steady improvements across Latin America and the Middle East and Africa in the adoption of digital ticketing systems and the development of transit infrastructure. Moreover, companies such as Koehler Paper are investing in thermal paper for sustainability purposes.
Read more about this report - REQUEST FREE SAMPLE COPY IN PDF
By thickness, the up to 70 GSM category witnesses high demand driven by high-volume transit ticketing
The growing need for economical and large-scale ticket printing is creating a demand for thermal papers between 50 GSM and 70 GSM. These are extensively utilized in transportation systems and parking solutions requiring speedy and massive ticket printing. Their reduced material usage helps companies lower operational costs without compromising printing performance. Companies operating in the direct thermal ticket paper industry are concentrating on manufacturing high-sensitivity coating thermal papers that facilitate clear printing using less energy. For instance, Hansol Paper provides lightweight thermal paper grades suited for POS receipts and transport tickets that allow fast printing processes.
On the other hand, the growing need for durable and long-lasting tickets is promoting the use of thermal papers between 90 GSM and 120 GSM. These moderate weight thermal papers provide increased tear resistance and superior print stability. They are applicable in event tickets, movie tickets, and amusement park tickets. The firms dealing in the direct thermal ticket paper market are striving to enhance the coatings that will ensure the barcodes are readable for a longer period. For instance, Mitsubishi Paper Mills Limited provides thermal papers that offer high durability and excellent printing performance.
By application, the transportation category boosts product demand attributed to the continuous transportation infrastructure expansion
Growth within the transportation vertical can be attributed to the rising number of public transportation systems being developed and the adoption of automatic ticketing machines. The direct thermal ticket paper market is expected to experience robust growth by the rising demand for ticket papers in railways, metros, and buses using automated fare machines. This process enables speedy and efficient handling of passengers while facilitating transactions. Companies are focusing on designing high-quality substrates that are suitable for use in the transportation sector. For instance, Koehler Paper manufactures Blue4est and other thermal papers that are tailored to meet ticketing needs.
Conversely, the entertainment and events segment are expected to grow rapidly owing to the increased adoption of automated ticketing systems in cinemas, concerts, amusement parks, and museums. Companies in the direct thermal ticket paper market are experiencing growth owing to the rising need to issue tickets promptly while printing barcodes or QR codes. Coated smooth layers ensure that tickets are readable and scannable at events. Additionally, users appreciate the efficiency associated with using thermal printers since they are easy to maintain.


Read more about this report - REQUEST FREE SAMPLE COPY IN PDF
By region, North America dominates the market growth driven by the development of advanced POS and kiosk infrastructure
North America accounts for a significant share of the direct thermal ticket paper market revenue owing to the presence of automated payment systems and self-service kiosks in several sectors, such as transportation, retail, and entertainment. The use of POS equipment in this area creates the need for quality and speedy thermal printing material, which is boosting the market growth. Enterprises are becoming more concerned about the environmental impact of their activities and prefer to invest in sustainable and environment-friendly thermal paper, complying with regulations related to chemical coating. Ongoing advancements in printing substrates are contributing to market growth. In this context, Domtar Corporation manufactures thermal paper used for POS receipts and ticketing applications.
In contrast, Asia Pacific is observing robust growth because of urbanization and the establishment of various transport systems, including metro rail, bus rapid transit, and smart city transport services. The Asia Pacific direct thermal ticket paper market witnesses considerable growth potential due to the installation of automatic ticketing systems in urban areas across the region. Higher footfall in these areas necessitates efficient ticket printing machines. There is a growing demand for specialist papers in Asia Pacific, which the regional producers are fulfilling through product manufacturing. For instance, Hansol Paper supplies thermal paper products for ticketing, POS, and labeling applications.
Major direct thermal ticket paper market players are increasingly allocating capital in the form of coating technology development and sourcing sustainable materials to manufacture their thermal papers in a way that improves the performance and environmental friendliness of the products. The development of formulations that do not involve phenol, the improvement of image durability, as well as the resistance to heat, light, and wear, are their areas of focus. Many players are also looking at production process optimization and paper mill upgrades in order to maximize the production of environmentally friendly thermal papers.
Strategic moves by players in the market include developing stronger logistical operations as well as forging partnerships with printer system companies, ticket solution integrators, and public transport organizations. This allows direct thermal ticket paper companies to integrate their products with automated vending systems, access control solutions, and parking management solutions.
Appvion Operations, Inc. is an enterprise incorporated in 1907 and located in Appleton, Wisconsin, United States, that engages in the production of specialist coating technologies and engineered paper products. Appvion Operations, Inc. provides advanced thermal, carbonless and security papers employed in transaction printing, labeling, and ticketing solutions.
Telemark Diversified Graphics is a company that was founded in 1975 and that is based in Mankato, Minnesota, United States. This enterprise engages in the provision of personalized printing and secure ticketing solutions. Telemark Diversified Graphics offers solutions such as thermal ticketing, event tickets, and specialty print solutions for the entertainment, transportation, and venue management industries.
Nippon Paper Industries Co., Ltd. is an incorporated organization founded in 1949. The organization is headquartered in Tokyo, Japan, and is involved in the manufacture of paper, pulp, and functional materials. Nippon Paper Industries Co., Ltd. concentrates on producing thermal papers for use in receipt, label, and ticket applications.
Ricoh Company, Ltd. is a multinational corporation that was founded in 1936. The headquarters of the corporation are located in Tokyo, Japan, and the organization specializes in the provision of imaging and printing solutions as well as digital workplace solutions for transaction printing and ticketing applications.
Other key players in the market include Oji Holdings Corporation, and Papierfabrik August Koehler SE, among others.
*Please note that this is only a partial list; the complete list of key players is available in the full report. Additionally, the list of key players can be customized to better suit your needs.*
Explore the latest trends shaping the global direct thermal ticket paper market 2026-2035 with our in-depth report. Gain strategic insights, future forecasts, and key market developments that can help you stay competitive. Download a free sample report or contact our team for customized consultation on global direct thermal ticket paper market trends 2026.
Upto 15% Off
USD
$2499 $2249
$3999 $3599
$4999 $4249
$5999 $5099


*While we strive to always give you current and accurate information, the numbers depicted on the website are indicative and may differ from the actual numbers in the main report. At Expert Market Research, we aim to bring you the latest insights and trends in the market. Using our analyses and forecasts, stakeholders can understand the market dynamics, navigate challenges, and capitalize on opportunities to make data-driven strategic decisions.*
The global direct thermal ticket paper market reached a value of USD 511.21 Million in 2025.
The market is projected to grow at a CAGR of nearly 7.00% in the forecast period of 2026-2035.
The major drivers of the industry include rising disposable incomes, increasing population, rising transportation industry, and the booming entertainment industry.
The steady rise in the gambling sector is expected to be a key trend guiding the growth of the industry.
North America, Europe, the Asia Pacific, Latin America, and the Middle East and Africa are the leading regions in the market.
The leading levels of thickness of the product in the market are up to 70 GSM, 70 GSM to 90 GSM, 90 GSM to 120 GSM, and above 120 GSM.
The major applications of the product in the industry are transport tickets, admission or events tickets, and lottery tickets.
The leading players in the market are Appvion Operations, Inc., Telemark Diversified Graphics, Nippon Paper Industries Co., Ltd., Ricoh Company, Ltd., Oji Holdings Corporation, and Papierfabrik August Koehler SE, among others.
Explore our key highlights of the report and gain a concise overview of key findings, trends, and actionable insights that will empower your strategic decisions.
| REPORT FEATURES | DETAILS |
| Base Year | 2025 |
| Historical Period | 2019-2025 |
| Forecast Period | 2026-2035 |
| Scope of the Report |
Historical and Forecast Trends, Industry Drivers and Constraints, Historical and Forecast Market Analysis by Segment:
|
| Breakup by Thickness |
|
| Breakup by Application |
|
| Breakup by Region |
|
| Market Dynamics |
|
| Competitive Landscape |
|
| Companies Covered |
|
| Report Price and Purchase Option | Explore our purchase options that are best suited to your resources and industry needs. |
| Delivery Format | Delivered as an attached PDF and Excel through email, with an option of receiving an editable PPT, according to the purchase option. |
Datasheet
One User
USD 2,499
USD 2,249
tax inclusive*
Single User License
One User
USD 3,999
USD 3,599
tax inclusive*
Five User License
Five User
USD 4,999
USD 4,249
tax inclusive*
Corporate License
Unlimited Users
USD 5,999
USD 5,099
tax inclusive*
*Please note that the prices mentioned below are starting prices for each bundle type. Kindly contact our team for further details.*
Flash Bundle
Small Business Bundle
Growth Bundle
Enterprise Bundle
*Please note that the prices mentioned below are starting prices for each bundle type. Kindly contact our team for further details.*
Flash Bundle
Number of Reports: 3
20%
tax inclusive*
Small Business Bundle
Number of Reports: 5
25%
tax inclusive*
Growth Bundle
Number of Reports: 8
30%
tax inclusive*
Enterprise Bundle
Number of Reports: 10
35%
tax inclusive*
How To Order

Select License Type
Choose the right license for your needs and access rights.

Click on ‘Buy Now’
Add the report to your cart with one click and proceed to register.

Select Mode of Payment
Choose a payment option for a secure checkout. You will be redirected accordingly.
Strategic Solutions for Informed Decision-Making
Gain insights to stay ahead and seize opportunities.

Get insights & trends for a competitive edge.

Track prices with detailed trend reports.

Analyse trade data for supply chain insights.

Leverage cost reports for smart savings

Enhance supply chain with partnerships.

Connect For More Information
Our expert team of analysts will offer full support and resolve any queries regarding the report, before and after the purchase.
Our expert team of analysts will offer full support and resolve any queries regarding the report, before and after the purchase.
We employ meticulous research methods, blending advanced analytics and expert insights to deliver accurate, actionable industry intelligence, staying ahead of competitors.
Our skilled analysts offer unparalleled competitive advantage with detailed insights on current and emerging markets, ensuring your strategic edge.
We offer an in-depth yet simplified presentation of industry insights and analysis to meet your specific requirements effectively.


