

Consumer Insights
Uncover trends and behaviors shaping consumer choices today
Procurement Insights
Optimize your sourcing strategy with key market data
Industry Stats
Stay ahead with the latest trends and market analysis.
The global drilling waste management market value reached USD 6.56 Billion in 2025. The market is further estimated to grow in the forecast period of 2026-2035 at a CAGR of 6.30% to reach about USD 12.08 Billion by 2035.
Compound Annual Growth Rate
6.3%
Value in USD Billion
2026-2035
| Global Drilling Waste Management Market Report Summary | Description | Value |
| Base Year | USD Billion | 2025 |
| Historical Period | USD Billion | 2019-2025 |
| Forecast Period | USD Billion | 2026-2035 |
| Market Size 2025 | USD Billion | 6.56 |
| Market Size 2035 | USD Billion | 12.08 |
| CAGR 2019-2025 | Percentage | XX% |
| CAGR 2026-2035 | Percentage | 6.30% |
| CAGR 2026-2035 - Market by Region | Asia Pacific | 7.2% |
| CAGR 2026-2035 - Market by Country | India | 8.1% |
| CAGR 2026-2035 - Market by Country | China | 7.3% |
| CAGR 2026-2035 - Market by Application | Onshore | 7.1% |
| CAGR 2026-2035 - Market by Service | Solid Control | 6.4% |
| Market Share by Country 2025 | France | 3.9% |
Drilling waste management involves the careful collection, treatment, and disposal of drilling waste. This waste includes all chemicals and materials, both liquid and solid, related to the drilling process, such as drill cuttings, which drives the drilling waste management market demand.
The drilling waste management market dynamics and trends are being driven by its benefits, including environmental protection, regulatory compliance, cost efficiency, enhanced safety, and resource recovery. It helps mitigate contamination risks, ensures regulatory adherence, cuts disposal costs, boosts safety, and recycles valuable materials, promoting sustainability.
Read more about this report - REQUEST FREE SAMPLE COPY IN PDF
Going further, strict government regulations and a strong judiciary have efficiently enforced waste management laws in the region like the Resource Conservation and Recovery Act (RCRA). These regulations are anticipated to bolster the market growth in North America during the forecast period. The development of innovative technologies in industries is further expected to drive the growth of the drilling waste management industry in this region.
According to the BP Energy Outlook, Iran's oil production rose from 3,084 thousand barrels per day in 2020 to 3,620 thousand barrels per day in 2021, reflecting a notable increase of 17.4%. Kuwait's production went up from 2,695 thousand barrels per day in 2020 to 2,741 thousand barrels per day in 2021, a modest gain of 1.7%. Oman saw a small rise in its oil output, increasing from 951 thousand barrels per day in 2020 to 971 thousand barrels per day in 2021, which represents a 2.2% growth. Qatar's production grew from 1,714 thousand barrels per day in 2020 to 1,746 thousand barrels per day in 2021, marking a 1.9% increase. Syria experienced a substantial rise in production, from 43 thousand barrels per day in 2020 to 96 thousand barrels per day in 2021, reflecting an impressive growth of 123.2%. In 2020, other Middle Eastern countries produced 188 thousand barrels per day, with a slight increase to 191 thousand barrels per day in 2021, marking a 1.1% rise. This growth is contributing to the drilling waste management industry revenue as innovations in waste treatment technologies such as separation, recycling, and safe disposal methods are essential for managing the significant volumes of waste from drilling activities, enhancing the efficiency and sustainability of oil and gas operations.
According to the BP Energy Outlook, Algeria's oil production rose from 57.5 million tonnes in 2020 to 58.2 million tonnes in 2021, marking a 1.4% increase. Libya saw a substantial rise in production, increasing from 20.0 million tonnes in 2020 to 59.6 million tonnes in 2021, representing an impressive growth of 198.9%. Sudan's oil output grew slightly from 3.1 million tonnes in 2020 to 3.2 million tonnes in 2021. Tunisia’s oil production held steady at approximately 1.7 million tonnes in both years. Overall, Africa's total oil production increased from 330.7 million tonnes in 2020 to 344.7 million tonnes in 2021, marking a 4.5% growth. This rise is contributing to the drilling waste management market revenue, which deals with the substantial volumes of waste generated, including drilling fluids, cuttings, and other by-products.
Halliburton Company
Weatherford International plc
NOV Inc.
Read more about this report - REQUEST FREE SAMPLE COPY IN PDF
“Global Drilling Waste Management Market Report and Forecast 2026-2035” offers a detailed analysis of the market based on the following segments:
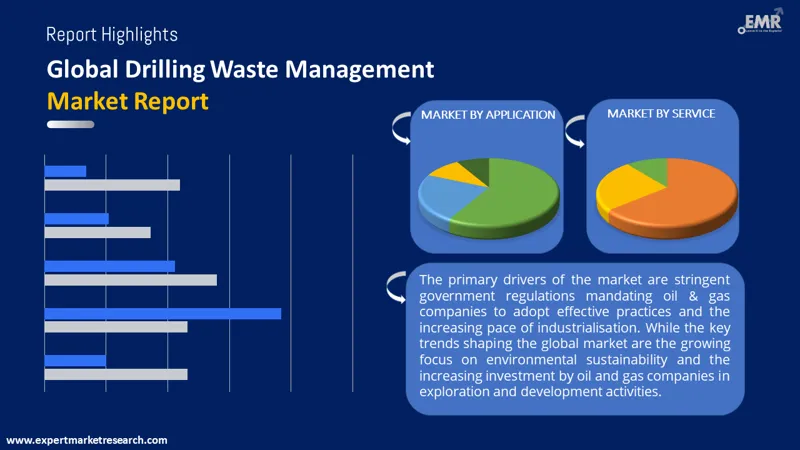
Market Breakup by Application
Market Breakup by Service
Market Breakup by Region
| CAGR 2026-2035 - Market by | Country |
| India | 8.1% |
| China | 7.3% |
| Canada | 6.0% |
| Germany | 5.2% |
| Italy | 4.4% |
| USA | XX% |
| UK | XX% |
| France | XX% |
| Japan | 4.3% |
| Australia | XX% |
| Saudi Arabia | XX% |
| Brazil | XX% |
| Mexico | XX% |
The treatment and disposal segment are projected to see substantial growth globally over the forecast period. Various techniques are used to manage waste and reduce its environmental impact. With the rise in onshore drilling activities, demand for the drilling waste management market in this segment is expected to grow.
Additionally, oil and gas companies are boosting their investment in developmental projects worldwide, coupled with increasing environmental concerns, which are anticipated to drive growth in the global drilling waste management industry in the forecast period.


The company’s focus is on delivering innovative solutions for the energy sector. They offer a comprehensive range of services, encompassing drilling, evaluation, completion, production, and intervention.
Upto 15% Off
USD
$2499 $2249
$3999 $3599
$4999 $4249
$5999 $5099


*While we strive to always give you current and accurate information, the numbers depicted on the website are indicative and may differ from the actual numbers in the main report. At Expert Market Research, we aim to bring you the latest insights and trends in the market. Using our analyses and forecasts, stakeholders can understand the market dynamics, navigate challenges, and capitalize on opportunities to make data-driven strategic decisions.*
In 2025, the global market attained a value of nearly USD 6.56 Billion.
The market is projected to grow at a CAGR of nearly 6.30% in the forecast period of 2026-2035.
The market is estimated to witness healthy growth in the forecast period of 2026-2035 to reach almost USD 12.08 Billion by 2035.
The major market drivers are growing strict government regulations encouraging oil & gas companies in employing effective practices and growing industrialisation.
The key market trends include surging environmental concerns and increased expenditure from oil & gas companies in exploration and developmental activities.
The market is broken down into North America, Europe, Asia Pacific, Latin America, the Middle East, and Africa.
The market is divided into onshore and offshore.
Based on services, the market is divided into solid control, containment and handling, and treatment and disposal.
The competitive landscape consists of Halliburton Company, Weatherford International plc, NOV Inc., Scomi Group Bhd, and KOSUN Machinery Co., Ltd, among others.
Explore our key highlights of the report and gain a concise overview of key findings, trends, and actionable insights that will empower your strategic decisions.
| REPORT FEATURES | DETAILS |
| Base Year | 2025 |
| Historical Period | 2019-2025 |
| Forecast Period | 2026-2035 |
| Scope of the Report |
Historical and Forecast Trends, Industry Drivers and Constraints, Historical and Forecast Market Analysis by Segment:
|
| Breakup by Application |
|
| Breakup by Service |
|
| Breakup by Region |
|
| Market Dynamics |
|
| Competitive Landscape |
|
| Companies Covered |
|
Datasheet
One User
USD 2,499
USD 2,249
tax inclusive*
Single User License
One User
USD 3,999
USD 3,599
tax inclusive*
Five User License
Five User
USD 4,999
USD 4,249
tax inclusive*
Corporate License
Unlimited Users
USD 5,999
USD 5,099
tax inclusive*
*Please note that the prices mentioned below are starting prices for each bundle type. Kindly contact our team for further details.*
Flash Bundle
Small Business Bundle
Growth Bundle
Enterprise Bundle
*Please note that the prices mentioned below are starting prices for each bundle type. Kindly contact our team for further details.*
Flash Bundle
Number of Reports: 3
20%
tax inclusive*
Small Business Bundle
Number of Reports: 5
25%
tax inclusive*
Growth Bundle
Number of Reports: 8
30%
tax inclusive*
Enterprise Bundle
Number of Reports: 10
35%
tax inclusive*
How To Order

Select License Type
Choose the right license for your needs and access rights.

Click on ‘Buy Now’
Add the report to your cart with one click and proceed to register.

Select Mode of Payment
Choose a payment option for a secure checkout. You will be redirected accordingly.
Strategic Solutions for Informed Decision-Making
Gain insights to stay ahead and seize opportunities.

Get insights & trends for a competitive edge.

Track prices with detailed trend reports.

Analyse trade data for supply chain insights.

Leverage cost reports for smart savings

Enhance supply chain with partnerships.

Connect For More Information
Our expert team of analysts will offer full support and resolve any queries regarding the report, before and after the purchase.
Our expert team of analysts will offer full support and resolve any queries regarding the report, before and after the purchase.
We employ meticulous research methods, blending advanced analytics and expert insights to deliver accurate, actionable industry intelligence, staying ahead of competitors.
Our skilled analysts offer unparalleled competitive advantage with detailed insights on current and emerging markets, ensuring your strategic edge.
We offer an in-depth yet simplified presentation of industry insights and analysis to meet your specific requirements effectively.


