

Consumer Insights
Uncover trends and behaviors shaping consumer choices today
Procurement Insights
Optimize your sourcing strategy with key market data
Industry Stats
Stay ahead with the latest trends and market analysis.
The global edge computing market size was valued at USD 19.95 Billion in 2025. The industry is expected to grow at a CAGR of 28.40% during the forecast period of 2026-2035 to reach a value of USD 242.99 Billion by 2035. The market growth is mainly driven by the heightened global efforts for strengthening digital sovereignty and industrial competitiveness across key economies.
Edge computing adoption is driven by the growing need for ultra-reliable, low-latency processing in mission-critical environments where cloud dependency can disrupt operations. Additionally, the increasing convergence of AI, digital twins, and advanced connectivity enables localized decision-making, allowing industries to optimize performance, improve safety, and maintain operational continuity across complex and distributed systems.
Supportive government initiatives such as strategic funding, policy frameworks, and public-private partnerships are contributing to the development are contributing to the development and deployment of localized edge infrastructure across major industries, particularly manufacturing, defense, transportation, and energy. For instance, in November 2024, EdgeCortix, a Japanese edge AI company, received funds worth USD 49 million from the New Energy and Industrial Technology Development Organization (NEDO). The investment enabled the development of ultra-efficient AI accelerators specifically for hybrid edge-cloud systems, which are essential for real-time industrial analytics and automation.
In addition, energy efficiency and sustainability requirements have encouraged the use of edge computing solutions in various sectors. Edge architecture reduces energy usage by limiting data transmission over long distances and decreasing the burden on centralized cloud infrastructure. This technology is in line with global carbon-neutral and ESG targets that drive enterprises to redesign their digital operations based on sustainable models. For example, Schneider Electric teamed up with NVIDIA in July 2025 to create AI-driven data center reference architectures for server racks of up to 132 kW. Such racks were intended to lower cooling energy consumption by around 20% and cut down the time for the project development by roughly 30%.
Compound Annual Growth Rate
28.4%
Value in USD Billion
2026-2035
Advantech launched its latest AIR series of Edge AI systems powered by AMD’s advanced computer portfolio to support high-performance AI workloads. The collaboration improved scalability and processing efficiency for demanding applications. This launch supported faster AI deployment at the network edge, reinforcing industrial and enterprise demand for edge computing solutions.
HPE Aruba Networking introduced new retail-focused solutions to enhance in-store connectivity, IoT integration, and edge AI processing. The offerings enabled rapid deployment, backup connectivity, and private 5G support for real-time analytics. This development strengthened retailers’ operational resilience and accelerated edge computing adoption across physical retail environments.
Mistral AI introduced Ministral 3B and 8B models designed specifically for on-device and edge AI computing. Featuring efficient sliding-window attention and extended context support, the models improved local inference for translation, robotics, and smart assistants. The launch promoted privacy-first edge deployments, supporting broader market expansion.
G42 invested in Analog, a newly formed edge computing company focused on human-centric AI applications. The investment aimed to bridge AI innovation with real-world deployment through edge-based solutions. This strategic move strengthened the regional edge ecosystem and encouraged greater enterprise confidence in scalable edge computing adoption.
The widespread adoption of IoT ecosystems across industries demands secure, low-latency processing near data sources, resulting in growing adoption of edge computing, driving global edge computing market growth. Sectors such as smart cities and industrial automation require scalable platforms to handle complex AI workloads. These applications require advanced edge processors that boost machine learning performance while supporting flexible and compatible software frameworks. Reflecting this trend, in February 2025, Arm launched its Armv9 Edge AI platform, featuring the Cortex-A320 CPU and Ethos-U85 NPU, designed to enable on-device AI models with more than a billion parameters, accelerating innovation in the IoT space.
The increasing use of edge AI in artificial intelligence (AI) and machine learning (ML) is driving the global edge computing market. By processing data locally, edge AI reduces reliance on centralized cloud data centers, enabling faster decision-making, enhanced privacy, and reduced bandwidth usage. This is critical for real-time and sensitive data requirements in industries like manufacturing, healthcare, and autonomous systems. To address these technical needs, companies are focused on developing advanced solutions and favoring market growth. For instance, in May 2024, Dell and NVIDIA introduced the PowerEdge XE9680L edge server and the NativeEdge platform, tailored for smart factories and federated AI workloads.
The global shift toward cloud-edge hybrid architectures is amplifying the global edge computing market revenue, as organizations prefer the scalability of cloud computing and the quick responsiveness of edge infrastructure. Additionally, enterprises face challenges with managing rising data volumes and tighter security requirements. Cloud-edge enables them to improve performance, minimize cloud dependency, and scale intelligent operations, driving its adoption. For example, in August 2023, ABB invested in a no-code edge-to-cloud platform by Pratexo, which reduced latency and improved data privacy. The platform also operates in offline conditions, allowing real-time decision-making in sectors like energy, utilities, and smart infrastructure.
Rising demand for mission-critical connectivity and real-time decision-making in heavy industries is driving edge computing adoption, as sectors such as mining, oil and gas, and logistics require ultra-resilient networks and localized intelligence. Enterprises increasingly deploy edge-enabled platforms to support autonomous operations, reduce downtime, and enhance worker safety in harsh environments. For instance, in January 2026, Nokia collaborated with Telit Cinterion to integrate advanced connectivity modules with its Cognitive Digital Mine platform for AI-powered industrial edge operations.
The convergence of 5G, artificial intelligence, and IoT is a key driver accelerating edge computing adoption in the telecom sector, as operators require ultra-low latency, real-time data processing, and scalable network architectures. Telecom companies increasingly deploy edge platforms to support network virtualization, private 5G, and industry-specific services while reducing operational costs and improving service agility. This driver was evident in October 2024 when SUSE launched its Adaptive Telco Infrastructure Platform 3.1 to help telecom operators host 5G and edge workloads more efficiently.
Read more about this report - REQUEST FREE SAMPLE COPY IN PDF
The EMR’s report titled “Global Edge Computing Market Report and Forecast 2026-2035” offers a detailed analysis of the market based on the following segments:
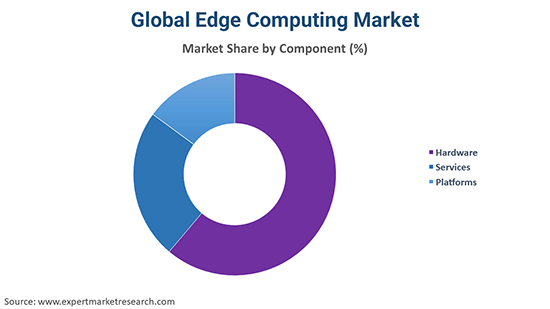
Market Breakup by Component
Key Insight: The global edge computing market scope comprises components such as hardware, services, and platforms. Each segment has its own role in driving overall market growth. The need for hardware mainly comes from edge servers and gateways that allow low-latency processing, whereas platforms are there to help with orchestration, analytics, and AI workloads at the edge. As enterprises look for deployment and lifecycle support, the services are growing in volume. To speed up the adoption of edge technology, big players like Amazon Web Services, Microsoft, and Hewlett-Packard Enterprise are combining the edge solutions of various components into a single ecosystem.
Market Breakup by End-Use
Key Insight: Market expansion within various industries such as manufacturing, government and defense, healthcare, transportation and logistics, retail and consumer goods, telecom and IT, among others, is mainly influenced by the increasing need for processing of real-time data, automation, and quick decision-making without any delay. Manufacturing contributes most to the adoption through Industry 4.0 and predictive maintenance, whereas healthcare uses edge AI for patient monitoring at a distance. Fleet tracking and customer insights are the main beneficiaries of localized analytics in transportation and retail. Telecom and IT provide the necessary speed for deployment through 5G-enabled edge infrastructure, and companies like Amazon Web Services, Microsoft, and Cisco Systems offer solutions for the scaling of enterprise implementations.
Market Breakup by Region
Key Insight: North America captures the highest share of the global edge computing market, owing to the widespread presence of robust digital infrastructure and regulatory support for data localization. Europe follows closely, attributed to the smart city initiatives and Industry 4.0 adoption. The Asia Pacific is witnessing rapid growth resulting from the expanding industrialization, rising smartphone penetration, and smart manufacturing across China, Japan, and India. Meanwhile, Latin America and the Middle East & Africa are emerging markets, gradually adopting edge solutions to improve connectivity and real-time services.
By component, hardware gains significant traction, driven by AI-ready infrastructure demand
The edge computing hardware is the largest segment in the global edge computing market revenue, due to the increasing demand for intelligent edge devices offering real-time data processing and low-latency performance. This has spurred continuous innovation in AI-optimized processors, embedded systems, and advanced modular chipsets. In January 2025, Portwell introduced edge hardware powered by Intel® Core™ Ultra Processors (Series 2), featuring hybrid architecture, integrated neural processing units, and support for PCIe Gen 5 and DDR5 memory. Such innovations support scalable, energy-efficient edge AI workloads across sectors like industrial automation, healthcare, and smart infrastructure, fueling wider adoption of edge hardware.
Meanwhile, the edge computing market is witnessing a surge in demand for services primarily driven by increasing needs for technical enablement, design support, and deployment guidance because edge architectures are becoming more complex. Enterprises are increasingly dependent on engineering resources and lifecycle support to implement low-latency edge systems. For example, in Feb 2026, Mouser Electronics unveiled an edge computing resource hub that featured selected technical content and eBooks to help engineers speed up the adoption of edge technologies, thus facilitating the development of a service-led ecosystem and overall market growth.
By end-user industry, the manufacturing end-use emerged as a main source of revenue, driven by Industry 4.0 adoption
The manufacturing segment is experiencing significant growth in the global edge computing market-driven by the need for real-time data processing to support fast, low-latency decisions on the factory floor. As smart factories adopt AI and IoT technologies, edge computing becomes essential for optimizing operations, reducing downtime, and enabling predictive maintenance. This accelerates the demand for scalable, secure-edge platforms that can manage complex industrial workloads. For example, in April 2025, IOTech introduced Edge Central 4.0, an open industrial edge platform with real-time alarm management and enhanced security, thereby accelerating the shift toward modular, efficient, and future-ready manufacturing architectures.
The healthcare sector is mainly influenced by the increasing need for real-time diagnostics, remote patient monitoring, and clinical decision support with very low latency. By using edge computing, the processing of images can be accelerated, AI inference can be done locally, and the dependence on cloud connectivity can be decreased, especially in critical care environments. For instance, GE Healthcare launched Edison HealthLink as a means of assisting clinicians in analyzing patient data closer to its origin, thus elevating the response times, keeping the devices in use for longer, and speeding up the edge adoption in hospitals and care networks.


By region, North America dominates the market, driven by enterprise digitization and 5G-enabled edge adoption
North America is becoming a hotspot in the global edge computing market due to its high enterprise digital maturity and early adoption of AI/ML applications. The advanced cloud ecosystem of the region, coupled with strong demand for real-time data processing in sectors like manufacturing, healthcare, and logistics, is prompting edge computing development. Businesses are leveraging edge infrastructure to reduce latency, ensure data sovereignty, and enable intelligent automation. For example, in December 2024, Verizon expanded its 5G Edge platform to deliver real-time analytics and AI capabilities at the network edge. These developments strengthen North America’s position in the market
Meanwhile, the Asia-Pacific region is picking up significant momentum in the global edge computing market, fueled by the widespread deployment of 5G networks across the region. The rapid advancement of 5G in countries like China, India, Japan, and South Korea is enabling high-speed, low-latency connectivity. This supports edge-based applications such as autonomous vehicles, smart grids, and industrial automation, propelling the deployment of edge computing solutions. For instance, in March 2024, India’s BSNL partnered with Tata Consultancy Services (TCS) to accelerate its nationwide 5G implementation, integrating edge capabilities.
Leading global edge computing market players are developing modular and scalable edge platforms that integrate computer storage and AI capabilities specific to industry-specific needs. These platforms are designed to support real-time analytics, reduce latency, and enhance data security across manufacturing, BFSI, retail, and healthcare sectors. Edge computing companies are also emphasizing open architectures and interoperability to ensure seamless deployment across hybrid environments, enabling organizations to optimize performance while meeting compliance standards and managing rising volumes of distributed data efficiently.
Besides this, prominent technology firms are making aggressive investments in localized edge infrastructure that complements cloud ecosystems while reducing dependency on centralized data centers to spur adoption. Strategic collaborations with telecom operators and 5G providers offer new growth opportunities in ultra-low latency networking and AI at the edge. Additionally, emerging firms in the global edge computing market are introducing subscription-based and pay-as-you-go models to attract small and medium enterprises, enabling access to advanced edge technologies without heavy upfront investments, thus democratizing digital transformation across enterprise scales globally.
Amazon Web Services, Inc. was established in 2006 and is headquartered in Seattle, Washington. The company offers a comprehensive portfolio of cloud and edge computing services that enable scalable data processing, analytics, and storage for enterprises worldwide.
Cisco Systems, Inc. was established in 1984 and is headquartered in San Jose, California. The company provides networking, security, and edge infrastructure solutions that support real-time data processing and secure connectivity across distributed enterprise environments.
Hewlett Packard Enterprise Development LP was established in 2015 and is headquartered in Houston, Texas. The company delivers edge-to-cloud platforms and enterprise IT solutions designed to support decentralized computing and data-intensive workloads.
Huawei Technologies Co., Ltd. was established in 1987 and is headquartered in Shenzhen, China. The company develops integrated ICT and edge computing solutions that enable intelligent connectivity and localized data processing across telecom and enterprise networks.
*Please note that this is only a partial list; the complete list of key players is available in the full report. Additionally, the list of key players can be customized to better suit your needs.*
Other players in the market include International Business Machines Corporation, Capgemini Service SAS, and Microsoft Corporation, among others.
Explore the latest trends shaping the global edge computing market 2035 with our in-depth report. Gain strategic insights, future forecasts, and key market developments that can help you stay competitive. Get a free sample report or contact our team for a customized consultation on global edge computing market trends 2026.
Upto 15% Off
USD
$2499 $2249
$3999 $3599
$4999 $4249
$5999 $5099


*While we strive to always give you current and accurate information, the numbers depicted on the website are indicative and may differ from the actual numbers in the main report. At Expert Market Research, we aim to bring you the latest insights and trends in the market. Using our analyses and forecasts, stakeholders can understand the market dynamics, navigate challenges, and capitalize on opportunities to make data-driven strategic decisions.*
In 2025, the global edge computing market reached an approximate value of USD 19.95 Billion.
The market is projected to grow at a CAGR of 28.40% between 2026 and 2035.
The market is estimated to witness a healthy growth in the forecast period of 2026-2035 to reach about USD 242.99 Billion by 2035.
Key strategies driving the market include strategic partnerships and collaborations, expansion of 5G infrastructure, development of AI-integrated edge platforms, vertical-specific solution offerings, modular product launches, and investments in localized data processing to ensure regulatory compliance and low-latency performance.
The key trends guiding the market growth include the advent of autonomous vehicles and connected car networks, and the rising need for lightweight frameworks and applications to improve the efficiency of edge computing solutions.
The major regions in the market are North America, Latin America, the Middle East and Africa, Europe, and the Asia Pacific.
Hardware, services, and platforms are the leading components of the product in the market.
Manufacturing, government and defence, healthcare, transportation and logistics, retail and consumer goods, and telecom and IT, among others, are the significant end uses of the product in the global edge computing market.
The key players in the market include Amazon Web Services, Inc., Cisco Systems, Inc., Hewlett Packard Enterprise Development LP, Huawei Technologies Co., Ltd., International Business Machines Corporation, Capgemini Service SAS, and Microsoft Corporation, among others.
North America holds the largest share in the global edge computing market, owing to its advanced digital infrastructure, strong presence of technology giants, rapid 5G expansion, and early enterprise adoption of edge technologies.
Explore our key highlights of the report and gain a concise overview of key findings, trends, and actionable insights that will empower your strategic decisions.
| REPORT FEATURES | DETAILS |
| Base Year | 2025 |
| Historical Period | 2019-2025 |
| Forecast Period | 2026-2035 |
| Scope of the Report |
Historical and Forecast Trends, Industry Drivers and Constraints, Historical and Forecast Market Analysis by Segment:
|
| Breakup by Component |
|
| Breakup by End Use |
|
| Breakup by Region |
|
| Market Dynamics |
|
| Competitive Landscape |
|
| Companies Covered |
|
| Report Price and Purchase Option | Explore our purchase options that are best suited to your resources and industry needs. |
| Delivery Format | Delivered as an attached PDF and Excel through email, with an option of receiving an editable PPT, according to the purchase option. |
Datasheet
One User
USD 2,499
USD 2,249
tax inclusive*
Single User License
One User
USD 3,999
USD 3,599
tax inclusive*
Five User License
Five User
USD 4,999
USD 4,249
tax inclusive*
Corporate License
Unlimited Users
USD 5,999
USD 5,099
tax inclusive*
*Please note that the prices mentioned below are starting prices for each bundle type. Kindly contact our team for further details.*
Flash Bundle
Small Business Bundle
Growth Bundle
Enterprise Bundle
*Please note that the prices mentioned below are starting prices for each bundle type. Kindly contact our team for further details.*
Flash Bundle
Number of Reports: 3
20%
tax inclusive*
Small Business Bundle
Number of Reports: 5
25%
tax inclusive*
Growth Bundle
Number of Reports: 8
30%
tax inclusive*
Enterprise Bundle
Number of Reports: 10
35%
tax inclusive*
How To Order

Select License Type
Choose the right license for your needs and access rights.

Click on ‘Buy Now’
Add the report to your cart with one click and proceed to register.

Select Mode of Payment
Choose a payment option for a secure checkout. You will be redirected accordingly.
Strategic Solutions for Informed Decision-Making
Gain insights to stay ahead and seize opportunities.

Get insights & trends for a competitive edge.

Track prices with detailed trend reports.

Analyse trade data for supply chain insights.

Leverage cost reports for smart savings

Enhance supply chain with partnerships.

Connect For More Information
Our expert team of analysts will offer full support and resolve any queries regarding the report, before and after the purchase.
Our expert team of analysts will offer full support and resolve any queries regarding the report, before and after the purchase.
We employ meticulous research methods, blending advanced analytics and expert insights to deliver accurate, actionable industry intelligence, staying ahead of competitors.
Our skilled analysts offer unparalleled competitive advantage with detailed insights on current and emerging markets, ensuring your strategic edge.
We offer an in-depth yet simplified presentation of industry insights and analysis to meet your specific requirements effectively.


