

Consumer Insights
Uncover trends and behaviors shaping consumer choices today
Procurement Insights
Optimize your sourcing strategy with key market data
Industry Stats
Stay ahead with the latest trends and market analysis.
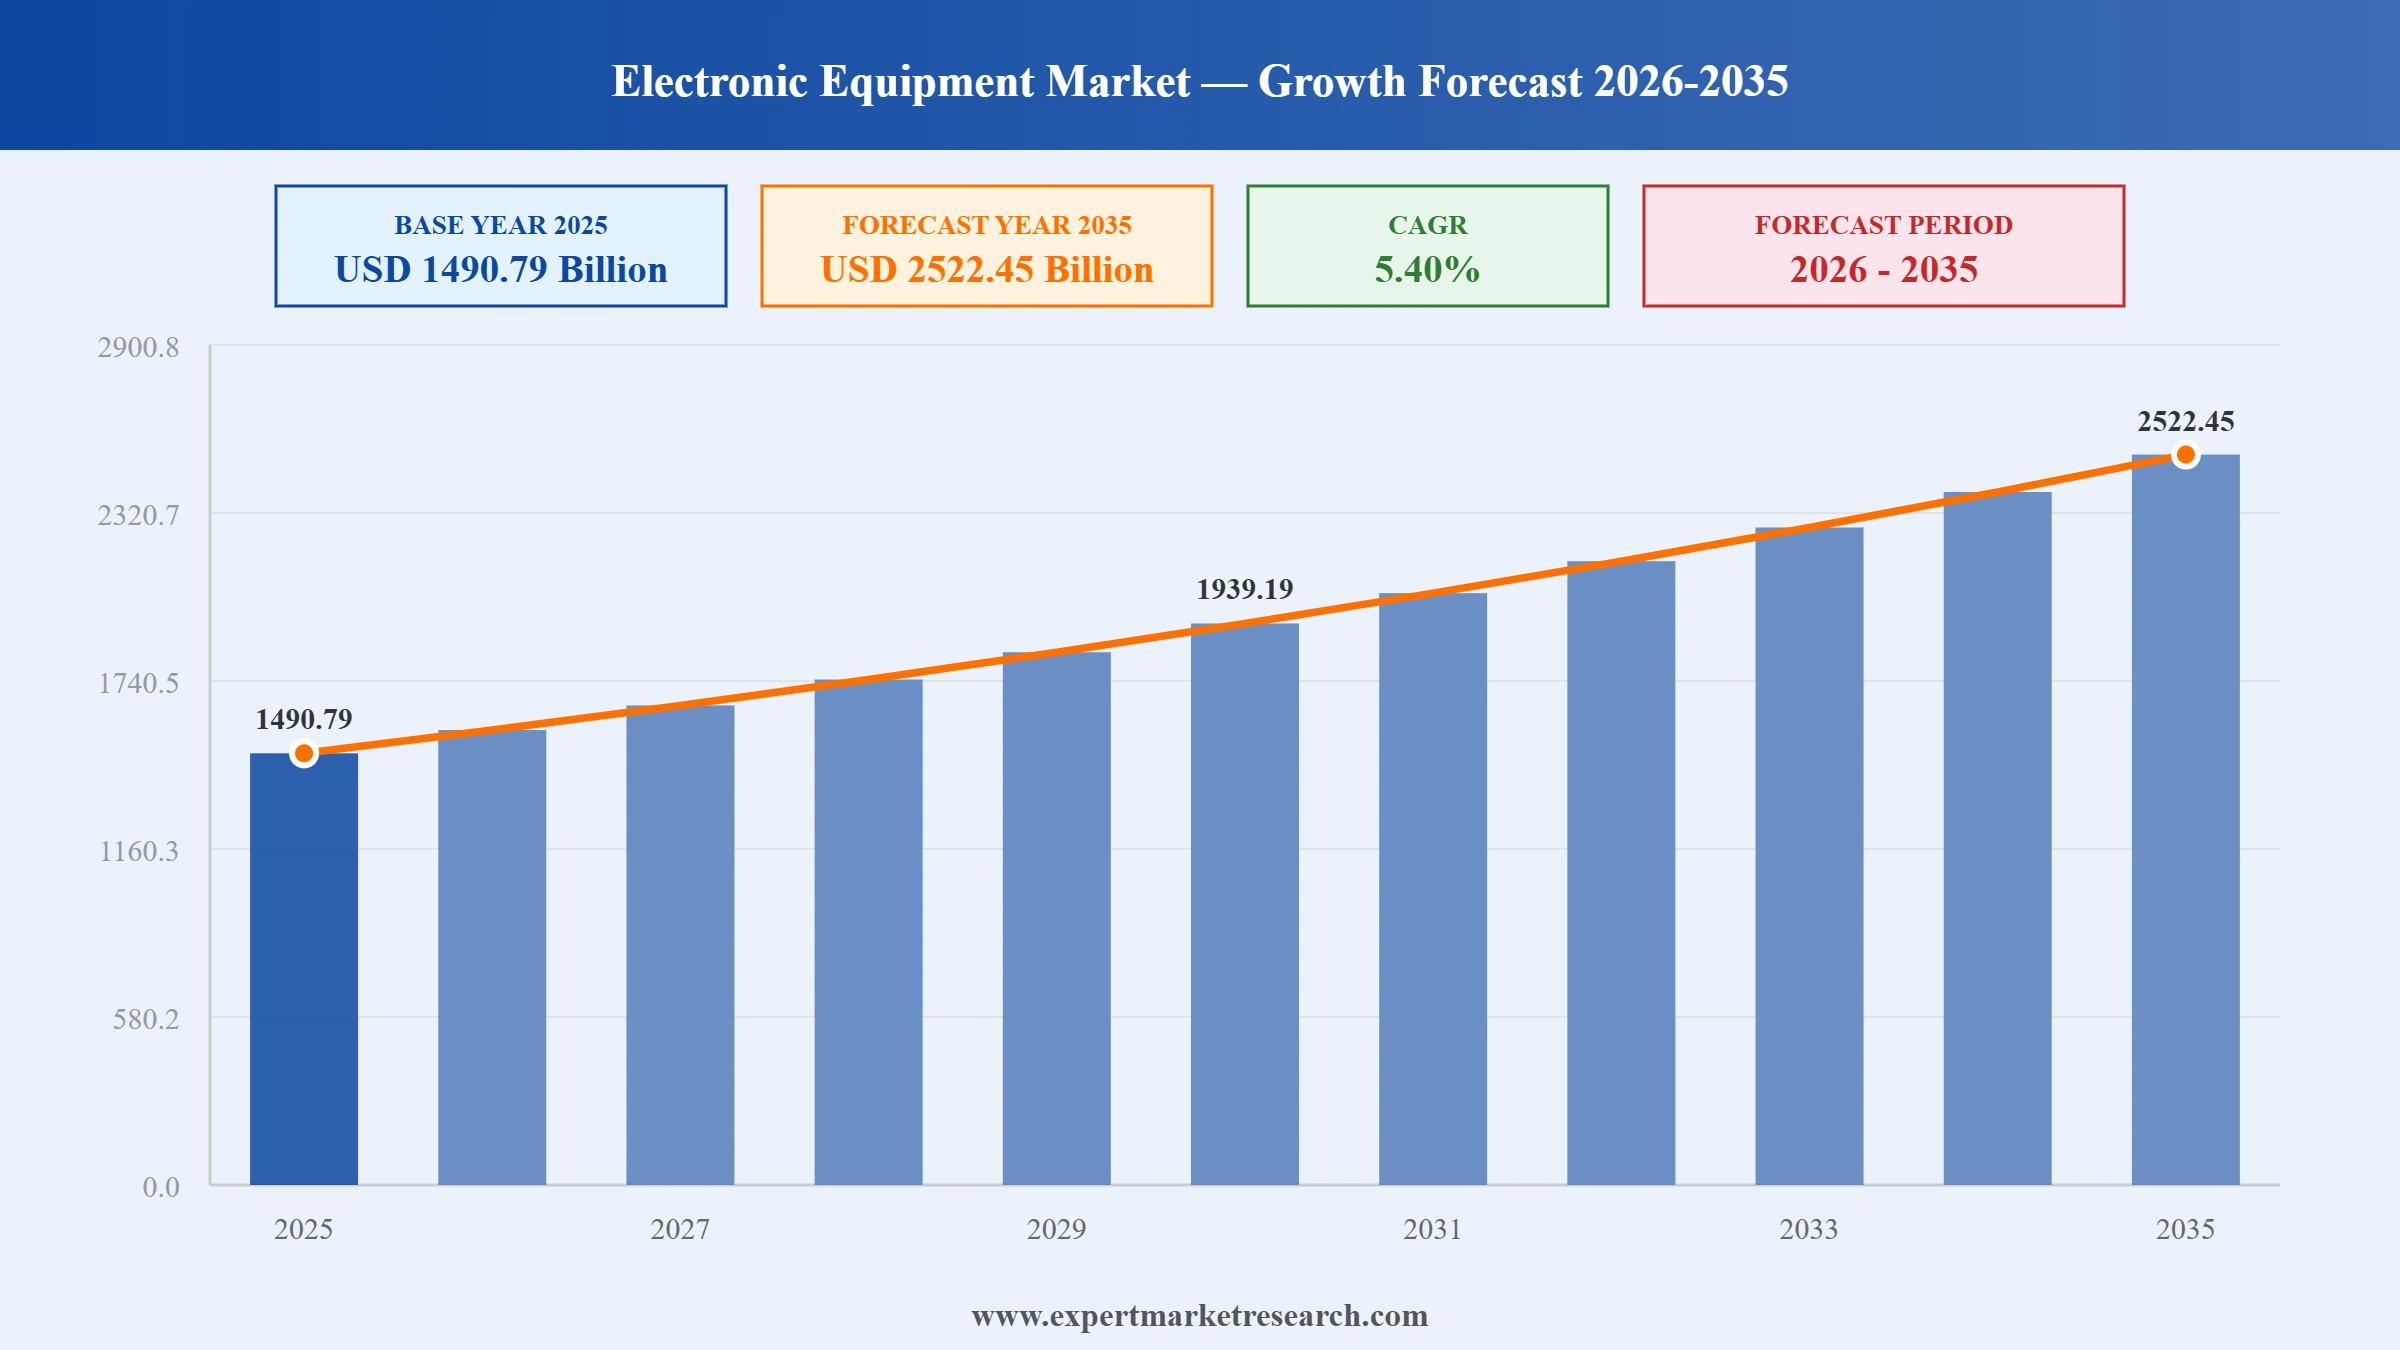
The global electronic equipment market reached a value of USD 1490.79 Billion at 2025 and is projected to expand at a CAGR of around 5.40% during the forecast period of 2026-2035. With rapid AI device integration across smartphones and laptops, supply chain diversification toward new regional production hubs, rising consumer demand for 5G-enabled devices, and the fast-growing wearable and fitness tracker segment, the market is expected to reach USD 2522.45 Billion by 2035.
Read more about this report -REQUEST FREE SAMPLE COPY IN PDF
| Global Electronic Equipment Market Report Summary | Description | Value |
| Base Year | USD Billion | 2025 |
| Historical Period | USD Billion | 2019-2025 |
| Forecast Period | USD Billion | 2026-2035 |
| Market Size 2025 | USD Billion | 1490.79 |
| Market Size 2035 | USD Billion | 2522.45 |
| CAGR 2019-2025 | Percentage | XX% |
| CAGR 2026-2035 | Percentage | 5.40% |
| CAGR 2026-2035 - Market by Region | Asia Pacific | 6.2% |
| CAGR 2026-2035 - Market by Product | Mobile Phones | 6.0% |
| Market Share by Region 2025 | North America | 17.6% |
The global electronic equipment market is undergoing a structural shift driven by AI integration, supply chain regionalisation, and the rapid growth of premium device categories including foldables and AI-enabled wearables. Leading manufacturers are simultaneously investing in domestic manufacturing capacity and accelerating product innovation across all major segments, from smartphones to fitness trackers. These dynamics are reshaping competitive positions and production landscapes across all five major regions.
In March 2026, Apple expanded its American Manufacturing Program by adding Bosch, Cirrus Logic, TDK, and Qnity Electronics as partners, accelerating its USD 600 billion, four-year commitment to U.S. manufacturing and broadening its domestic supply chain for electronic equipment.
At MWC 2026 in March, Lenovo launched a new range of AI-powered laptops and tablets including the Idea Tab Pro Gen 2 with Lenovo Qira AI assistant, and announced an AI technology partnership with FIFA for the FIFA World Cup 2026.
In February 2026, Samsung unveiled the Galaxy S26 Series and Galaxy Buds4 at MWC, integrating Galaxy AI across both devices. Samsung simultaneously announced its strategy to transition global manufacturing into AI-driven factories by 2030.
In September 2025, Sony Corporation launched a PlayStation-themed fitness tracker in China, developed in partnership with Xiaomi on the Smart Band 9 Pro platform. The launch marked Sony's debut in China's wearable fitness segment, commemorating PlayStation's 10th anniversary.
Rising AI adoption is redefining the global electronic equipment market, as manufacturers embed on-device intelligence into smartphones, tablets, and wearables. Samsung's CES 2026 announcement to expand AI-enabled devices from 400 million to 800 million units reflects this industry-wide transformation.
Major producers are diversifying manufacturing away from single-source dependencies through new hubs in India, Vietnam, and the U.S., driving global electronic equipment market growth. Apple's move to begin Mac mini production at its Houston factory in 2026 exemplifies this shift.
In Q3 2025, global PC shipments rose 8.1% year-on-year, driven by the approaching Windows 10 sunset and tariff-related inventory restocking. Lenovo, Apple, and ASUS each recorded over 10% growth in shipments, demonstrating the electronic equipment industry's resilience amid trade disruptions.
The premium tier of the global electronic equipment sector is expanding via foldable smartphones and AI-enhanced tablets. Samsung shipped 12.5 million foldable devices in 2024, holding over 75% of the global foldable segment, reinforcing the premiumisation trend across electronic equipment.
Growing health consciousness is expanding the fitness tracker segment of the electronic equipment industry. Over 580 million wearable devices shipped globally in 2024, with fitness trackers comprising over 35% of shipments, propelled by rising adoption for chronic health condition monitoring.
“Electronic Equipment Market Report and Forecast 2026-2035” offers a detailed analysis of the market based on the following segments:
Market Breakup by Product
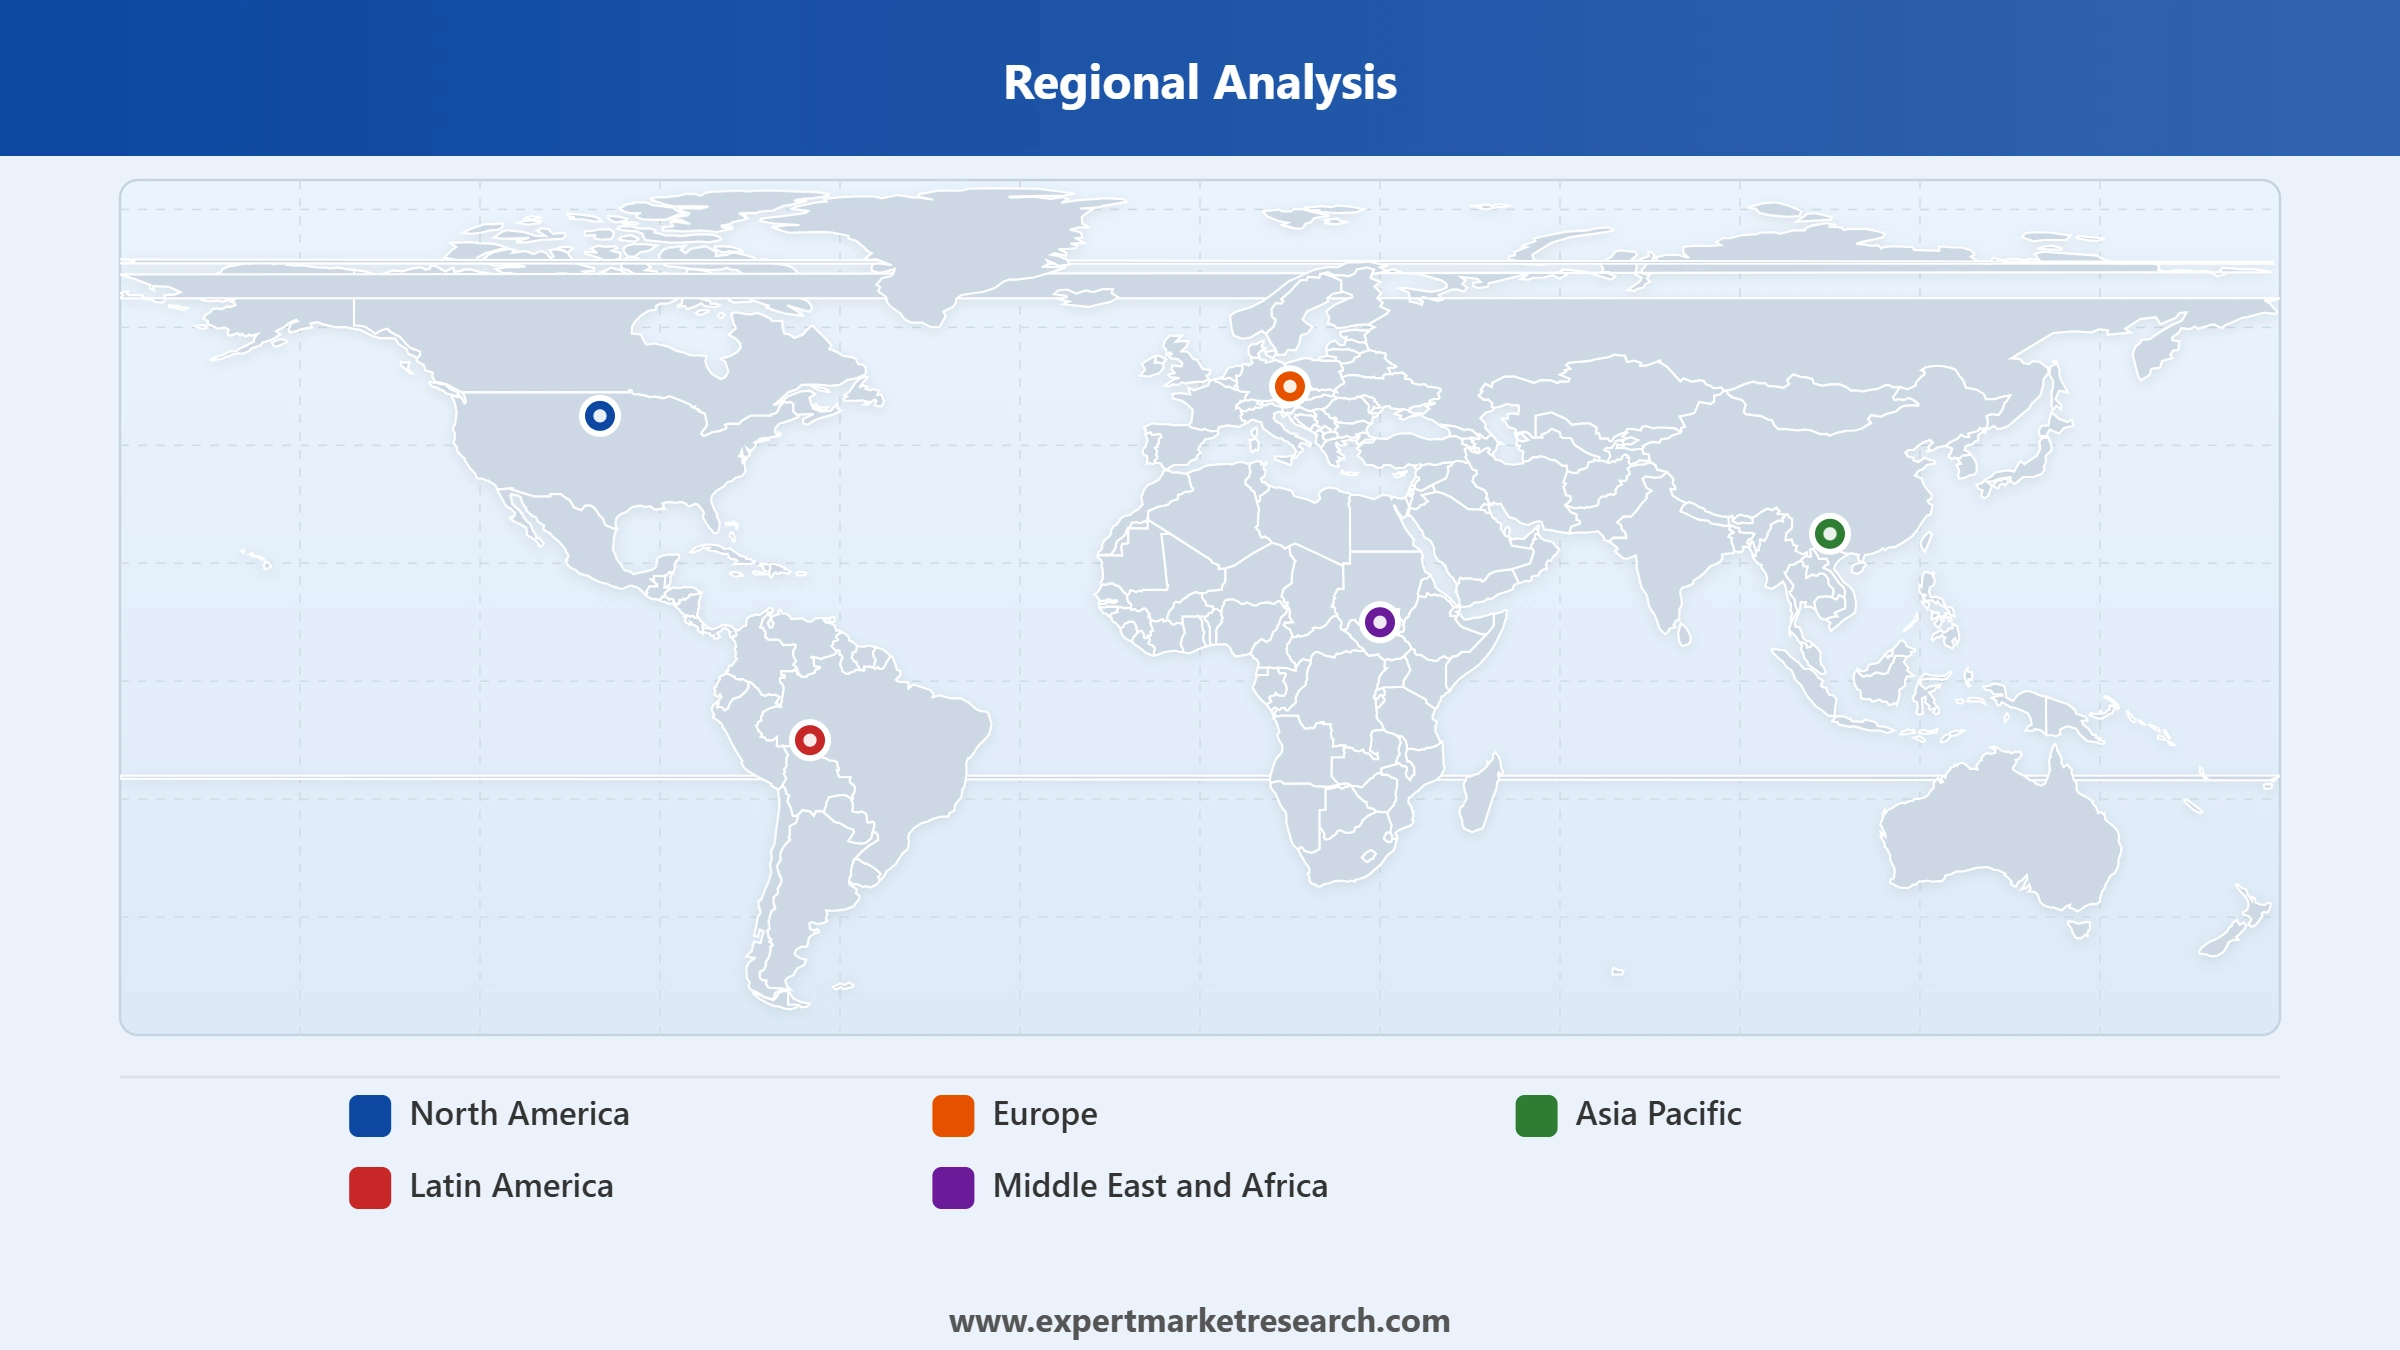
Market Breakup by Region
Key Insight: Asia Pacific dominates the global electronic equipment market, accounting for the largest regional share driven by China and South Korea's manufacturing scale, India's surging consumer base, and deep 5G and semiconductor infrastructure across the region. North America holds the second-largest share, underpinned by premium device demand and enterprise technology spending, while Europe advances through sustainability regulations and accelerating 5G deployment. Latin America and the Middle East and Africa represent high-growth frontier markets with expanding digital access and rising disposable incomes.


Read more about this report -REQUEST FREE SAMPLE COPY IN PDF
Asia Pacific dominates the market due to unparalleled manufacturing scale and massive consumer base
Asia Pacific dominates the global electronic equipment market, accounting for approximately 43-50% of global revenue. The region's leadership stems from its unparalleled manufacturing ecosystem, with China, South Korea, Taiwan, and Japan collectively hosting the majority of the world's electronic equipment production capacity. Government manufacturing incentives, massive domestic consumer bases, and established supply chain infrastructure across the region continue to reinforce its position as both the production engine and the consumption powerhouse of the global electronic equipment market.
Read more about this report -REQUEST FREE SAMPLE COPY IN PDF
North America is a high-growth region for premium electronic equipment, with the United States' manufacturing buildout driven by Apple's USD 600 billion American Manufacturing Program and Samsung's USD 37 billion Texas semiconductor facility restructuring production away from Asia-only supply chains. In March 2026, Apple expanded its AMP by adding four new manufacturing partners, reflecting the region's accelerating role in global electronic equipment production. Europe maintains a significant share through sustainability regulations and 5G deployment, while Middle East and Africa represent the fastest-growing frontier markets as smartphone penetration rises rapidly.
Stay ahead in one of the world's most dynamic technology sectors with our comprehensive global electronic equipment market forecast for 2026-2035. Whether you are a device manufacturer assessing regional production opportunities, an investor tracking AI adoption trends, a component supplier mapping demand shifts, or a retailer planning product range strategy, this report delivers the granular intelligence you need to act with confidence. Download your free sample today and uncover the key opportunities shaping the global electronic equipment industry through 2035.
Upto 15% Off
USD
$2999 $2699
$4839 $4355
$5999 $5099
$7259 $6170


*While we strive to always give you current and accurate information, the numbers depicted on the website are indicative and may differ from the actual numbers in the main report. At Expert Market Research, we aim to bring you the latest insights and trends in the market. Using our analyses and forecasts, stakeholders can understand the market dynamics, navigate challenges, and capitalize on opportunities to make data-driven strategic decisions.*
The global market size for electronic equipment is expected to reach a value of approximately USD 2522.45 Billion by 2035.
The market is expected to grow at a CAGR of 5.40% between 2026 and 2035.
The major market drivers include development of user-friendly smart devices, technological advancements, and digitalisation.
The key trends of the market are increasing demand for consumer electronic electronics, rising trend of work from home, use of electronic equipment for fitness, and growing popularity of connected homes.
Electronic equipment refers to devices that depend on electromagnetic fields and are operated with the help of small electrical parts such as transistors and circuits.
There are various applications of electronic equipment such as in the image processing, smart grid systems, medical applications, consumer electronics, industrial automation and motion control, and industrial electronics.
The global electronic equipment market is segmented regionally into North America, Europe, Asia Pacific, Latin America, and the Middle East and Africa.
The primary types of electronic equipment in the market are mobile phones, tablets, laptops, desktop computer, headphone and speakers, and fitness trackers, among others.
Datasheet
One User
USD 2,999
USD 2,699
tax inclusive*
Single User License
One User
USD 4,839
USD 4,355
tax inclusive*
Five User License
Five User
USD 5,999
USD 5,099
tax inclusive*
Corporate License
Unlimited Users
USD 7,259
USD 6,170
tax inclusive*
*Please note that the prices mentioned below are starting prices for each bundle type. Kindly contact our team for further details.*
Flash Bundle
Small Business Bundle
Growth Bundle
Enterprise Bundle
*Please note that the prices mentioned below are starting prices for each bundle type. Kindly contact our team for further details.*
Flash Bundle
Number of Reports: 3
20%
tax inclusive*
Small Business Bundle
Number of Reports: 5
25%
tax inclusive*
Growth Bundle
Number of Reports: 8
30%
tax inclusive*
Enterprise Bundle
Number of Reports: 10
35%
tax inclusive*
How To Order

Select License Type
Choose the right license for your needs and access rights.

Click on ‘Buy Now’
Add the report to your cart with one click and proceed to register.

Select Mode of Payment
Choose a payment option for a secure checkout. You will be redirected accordingly.
Strategic Solutions for Informed Decision-Making
Gain insights to stay ahead and seize opportunities.

Get insights & trends for a competitive edge.

Track prices with detailed trend reports.

Analyse trade data for supply chain insights.

Leverage cost reports for smart savings

Enhance supply chain with partnerships.

Connect For More Information
Our expert team of analysts will offer full support and resolve any queries regarding the report, before and after the purchase.
Our expert team of analysts will offer full support and resolve any queries regarding the report, before and after the purchase.
We employ meticulous research methods, blending advanced analytics and expert insights to deliver accurate, actionable industry intelligence, staying ahead of competitors.
Our skilled analysts offer unparalleled competitive advantage with detailed insights on current and emerging markets, ensuring your strategic edge.
We offer an in-depth yet simplified presentation of industry insights and analysis to meet your specific requirements effectively.


