

Consumer Insights
Uncover trends and behaviors shaping consumer choices today
Procurement Insights
Optimize your sourcing strategy with key market data
Industry Stats
Stay ahead with the latest trends and market analysis.
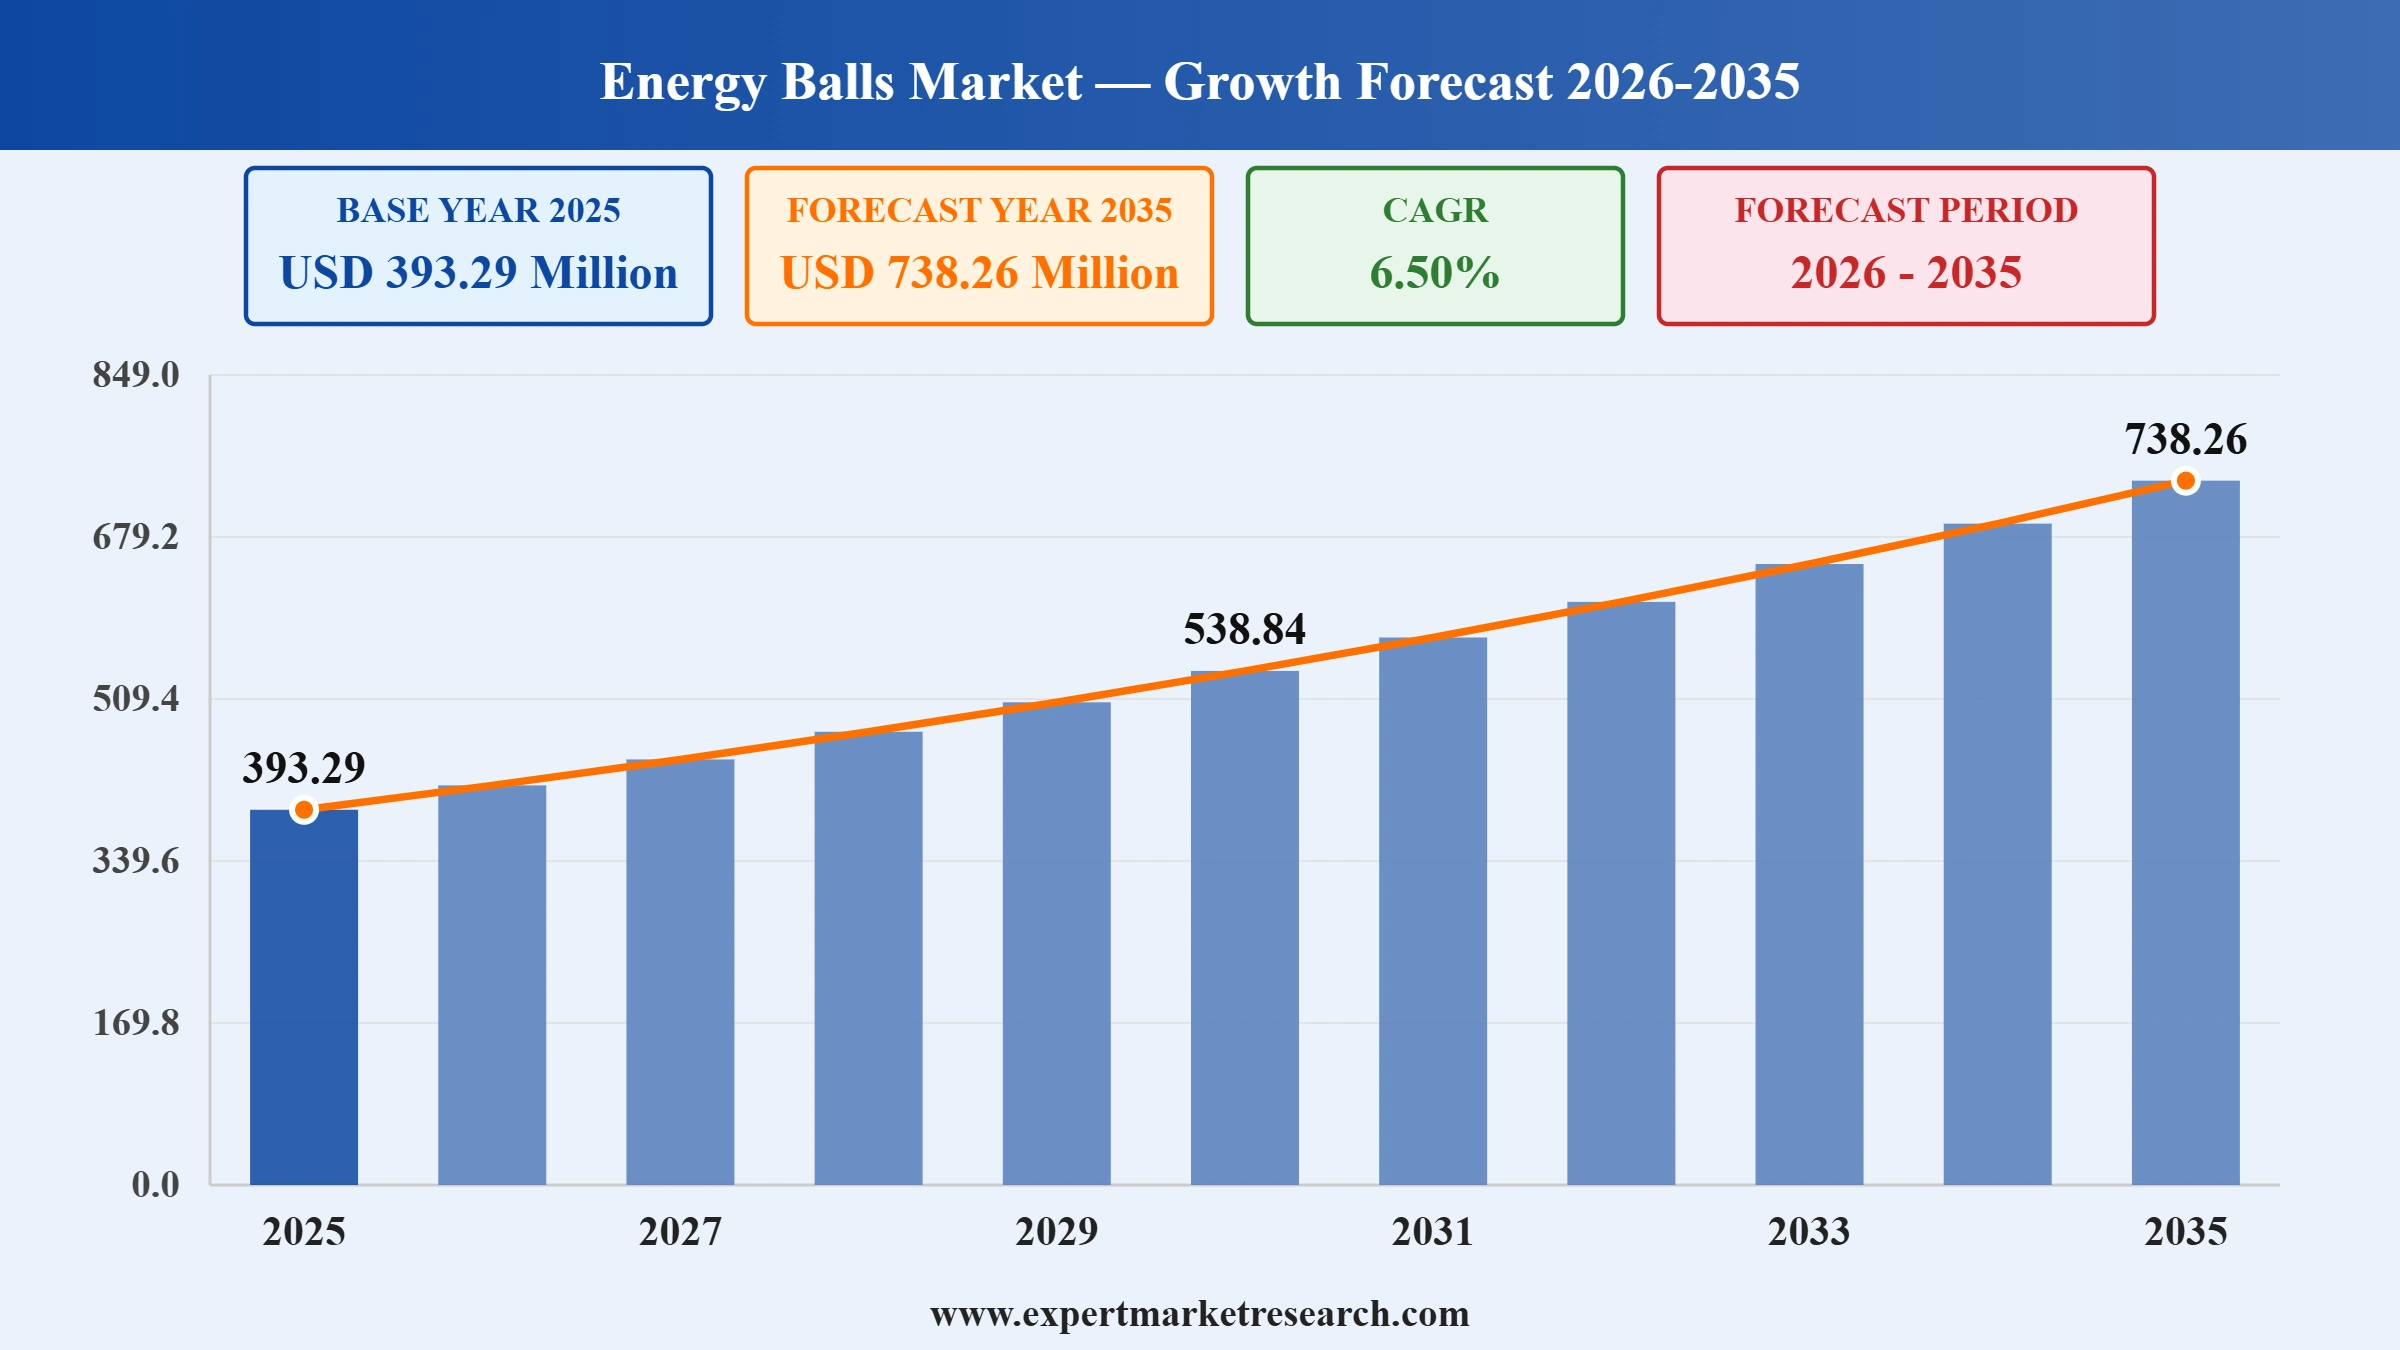
The global energy balls market attained a value of USD 393.29 Million in 2025 and is projected to expand at a CAGR of 6.50% through 2035. The market is further expected to achieve USD 738.26 Million by 2035. Surging demand for portable, protein rich, and clean label snacks is prompting manufacturers to introduce nut based, fruit based, and functional energy balls that support active lifestyles and on the go nutrition.
Rising health consciousness and demand for convenient, nutrient dense snacking options are encouraging manufacturers to expand their energy ball portfolios beyond traditional nut and date-based recipes. Brands are introducing chocolate based, fruit based, and functional variants fortified with plant protein, fiber, and adaptogens to appeal to fitness enthusiasts and everyday snackers alike. Retailers and online platforms are also broadening shelf space and subscription models for energy balls, supporting wider adoption across grocery, convenience, and direct to consumer channels.
The energy balls market is witnessing further momentum as leading brands accelerate clean label reformulation and portion-controlled formats to meet evolving consumer preferences, with several notable brand repositioning moves. These strategies are helping brands capture demand from consumers seeking real food snacking over traditional protein bar formats. This shift toward reformulation is reinforced by the United States Food and Drug Administration’s final rule updating the nutrient content claim "healthy," published in the Federal Register in December 2024 with a 2028 compliance deadline, which is prompting snack manufacturers nationwide to reformulate products to meet updated limits on added sugars, saturated fat, and sodium.
In addition, energy balls market players are allocating greater investment toward clean label reformulation, international expansion, and functional ingredient innovation within the broader protein supplements market in order to build differentiated portfolios amid competitive snacking categories. Firms like Deliciously Ella, The Protein Ball Co, and Betty Lou's Inc. are strengthening retail distribution and product ranges to serve growing wellness focused demand across grocery, convenience, and e-commerce channels.
Read more about this report - REQUEST FREE SAMPLE COPY IN PDF
Naturipe Snacks introduced refrigerated SnackBites made with real blueberries and the BC30 probiotic, each three-count package delivering four grams of protein and 100 calories per bite. Companies can extend protein positioning into the refrigerated produce aisle to reach shoppers beyond the traditional snack bar categories through the energy balls market.
The Protein Ball Co unveiled a three-flavor Stuffed range featuring pistachio, matcha, and hazelnut varieties with soft filled centers. Companies can introduce indulgent, textured formats to differentiate their offerings and address protein bar format fatigue.
RXBAR introduced bite sized Protein Energy Bites with 8 to 10 grams of protein per pouch, made from peanut butter, egg whites, dates, and apples. Companies can extend established snack bar brands into bite sized formats to capture unmet demand in the energy balls market.
Former NFL wide receiver Ed McCaffrey launched McCaffrey Protein Bites in Chocolate Chip Cookie Dough, Birthday Cake, and Fudge Brownie flavors, positioned as plant-based, non-GMO, and gluten-free. Companies can pair athlete-founder branding with functional formulation to boost customer awareness.
Mainstream grocery retailers are launching their own private label protein ball ranges to capture rising consumer demand generated by viral social media interest in the energy balls market. Retailers are pricing these entries well below branded competitors to widen accessibility for mainstream shoppers. For example, in January 2026, Aldi launched a new own label Protein Balls range in Peanut and Cocoa & Raspberry flavors priced at 69p, leveraging the trending "#ProteinBalls" social media phenomenon. Continued private label entry is expected to intensify price competition while widening overall category exposure.
Rising GLP-1 medication adoption is reshaping the entire energy balls market dynamics and trends as consumers incline towards smaller basket sizes and portion controlled, nutrient dense options that fit reduced appetite patterns. Manufacturers are responding by engineering protein content into everyday snacking formats rather than treating it as a specialized fitness product. According to the International Food Information Council’s 2025 Food & Health Survey, published July 2025, 70 percent of Americans said they were trying to consume more protein, continuing a five-year upward trend, with GLP-1 adoption expected to drive further demand for high protein, nutrient dense, portion-controlled snacking options. Continued GLP-1 medication adoption is expected to sustain demand for portion-controlled protein snacking formats.
Emerging protein snack brands are broadening distribution across warehouse club and mass retail channels to scale beyond initial regional footholds. Companies are following successful regional launches with phased national retail rollouts supported by expanded distribution infrastructure, thereby boosting demand in the energy balls market. For example, Day Out, a New Jersey based protein ball brand, launched its Brownie Batter Protein Balls at 54 Costco stores across the Northeast in August 2025 before landing nationwide at 2,000 Target stores in June 2026. Continued phased retail expansion is expected to help emerging brands scale distribution while managing supply chain growth.
Brands scaling quickly across national retail chains are investing in expanded distribution center networks to support rapid multi region growth. Companies are prioritizing logistics infrastructure investment ahead of retail rollouts to avoid stockouts during rapid expansion phases. Scott's Protein Balls grew from 86 to 350 Target stores nationwide within four months, expanding its distribution network from two Target distribution centers in the northeast to eight centers across the country. Continued distribution infrastructure investment is expected to support further national retail expansion for fast growing protein ball brands.
The EMR's report titled "Global Energy Balls Market Report and Forecast 2026-2035" offers a detailed analysis of the market based on the following segments:
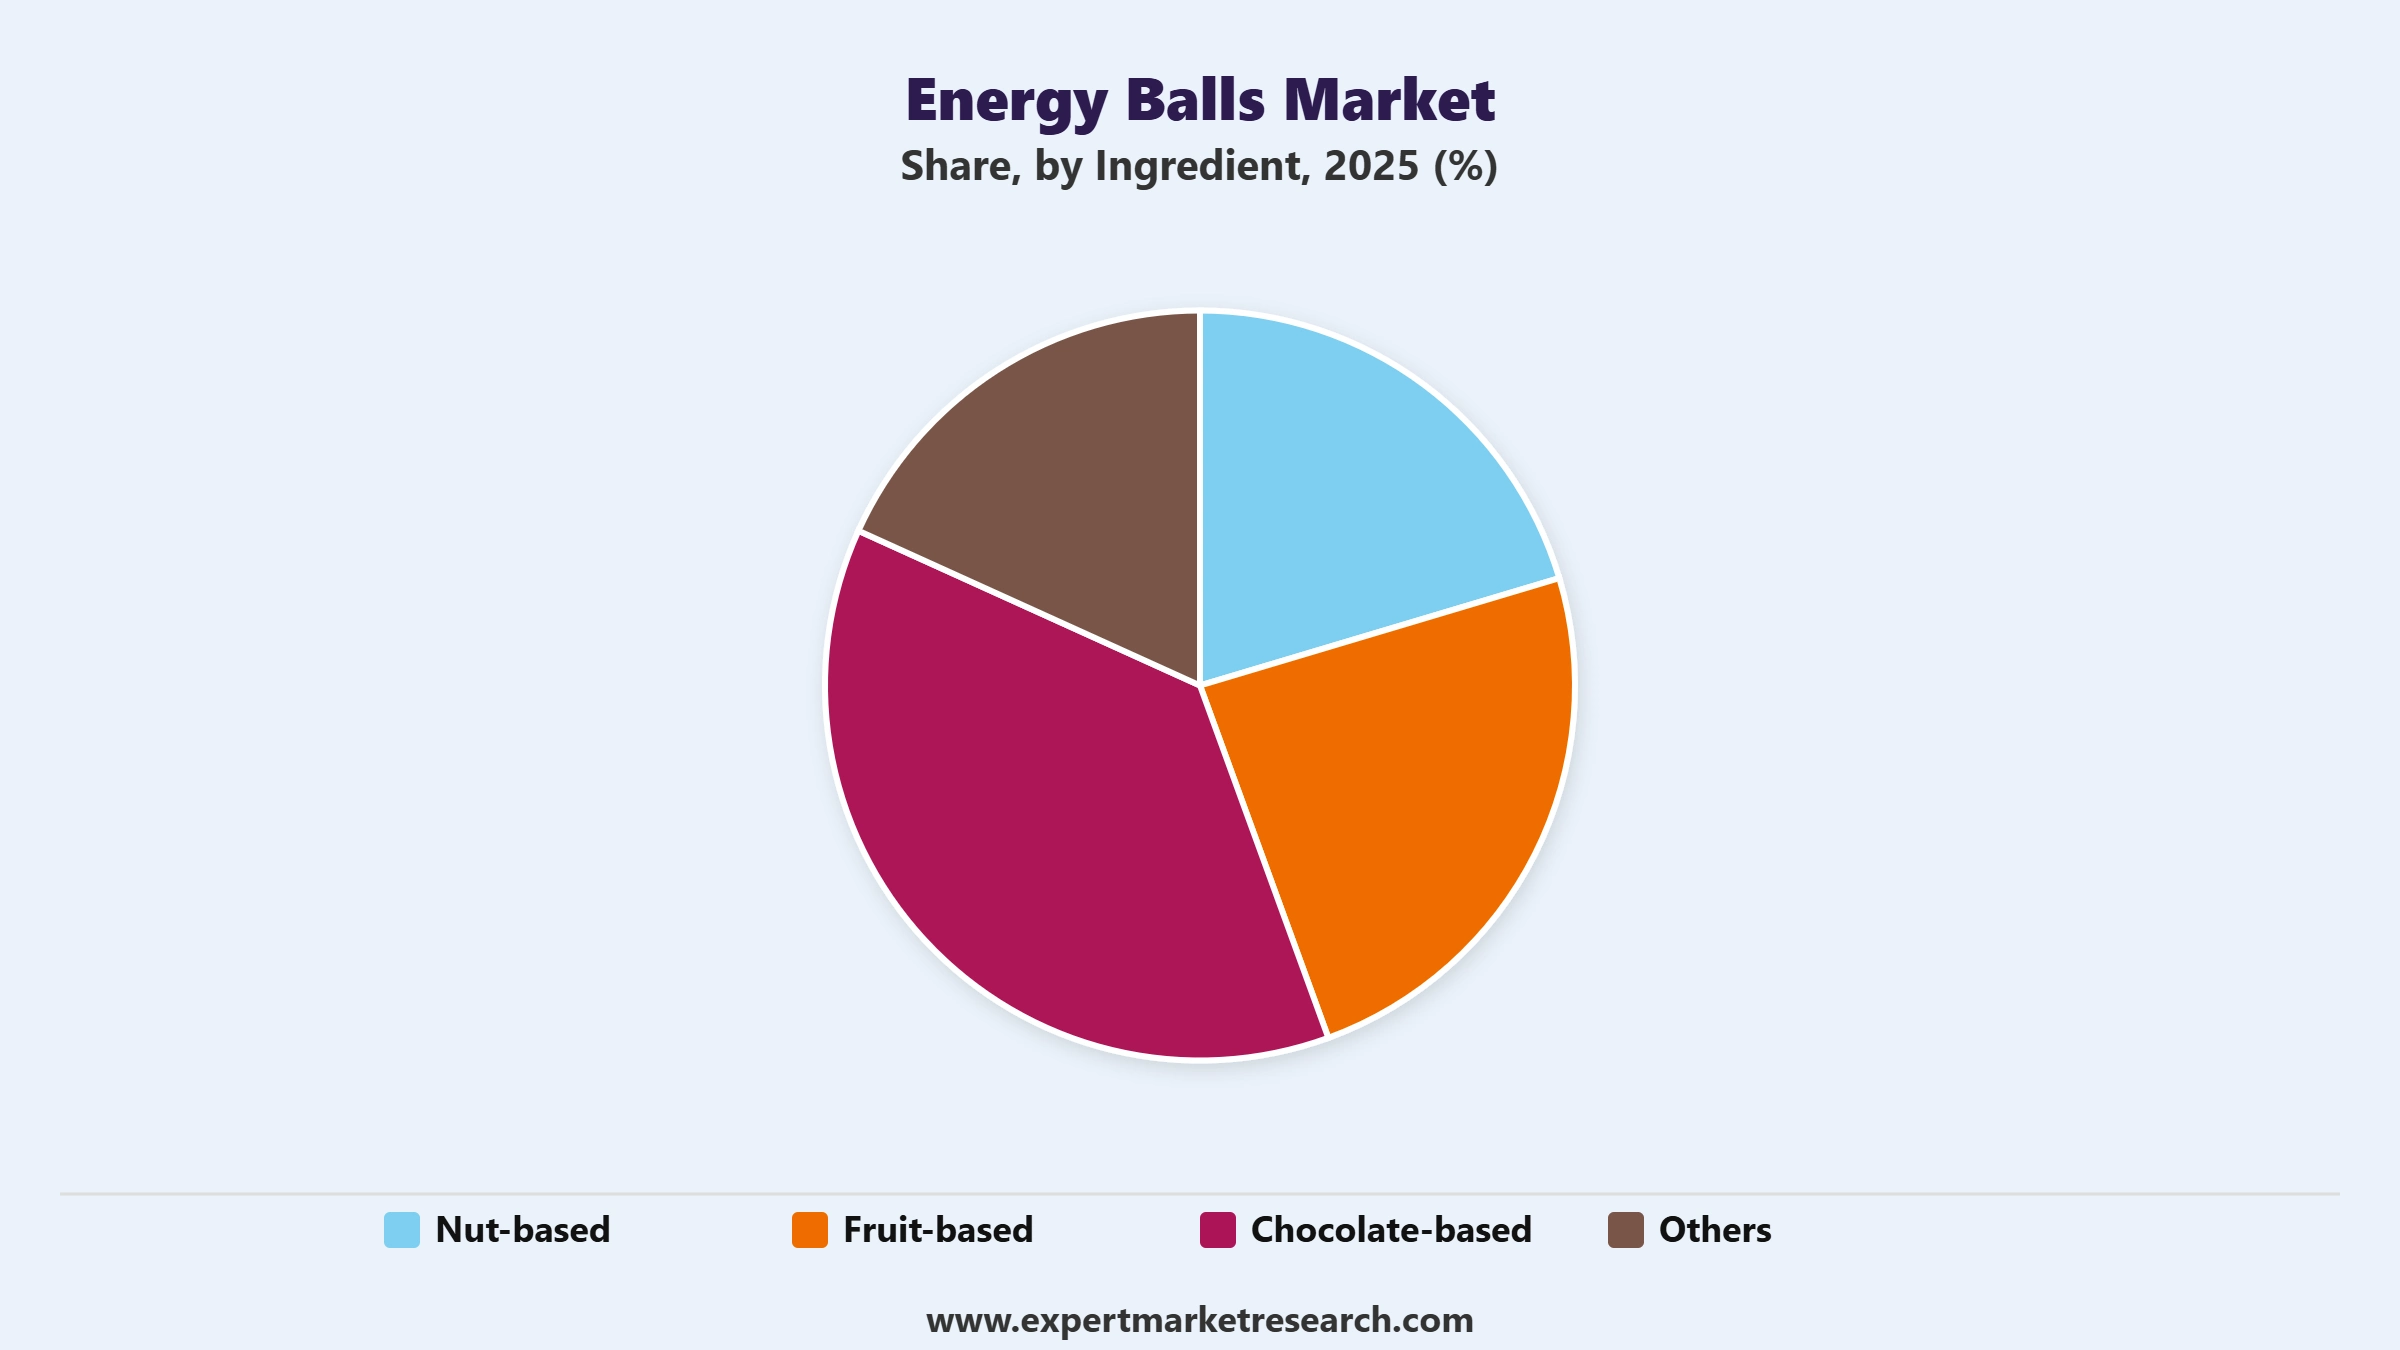
Market Breakup by Ingredient
Key Insight: Nut based energy balls hold a significant share of the energy balls market owing to their high protein and healthy fat content, which appeals to fitness focused and health-conscious consumers. Fruit based variants are gaining popularity for their natural sweetness and clean label positioning, while chocolate-based options continue to attract consumers seeking indulgent yet functional snacking options. Manufacturers are increasingly blending these ingredient categories to create hybrid formulations that balance nutrition with taste. This ingredient diversity is underpinned by steady raw material supply. The USDA's National Agricultural Statistics Service reported in its Noncitrus Fruits and Nuts 2025 Summary, published in May 2026, that the country’s date production reached 61,970 tons valued at USD 268.1 million, supporting the fruit-based ingredient base used across the category.
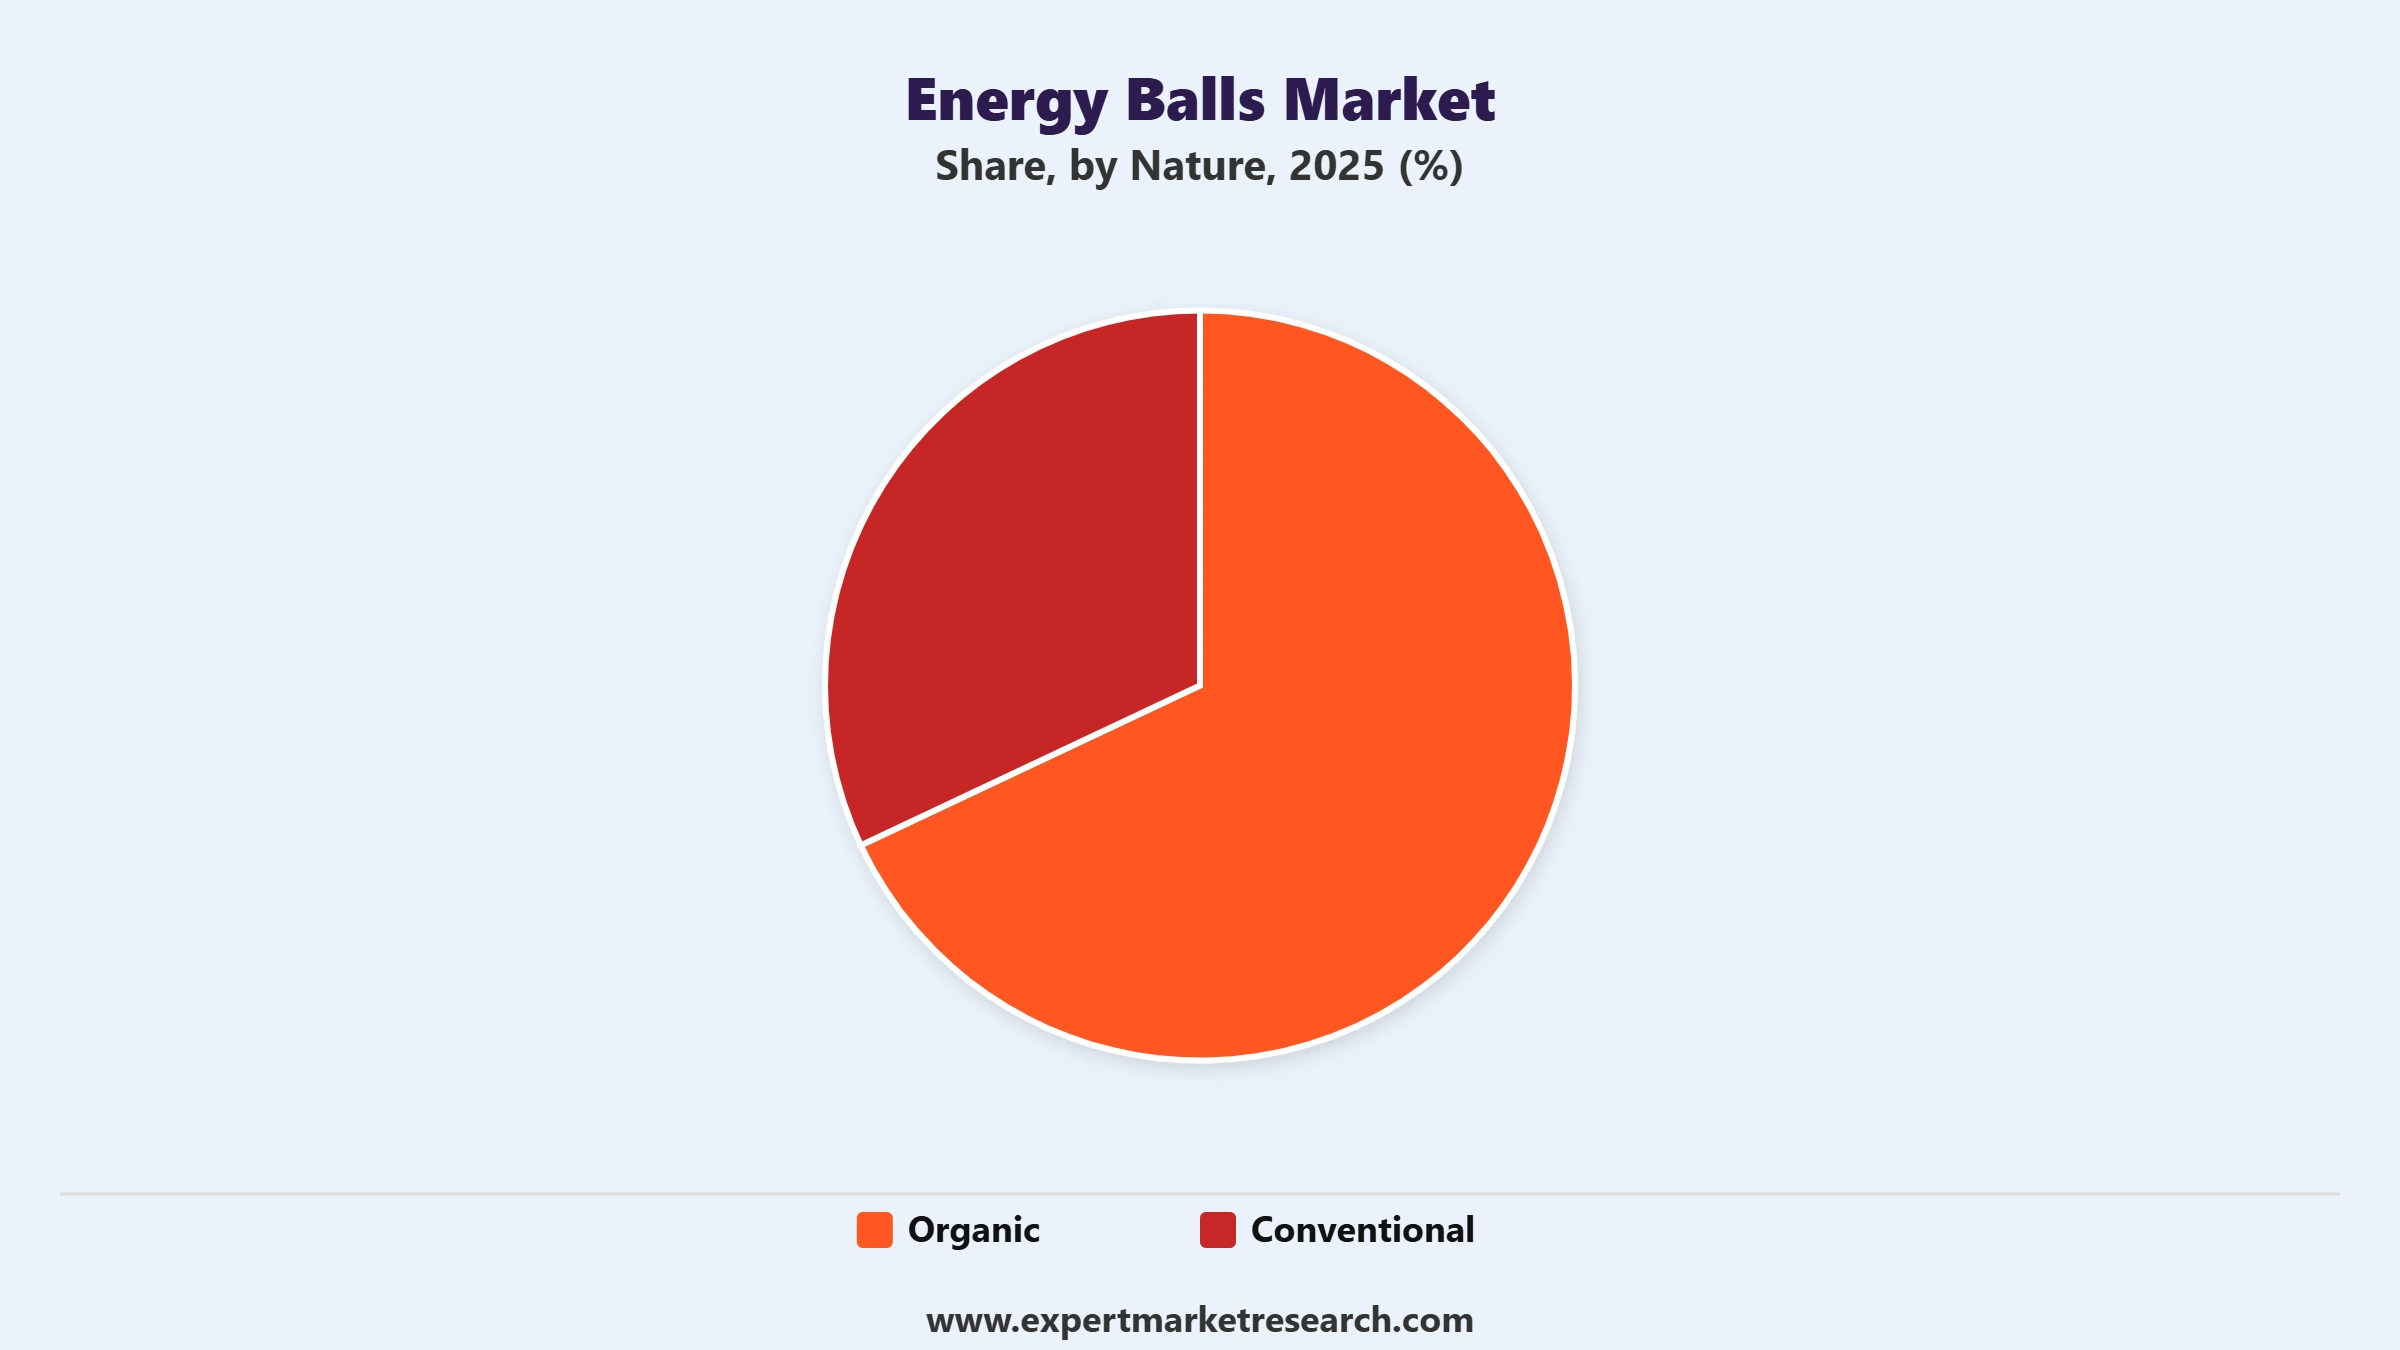
Market Breakup by Nature
Key Insight: Conventional energy balls continue to account for the larger share of the energy balls market due to their wider price accessibility and established retail presence across mainstream grocery channels. Organic variants are recording faster growth as health-conscious consumers increasingly seek pesticide free, non-GMO, and sustainably sourced ingredients. Brands are expanding certified organic product lines to capture premium positioning within the wellness snacking category. This trend is corroborated by the United States Department of Agriculture’s Economic Research Service, which reported in its Organic Situation Report, 2025 Edition that inflation adjusted organic retail sales grew at a compound annual rate of more than 7 percent between 2012 and 2023, underscoring sustained consumer demand for organic labeled food and snack products.
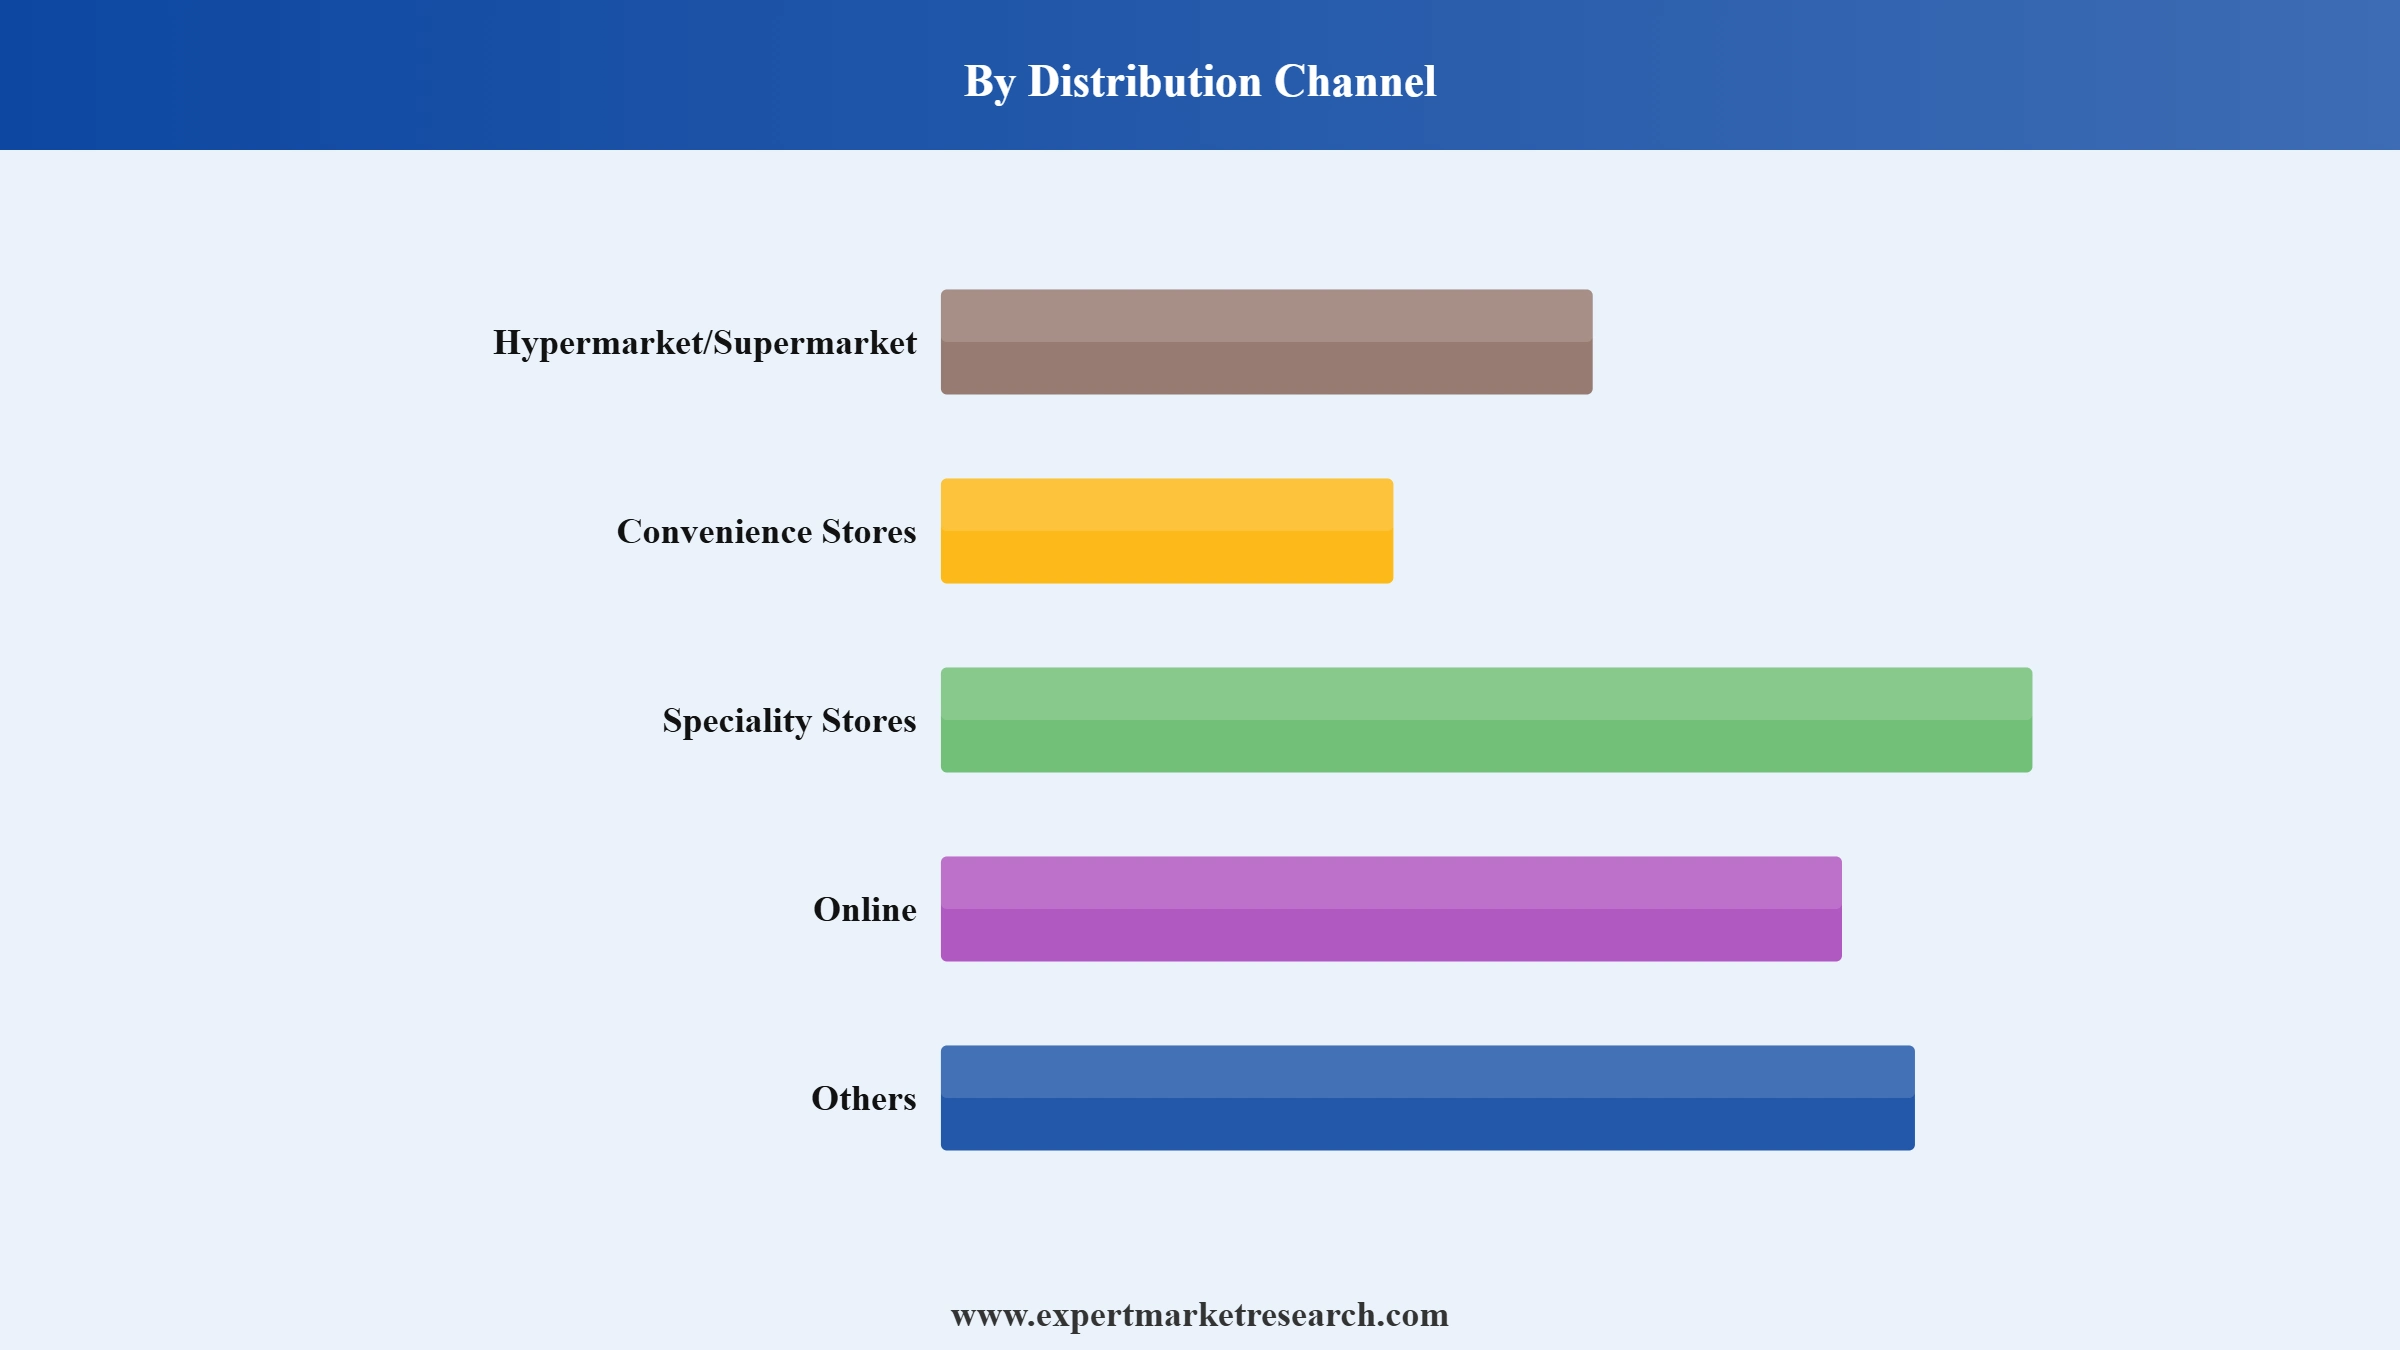
Market Breakup by Distribution Channel
Key Insight: Hypermarkets and supermarkets lead energy balls market revenue growth owing to their wide product assortment and high consumer footfall. Convenience stores support impulse purchases among on-the-go consumers, while speciality stores cater to health focused shoppers seeking curated wellness products. Online channels are recording the fastest growth as subscription models and direct to consumer platforms make it easier for brands to reach a wider audience. According to the United States Census Bureau’s Quarterly Retail E-Commerce Sales report, e-commerce accounted for 16.9 percent of total retail sales in the first quarter of 2026, up 9.8 percent year over year.
Market Breakup by Region
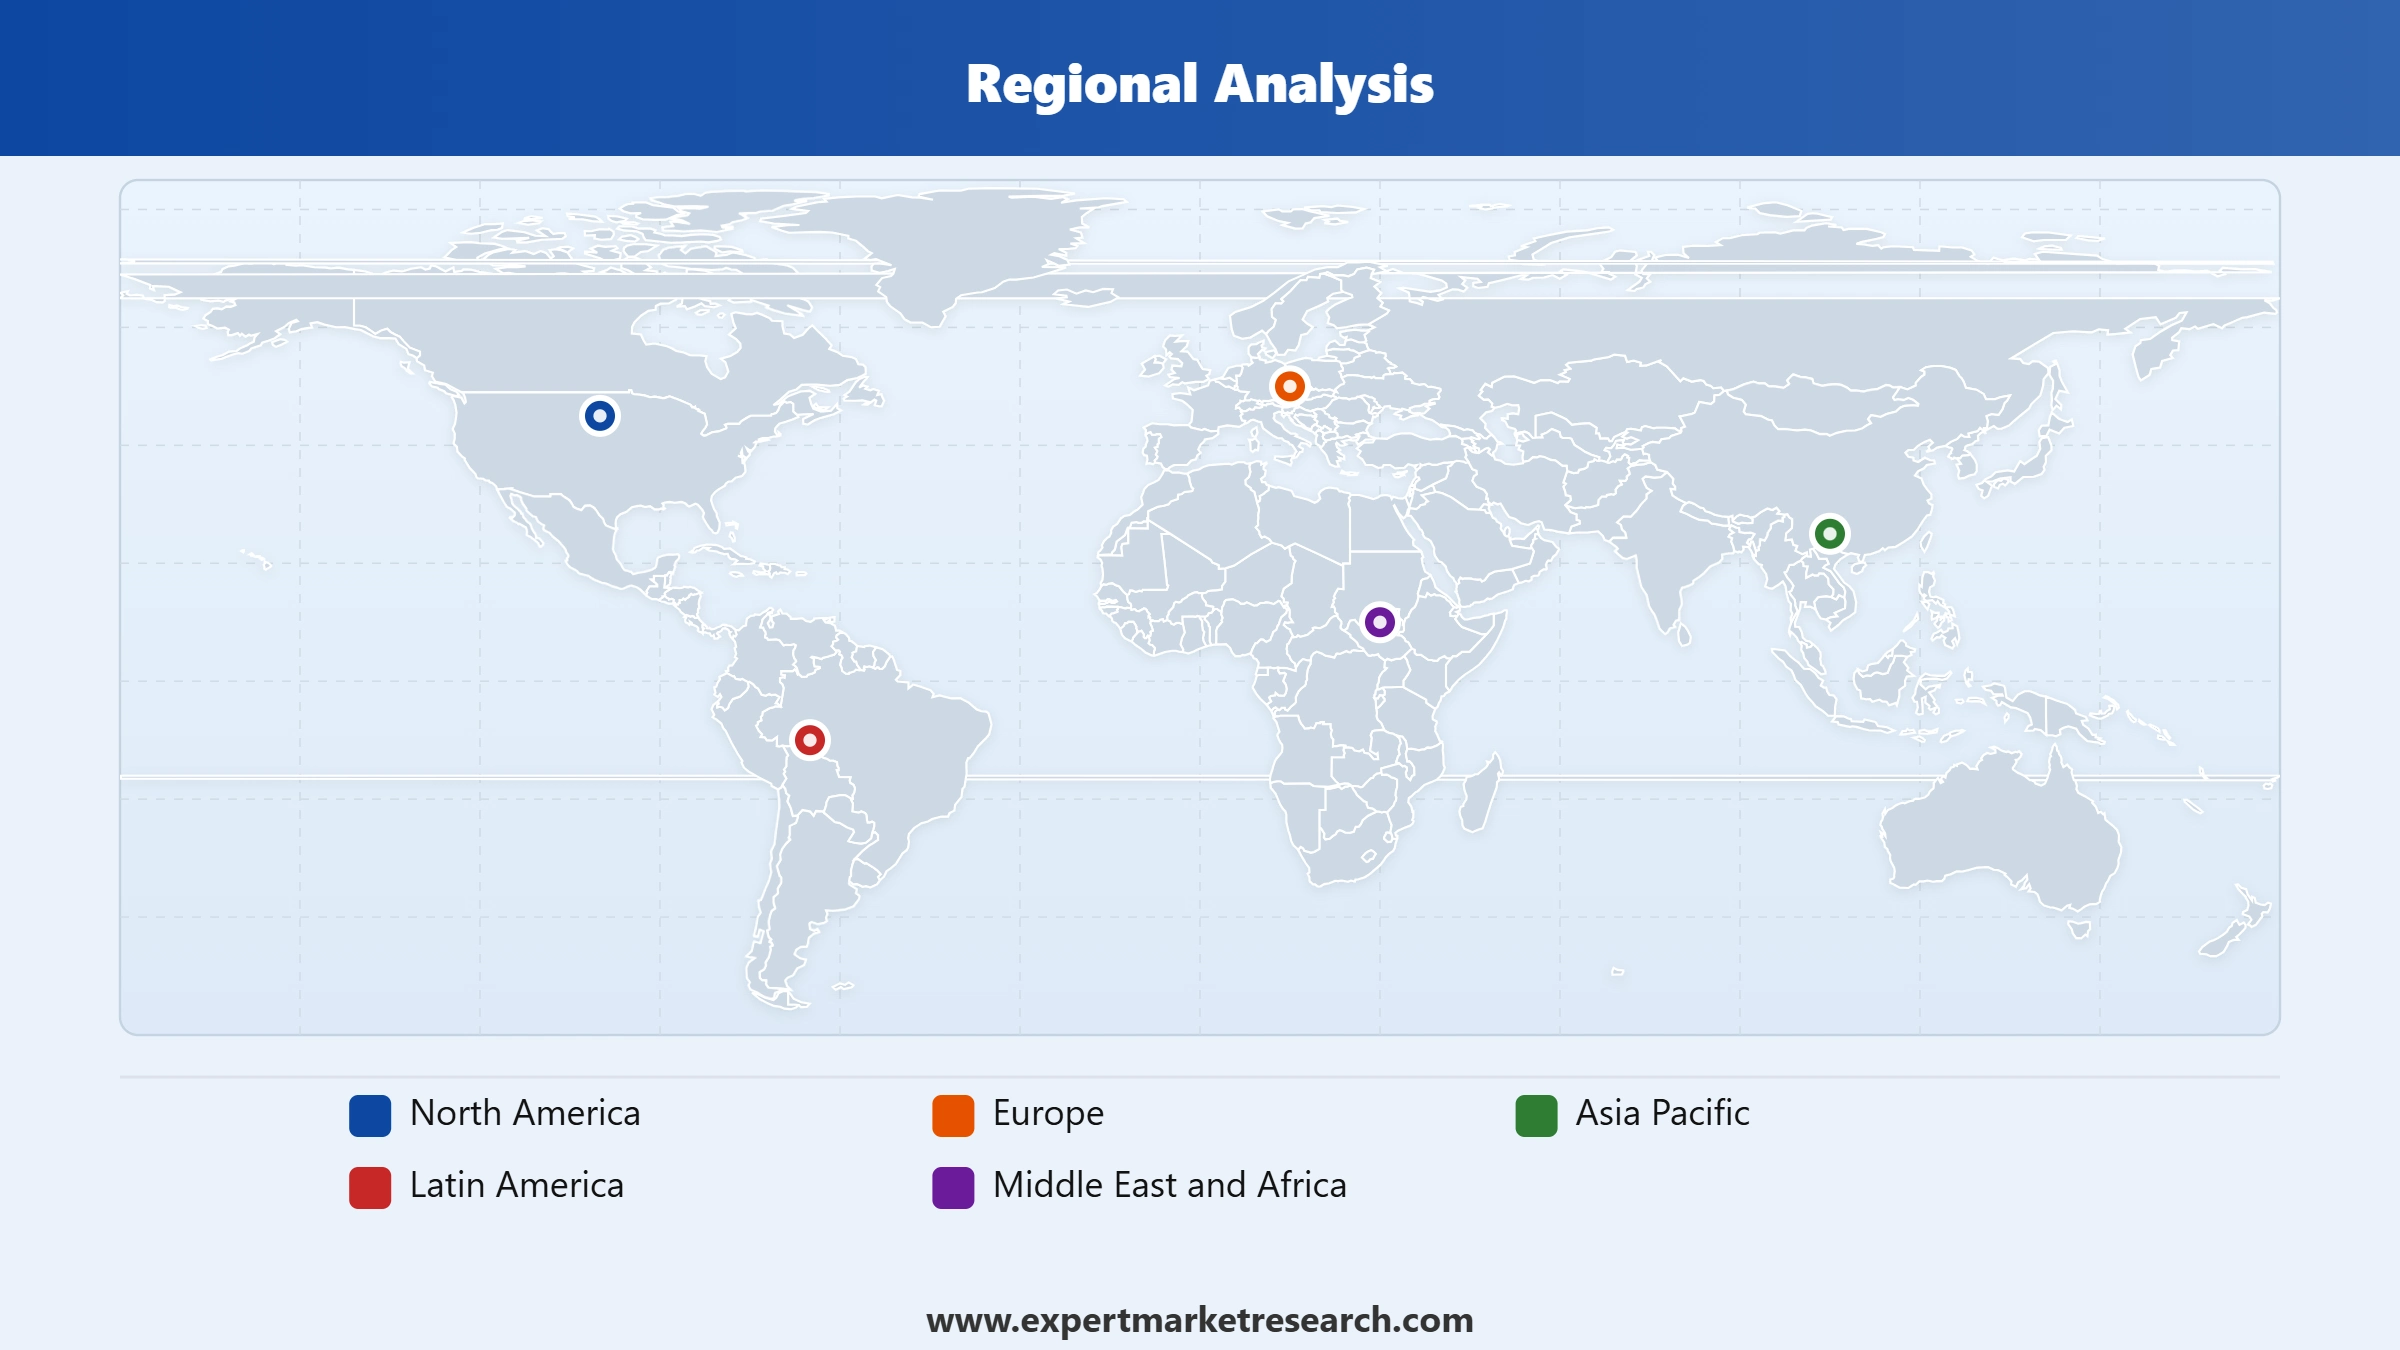
Key Insight: Regional dynamics in the energy balls market continue to shape brand strategies and distribution networks. Europe leads the market owing to strong wellness culture and established clean label snacking brands across the United Kingdom and Western Europe. North America is witnessing rapid growth supported by rising protein focused snacking trends. Asia Pacific is registering the fastest growth, driven by rising health awareness, urbanization, and expanding modern retail infrastructure across China, India, and Southeast Asia. China's National Bureau of Statistics reported that total retail sales of consumer goods reached 50,120.2 billion yuan in 2025, up 3.7 percent year on year, reflecting the expanding retail base supporting Asia Pacific's growth in packaged health snacking.
Read more about this report - REQUEST FREE SAMPLE COPY IN PDF
By ingredient, nut-based energy balls dominate the market through their strong protein and healthy fat positioning
Nut based energy balls hold the largest share of the energy balls market as almonds, cashews, and peanuts provide the protein and healthy fat profile sought by fitness focused consumers. Manufacturers are expanding nut-based product lines with added protein and fiber fortification to strengthen their functional positioning, while introducing indulgent filled and textured formats to differentiate nut-based offerings from conventional bar style competitors. This is supported by the United States Department of Agriculture’s Economic Research Service, which reported in its Fruit and Tree Nuts Outlook for July 2026 that the country’s almond production is forecast at 2.7 billion pounds for 2026, with the United States supplying more than three quarters of the world’s almond supply and exports rising 2.5 percent between August 2025 and May 2026, reinforcing the steady raw material base for nut based energy ball formulations.
Read more about this report - REQUEST FREE SAMPLE COPY IN PDF
By ingredient, fruit-based energy balls represent the fastest growing category as consumers seek naturally sweetened, clean label alternatives to nut and chocolate-based formats. Manufacturers are incorporating dates, berries, and other whole fruit ingredients to deliver natural sweetness while avoiding added sugars, appealing to consumers seeking minimally processed, real food snacking options. For example, in May 2026, Bel US launched GoGo Protein snacks and limited-edition PB&J Stack'd Bites, expanding convenient better-for-you portfolio.
By nature, conventional energy balls account for the largest share of the market through wider price accessibility
Conventional energy balls lead the energy balls market growth owing to their broader price accessibility and established presence across mainstream grocery and convenience retail channels, where private label ranges continue to widen accessibility. Manufacturers continue to expand conventional product ranges with clean label ingredient lists to address consumer demand for transparency without the premium associated with certified organic labeling.
Read more about this report - REQUEST FREE SAMPLE COPY IN PDF
By nature, organic energy balls represent the fastest growing segment as health-conscious consumers increasingly prioritize pesticide free, non-GMO, and sustainably sourced ingredients. Brands are expanding certified organic product ranges and pursuing third party certifications to strengthen consumer trust and capture premium positioning within the wellness snacking category. This trend in the energy balls market is reinforced by the United States Department of Agriculture’s Farm Service Agency, which announced that its Organic Certification Cost Share Program will reimburse eligible producers and handlers for up to 75 percent of certification costs, capped at USD 750 per scope, for the 2025 and 2026 program years, lowering the financial barriers for manufacturers seeking to expand certified organic ingredient sourcing.
By distribution channel, hypermarkets and supermarkets lead the market through wide product assortment and consumer footfall
Hypermarkets and supermarkets account for the largest share of the energy balls market as they offer extensive product assortment, competitive pricing, and high consumer footfall across mainstream grocery categories. Established grocery retailers continue to expand dedicated wellness snacking aisles, reflecting the importance of large format grocery retail for both new market entries and mainstream brand growth. This is reflected in the United States Census Bureau’s Advance Monthly Retail Trade Survey, which reported that grocery store sales rose 2.4 percent year over year in June 2026, underscoring the continued strength of large-scale grocery retail as the leading channel for wellness focused snacking purchases.
Read more about this report - REQUEST FREE SAMPLE COPY IN PDF
By distribution channel, online retail is the fastest growing channel as subscription-based models and direct to consumer platforms make it easier for brands to reach health-conscious consumers beyond traditional retail footprints. Manufacturers are strengthening digital storefronts and third-party marketplace presence to capture rising demand for convenient, direct to home delivery of functional snacking products. Similarly, in April 2026, Booster Juice launched the limited-edition Mood Booster Ball featuring butterscotch, marshmallows, rice crisps, peanut butter, gluten-free oats, and honey, with proceeds supporting community initiatives across Canada.
Europe registers the largest share of the market through established wellness culture and clean label snacking brands
Europe leads the energy balls market owing to its strong wellness culture, established clean label snacking brands, and high consumer awareness of functional nutrition across the United Kingdom, Germany, and France. Manufacturers are expanding organic and clean label product lines while strengthening distribution partnerships with major grocery and specialty retailers to serve health-conscious consumers across the region. This wellness orientation is reflected in the United Kingdom Food Standards Agency’s Food and You 2 survey, published March 2026), which found that 75 percent of respondents had made at least one change to their eating habits for health reasons in the past year, including 49 percent who reduced processed food consumption and 48 percent who cut back on sugary foods and drinks, trends that continue to reinforce demand for clean label, portion controlled snacking formats such as energy balls across the region.
Read more about this report - REQUEST FREE SAMPLE COPY IN PDF
Asia Pacific is the fastest growing regional market, powered by rising health awareness, growing middle class incomes, and expanding modern retail and e-commerce infrastructure across China, India, and Southeast Asia. Brands are localizing flavors and ingredients while forming distribution partnerships with regional retailers to capture rising demand for convenient, protein rich snacking options across the region.
The global industry is becoming innovation driven as major energy balls companies compete through clean label reformulation, portion-controlled formats, and international retail expansion. Manufacturers are strengthening distribution partnerships, broadening functional ingredient portfolios, and pursuing rebranding strategies to capture demand from wellness focused consumers.
Major energy balls market players are focusing on organic certification, indulgent flavor innovation, and digital direct to consumer channels to differentiate their offerings. Manufacturers that combine clean label credibility, international distribution, and continuous product innovation are expected to gain a competitive advantage as demand for functional snacking continues to expand globally.
Founded in 2004 and headquartered in Manchester, United Kingdom, The Hut.com Limited supports the energy balls market through its Boostball brand, offering keto friendly and protein enriched energy ball ranges. The company leverages its wider e-commerce and nutrition retail platform to expand distribution of functional snacking products.
Founded in 2004 and originating in Australia with operations across the United Kingdom, Bounce Brands Limited advances the market through its filled protein energy ball range sold across global grocery and convenience retail channels. The company continues to expand its natural ingredient-based product portfolio internationally.
Founded in 2012 and headquartered in London, United Kingdom, Deliciously Ella Ltd. contributes to the energy balls market through its plant-based energy balls and snack portfolio built on natural, minimally processed ingredients. The company continues to expand internationally, including its 2025 entry into United States retail through Whole Foods Market.
Founded in 2015 and headquartered in the United Kingdom, The Protein Ball Co supports the market with high protein snack balls positioned under its "Ballsy by Nature" identity. The company continues to expand its product range and international distribution across Europe and the United States.
Other key players in the market include Fairnatural GmbH, Just Wholefoods Ltd., Nuttree SARL, DIETE SPORT France (OVERSTIM.s), and Betty Lou's Inc., among others.
*Please note that this is only a partial list; the complete list of key players is available in the full report. Additionally, the list of key players can be customized to better suit your needs.*
Unlock the latest insights with our energy balls market trends 2026 report. Discover regional growth patterns, product innovations, and key industry players. Stay ahead of competition with trusted data and expert analysis. Download your free sample report today and drive informed decisions in the market.


Upto 15% Off
USD
$2499 $2249
$3999 $3599
$4999 $4249
$5999 $5099


*While we strive to always give you current and accurate information, the numbers depicted on the website are indicative and may differ from the actual numbers in the main report. At Expert Market Research, we aim to bring you the latest insights and trends in the market. Using our analyses and forecasts, stakeholders can understand the market dynamics, navigate challenges, and capitalize on opportunities to make data-driven strategic decisions.*
In 2025, the market reached an approximate value of USD 393.29 Million.
The market is projected to grow at a CAGR of 6.50% between 2026 and 2035.
The market is estimated to witness a healthy growth in the forecast period of 2026-2035, reaching a value of around USD 738.26 Million by 2035.
Investing in clean label reformulation, expanding organic and functional product lines, strengthening international retail partnerships, growing direct to consumer and online channels, and innovating portion controlled and indulgent formats.
The key trends of the market include the rising demand for clean labelled energy balls, the inclusion of superfood ingredients in energy balls, the launch of vegan energy ball products, and the implementation of sustainable packaging options.
The major regions in the market are North America, Europe, the Asia Pacific, Latin America, and the Middle East and Africa.
Various distribution channels are hypermarket/supermarket, convenience stores, speciality stores, and online, among others.
The key players in the market are The Hut.com Limited (Boostball), Bounce Brands Limited, Deliciously Ella Ltd, The Protein Ball Co, Fairnatural GmbH, Just Wholefoods Ltd, and Nuttree SARL, DIETE SPORT France (OVERSTIM.s), and Betty Lou's Inc., among others.
Companies face short shelf life of natural ingredients, volatile raw material costs, intense private label competition, evolving clean label regulations, and the need to balance indulgence with functional nutrition claims.
Explore our key highlights of the report and gain a concise overview of key findings, trends, and actionable insights that will empower your strategic decisions.
| REPORT FEATURES | DETAILS |
| Base Year | 2025 |
| Historical Period | 2019-2025 |
| Forecast Period | 2026-2035 |
| Scope of the Report |
Historical and Forecast Trends, Industry Drivers and Constraints, Historical and Forecast Market Analysis by Segment:
|
| Breakup by Ingredient |
|
| Breakup by Nature |
|
| Breakup by Distribution Channel |
|
| Breakup by Region |
|
| Market Dynamics |
|
| Competitive Landscape |
|
| Companies Covered |
|
Datasheet
One User
USD 2,499
USD 2,249
tax inclusive*
Single User License
One User
USD 3,999
USD 3,599
tax inclusive*
Five User License
Five User
USD 4,999
USD 4,249
tax inclusive*
Corporate License
Unlimited Users
USD 5,999
USD 5,099
tax inclusive*
*Please note that the prices mentioned below are starting prices for each bundle type. Kindly contact our team for further details.*
Flash Bundle
Small Business Bundle
Growth Bundle
Enterprise Bundle
*Please note that the prices mentioned below are starting prices for each bundle type. Kindly contact our team for further details.*
Flash Bundle
Number of Reports: 3
20%
tax inclusive*
Small Business Bundle
Number of Reports: 5
25%
tax inclusive*
Growth Bundle
Number of Reports: 8
30%
tax inclusive*
Enterprise Bundle
Number of Reports: 10
35%
tax inclusive*
How To Order

Select License Type
Choose the right license for your needs and access rights.

Click on ‘Buy Now’
Add the report to your cart with one click and proceed to register.

Select Mode of Payment
Choose a payment option for a secure checkout. You will be redirected accordingly.
Strategic Solutions for Informed Decision-Making
Gain insights to stay ahead and seize opportunities.

Get insights & trends for a competitive edge.

Track prices with detailed trend reports.

Analyse trade data for supply chain insights.

Leverage cost reports for smart savings

Enhance supply chain with partnerships.

Connect For More Information
Our expert team of analysts will offer full support and resolve any queries regarding the report, before and after the purchase.
Our expert team of analysts will offer full support and resolve any queries regarding the report, before and after the purchase.
We employ meticulous research methods, blending advanced analytics and expert insights to deliver accurate, actionable industry intelligence, staying ahead of competitors.
Our skilled analysts offer unparalleled competitive advantage with detailed insights on current and emerging markets, ensuring your strategic edge.
We offer an in-depth yet simplified presentation of industry insights and analysis to meet your specific requirements effectively.




