

Consumer Insights
Uncover trends and behaviors shaping consumer choices today
Procurement Insights
Optimize your sourcing strategy with key market data
Industry Stats
Stay ahead with the latest trends and market analysis.
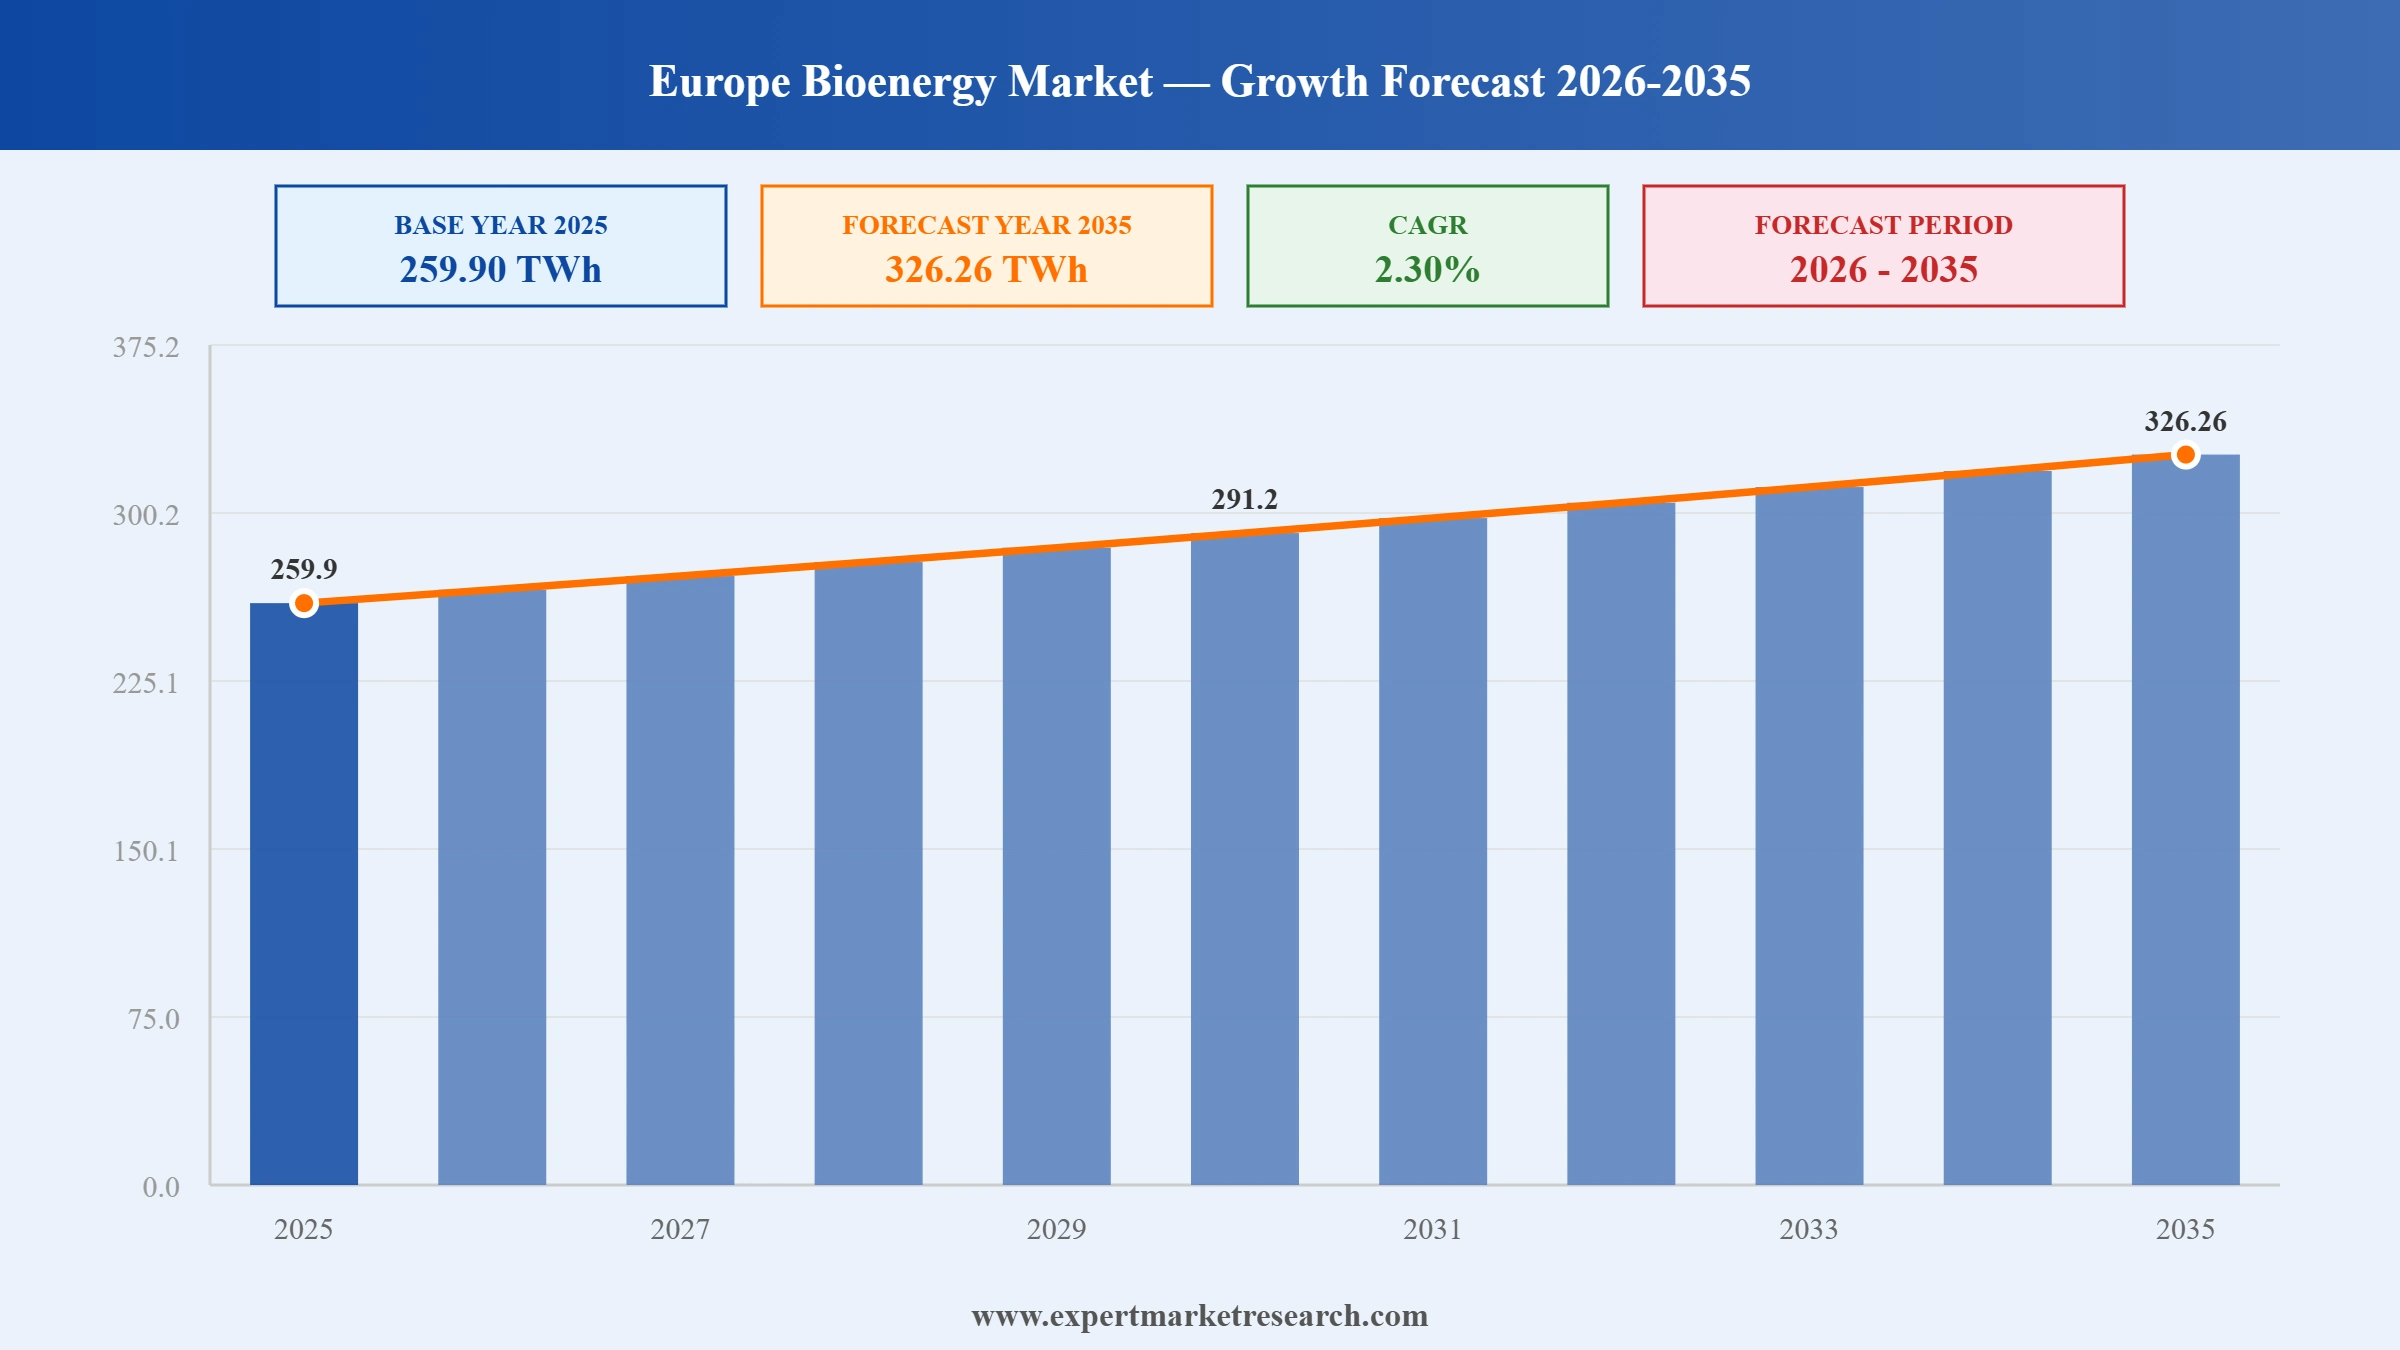
The Europe bioenergy market reached around 259.90 TWh in 2025. The market is projected to grow at a CAGR of 2.30% between 2026 and 2035, reaching almost 326.26 TWh by 2035.
In 2023, bioenergy accounted for 58% of renewable energy use in Europe.
The EU’s decision to use 42.5% renewable energy by 2030 for electricity generation is expected to boost the market growth.
By 2030, the EU’s domestic biomethane production capabilities are expected to reach 35 billion metres cube.
Read more about this report - REQUEST FREE SAMPLE COPY IN PDF
| Europe Bioenergy Market Report Summary | Description | Value |
| Base Year | TWh | 2025 |
| Historical Period | TWh | 2019-2025 |
| Forecast Period | TWh | 2026-2035 |
| Market Size 2025 | TWh | 259.90 |
| Market Size 2035 | TWh | 326.26 |
| CAGR 2019-2025 | Percentage | XX% |
| CAGR 2026-2035 | Percentage | 2.30% |
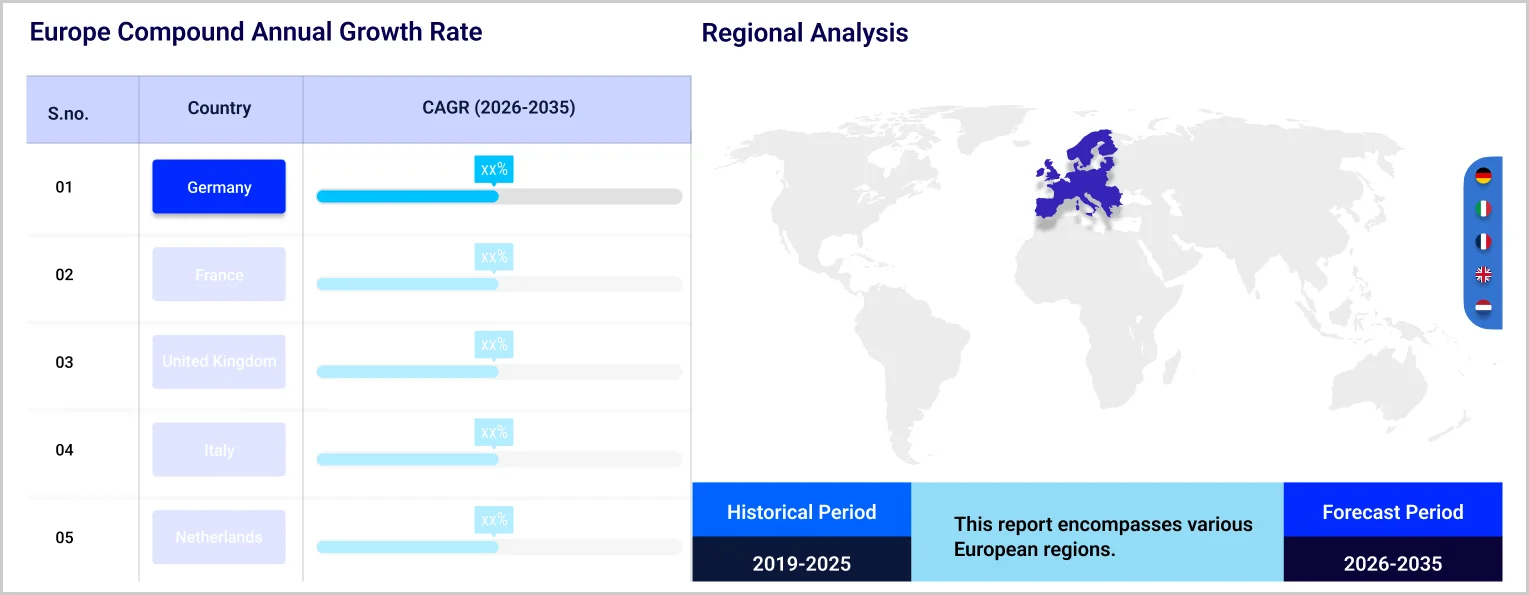
| CAGR 2026-2035 - Market by Region | Germany | 2.6% |
| CAGR 2026-2035 - Market by Region | France | 2.2% |
| CAGR 2026-2035 - Market by Type | Solid Biomass | 2.8% |
| CAGR 2026-2035 - Market by Technology | Gasification | 2.6% |
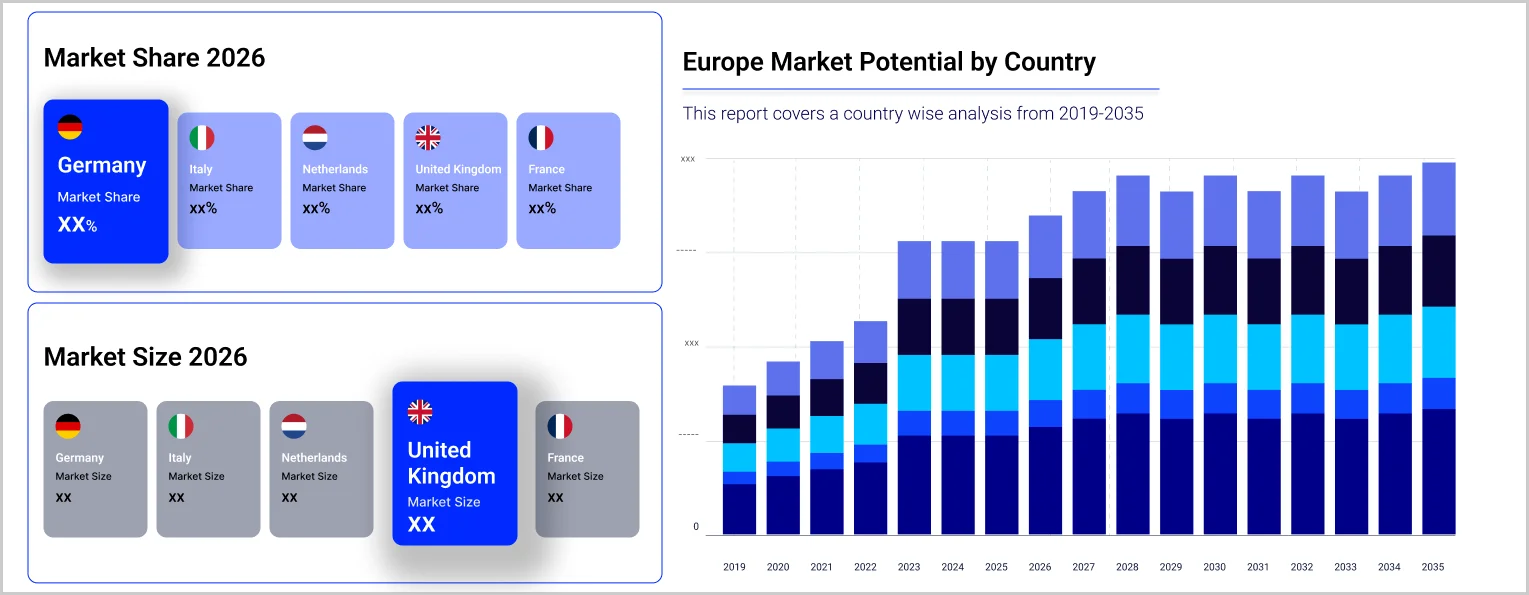
| Market Share by Region | United Kingdom | 16.8% |
In Europe, primary solid biofuels account for 70.3% of the overall bioenergy production. This is followed by liquid biofuels at 12.9%, biogas at 10.1%, and renewable portions of municipal waste at 6.6%.
In 2021, indigenous biogas production recorded a year-on-year increase of 1.7%, reaching 14.9 MTOE. Germany accounted for 50.4% of the overall production, reaching 7.5 MTOE, which made it the leading biomethane producer. Italy (3.9%), and France (9.4%), followed it at 2.1 MTOE and 1.4 MTOE, respectively.
The supply of solid biomass for bioenergy production mainly comprises forest biomass at over 60%, followed by biomass obtained from organic waste materials (26%), and agricultural biomass at 8%, sourced notably from Finland and Sweden. The supply of solid biomass in Europe has recorded a surge of 33.5% between 2008 and 2021, reaching 4,454,768 TJ.
The consumption of biofuels in Europe has risen by 39% between 2013 and 2021. In 2021, the transportation sector consumed 16.5 MTOE of biofuel, with biodiesel emerging as the most popular fuel. Bioethanol and biomethane (among other liquid biofuels) accounted for 18% and less than 1% of total biofuel consumption, respectively.
In 2021, bioenergy was used to produce 17.3 MTOE of heat energy in Europe, primarily by using solid biomass (at over 70%), renewable portions of municipal waste (at over 18%), and biogas (at 5.0%).
Europe Bioenergy Market Report and Forecast 2026-2035 offers a detailed analysis of the market based on the following segments:
Market Breakup by Type
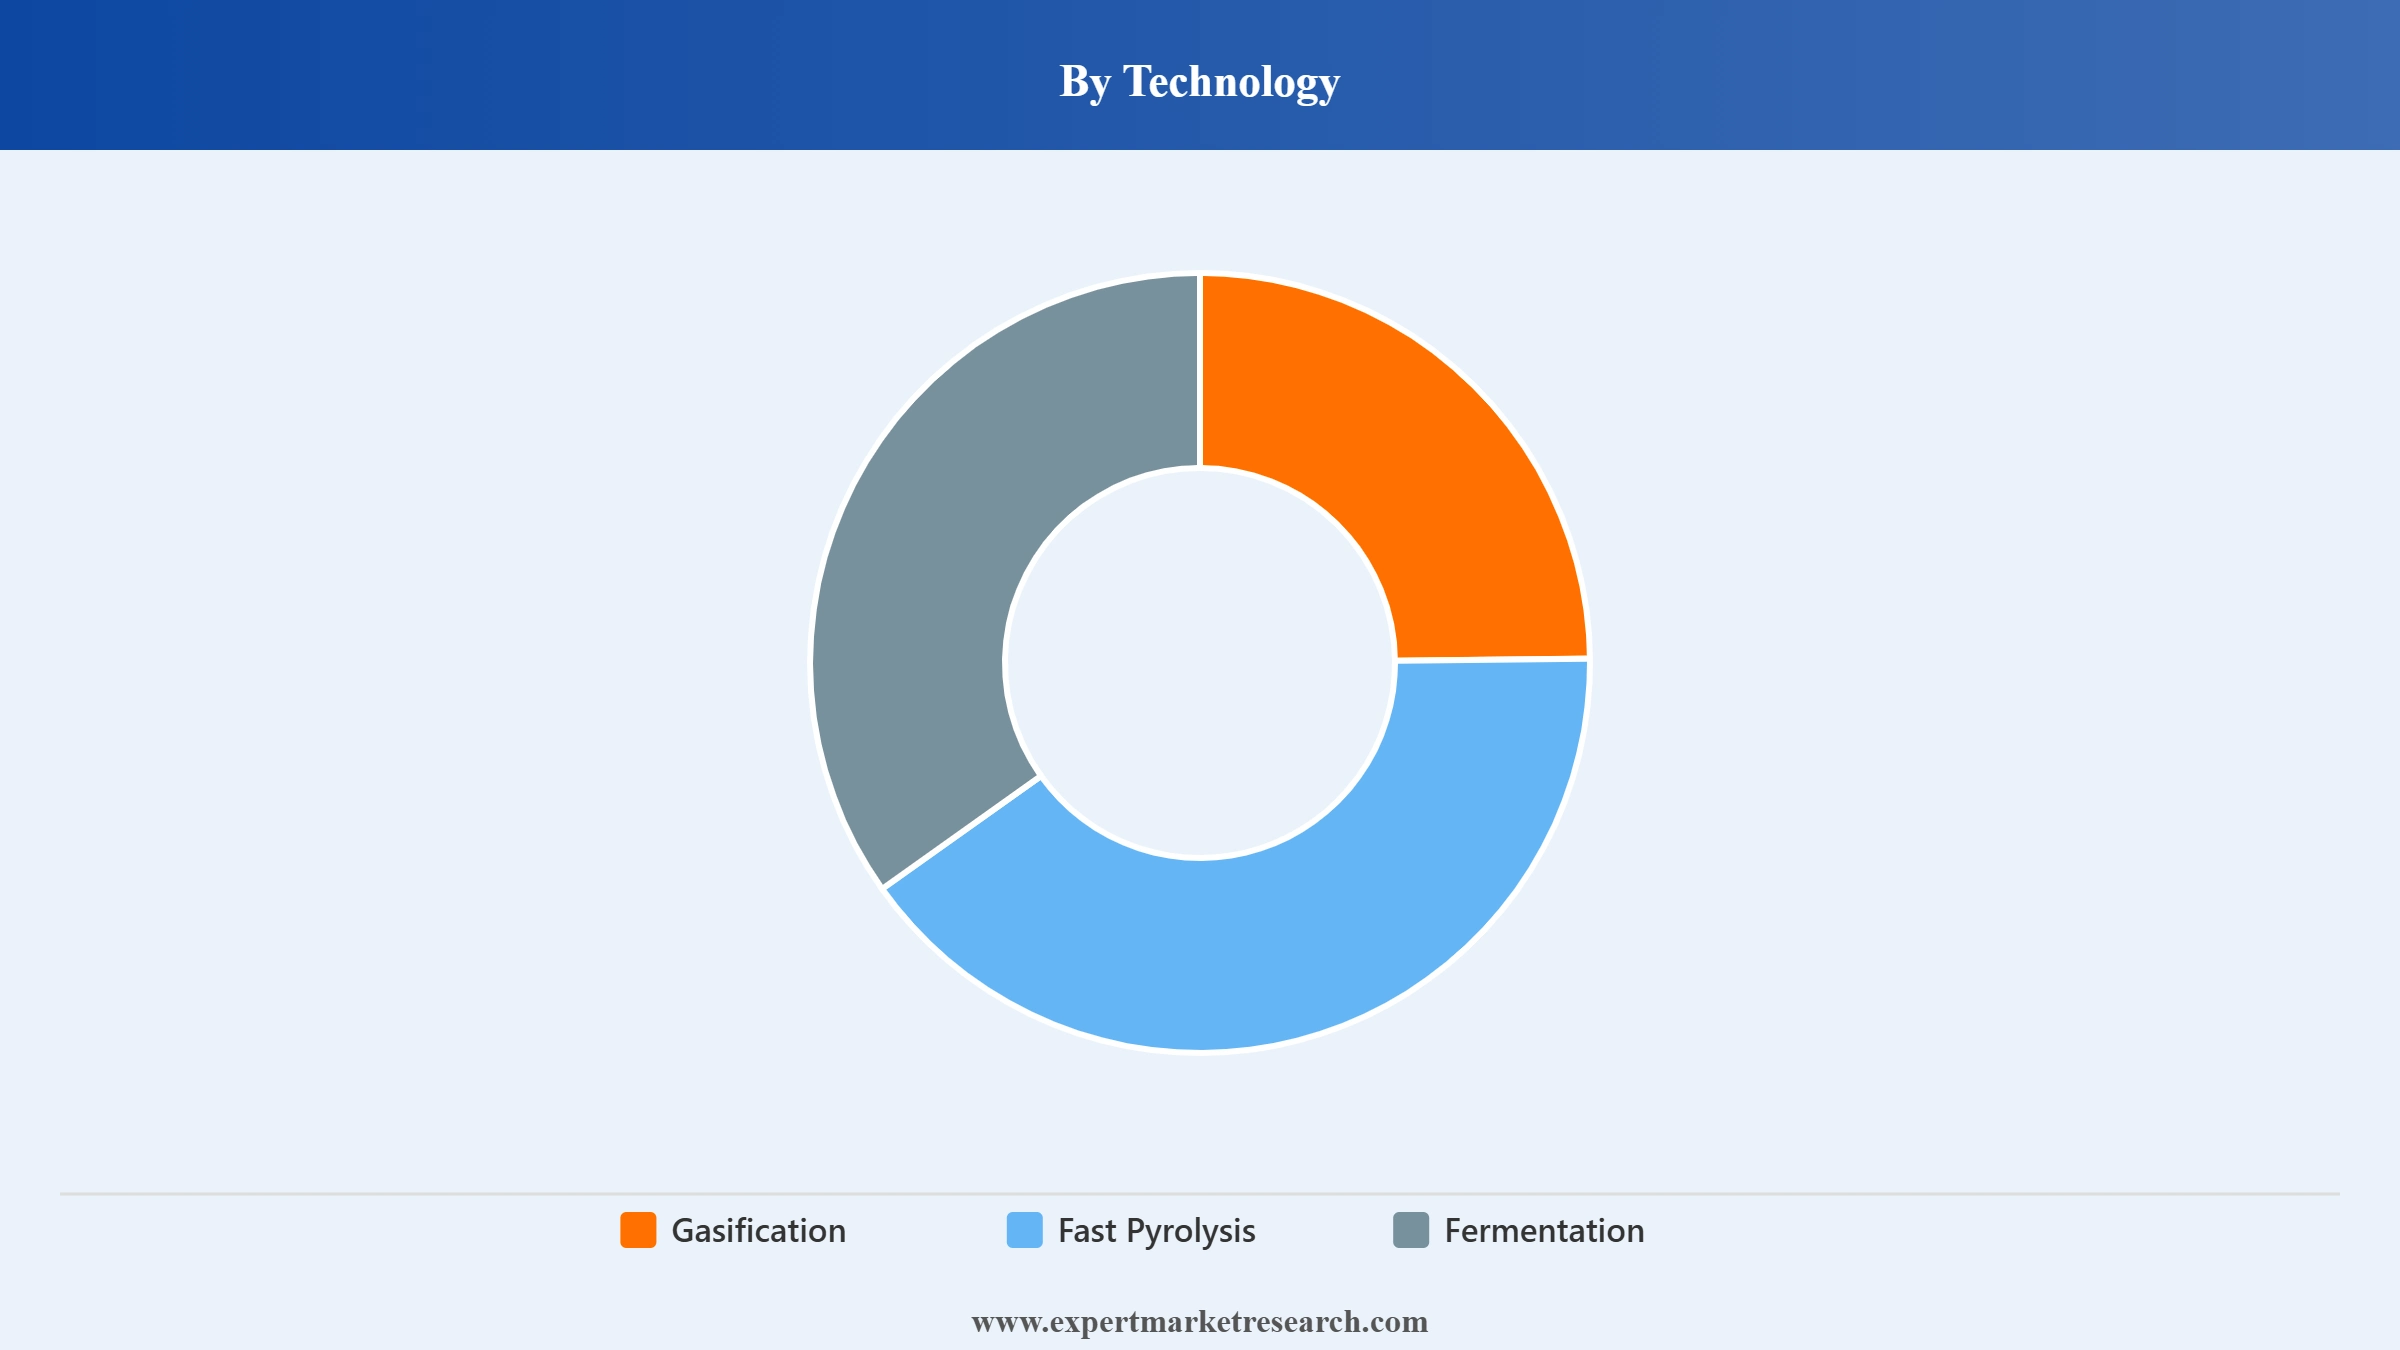
Market Breakup by Technology
Market Breakup by Region
Read more about this report - REQUEST FREE SAMPLE COPY IN PDF
Based on technology, the market is divided into gasification, fast pyrolysis, and fermentation, among others. Over the forecast period, fermentation is estimated to grow at a CAGR of 2.4% as it involves the usage of various microorganisms to break down waste under anaerobic conditions to produce biofuels in a sustainable manner.
Read more about this report - REQUEST FREE SAMPLE COPY IN PDF
Major market players are expected to develop new facilities for manufacturing biofuels and biogas from organic and agricultural waste.
Upto 15% Off
USD
$2499 $2249
$3999 $3599
$4999 $4249
$5999 $5099


*While we strive to always give you current and accurate information, the numbers depicted on the website are indicative and may differ from the actual numbers in the main report. At Expert Market Research, we aim to bring you the latest insights and trends in the market. Using our analyses and forecasts, stakeholders can understand the market dynamics, navigate challenges, and capitalize on opportunities to make data-driven strategic decisions.*
The market was valued at nearly 259.90 TWh in 2025.
The market is projected to grow at a CAGR of 2.30% between 2026 and 2035.
The market is assessed to witness a healthy growth in the forecast period to reach around 326.26 TWh in 2035.
The different technologies for obtaining bioenergy in the market include gasification, fast pyrolysis, and fermentation, among others.
The major types of bioenergy considered in the market report include solid biomass, biogas, and renewable waste, among others.
The major countries covered in the market are Germany, the United Kingdom, France, and Italy, among others.
The key market players are TotalEnergies S.A., Ørsted A/S, Fulcrum BioEnergy, Inc., Novonesis, Enviva Inc., EnviTec Biogas AG, Drax Group plc, Ameresco, Inc., Archer Daniels Midland Company, and Babcock & Wilcox Enterprises, Inc. among others.
Explore our key highlights of the report and gain a concise overview of key findings, trends, and actionable insights that will empower your strategic decisions.
| REPORT FEATURES | DETAILS |
| Base Year | 2025 |
| Historical Period | 2019-2025 |
| Forecast Period | 2026-2035 |
| Scope of the Report |
Historical and Forecast Trends, Industry Drivers and Constraints, Historical and Forecast Market Analysis by Segment:
|
| Breakup by Type |
|
| Breakup by Technology |
|
| Breakup by Region |
|
| Market Dynamics |
|
| Competitive Landscape |
|
| Companies Covered |
|
Datasheet
One User
USD 2,499
USD 2,249
tax inclusive*
Single User License
One User
USD 3,999
USD 3,599
tax inclusive*
Five User License
Five User
USD 4,999
USD 4,249
tax inclusive*
Corporate License
Unlimited Users
USD 5,999
USD 5,099
tax inclusive*
*Please note that the prices mentioned below are starting prices for each bundle type. Kindly contact our team for further details.*
Flash Bundle
Small Business Bundle
Growth Bundle
Enterprise Bundle
*Please note that the prices mentioned below are starting prices for each bundle type. Kindly contact our team for further details.*
Flash Bundle
Number of Reports: 3
20%
tax inclusive*
Small Business Bundle
Number of Reports: 5
25%
tax inclusive*
Growth Bundle
Number of Reports: 8
30%
tax inclusive*
Enterprise Bundle
Number of Reports: 10
35%
tax inclusive*
How To Order

Select License Type
Choose the right license for your needs and access rights.

Click on ‘Buy Now’
Add the report to your cart with one click and proceed to register.

Select Mode of Payment
Choose a payment option for a secure checkout. You will be redirected accordingly.
Strategic Solutions for Informed Decision-Making
Gain insights to stay ahead and seize opportunities.

Get insights & trends for a competitive edge.

Track prices with detailed trend reports.

Analyse trade data for supply chain insights.

Leverage cost reports for smart savings

Enhance supply chain with partnerships.

Connect For More Information
Our expert team of analysts will offer full support and resolve any queries regarding the report, before and after the purchase.
Our expert team of analysts will offer full support and resolve any queries regarding the report, before and after the purchase.
We employ meticulous research methods, blending advanced analytics and expert insights to deliver accurate, actionable industry intelligence, staying ahead of competitors.
Our skilled analysts offer unparalleled competitive advantage with detailed insights on current and emerging markets, ensuring your strategic edge.
We offer an in-depth yet simplified presentation of industry insights and analysis to meet your specific requirements effectively.


