

Consumer Insights
Uncover trends and behaviors shaping consumer choices today
Procurement Insights
Optimize your sourcing strategy with key market data
Industry Stats
Stay ahead with the latest trends and market analysis.
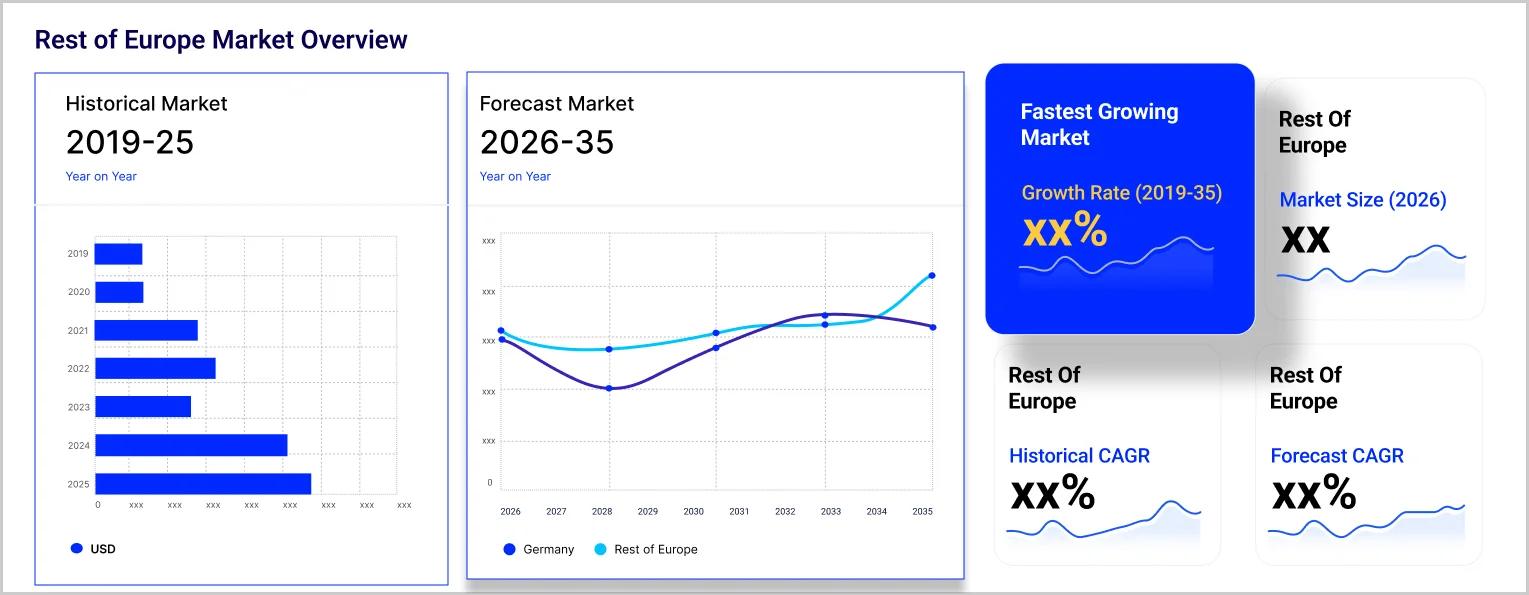
The Europe biostimulants market value reached approximately USD 2.01 Billion in 2025. The market is projected to grow at a CAGR of 8.40% between 2026 and 2035, reaching a value of around USD 4.50 Billion by 2035.
Compound Annual Growth Rate
8.4%
Value in USD Billion
2026-2035
Read more about this report - Request a Free Sample
| Europe Biostimulants Market Report Summary | Description | Value |
| Base Year | USD Billion | 2025 |
| Historical Period | USD Billion | 2019-2025 |
| Forecast Period | USD Billion | 2026-2035 |
| Market Size 2025 | USD Billion | 2.01 |
| Market Size 2035 | USD Billion | 4.50 |
| CAGR 2019-2025 | Percentage | XX% |
| CAGR 2026-2035 | Percentage | 8.40% |
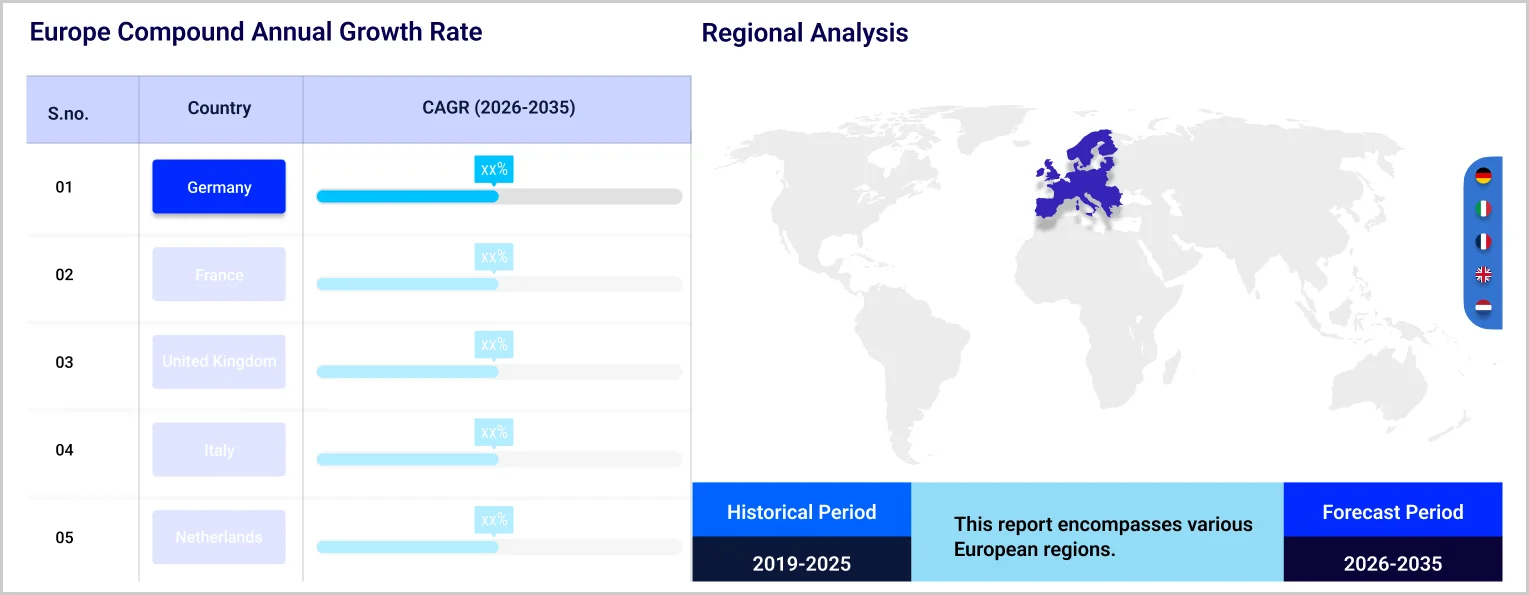
| CAGR 2026-2035 - Market by Region | United Kingdom | 8.8% |
| CAGR 2026-2035 - Market by Form | Liquid | 8.7% |
| CAGR 2026-2035 - Market by Application | Foliar Treatment | 9.0% |
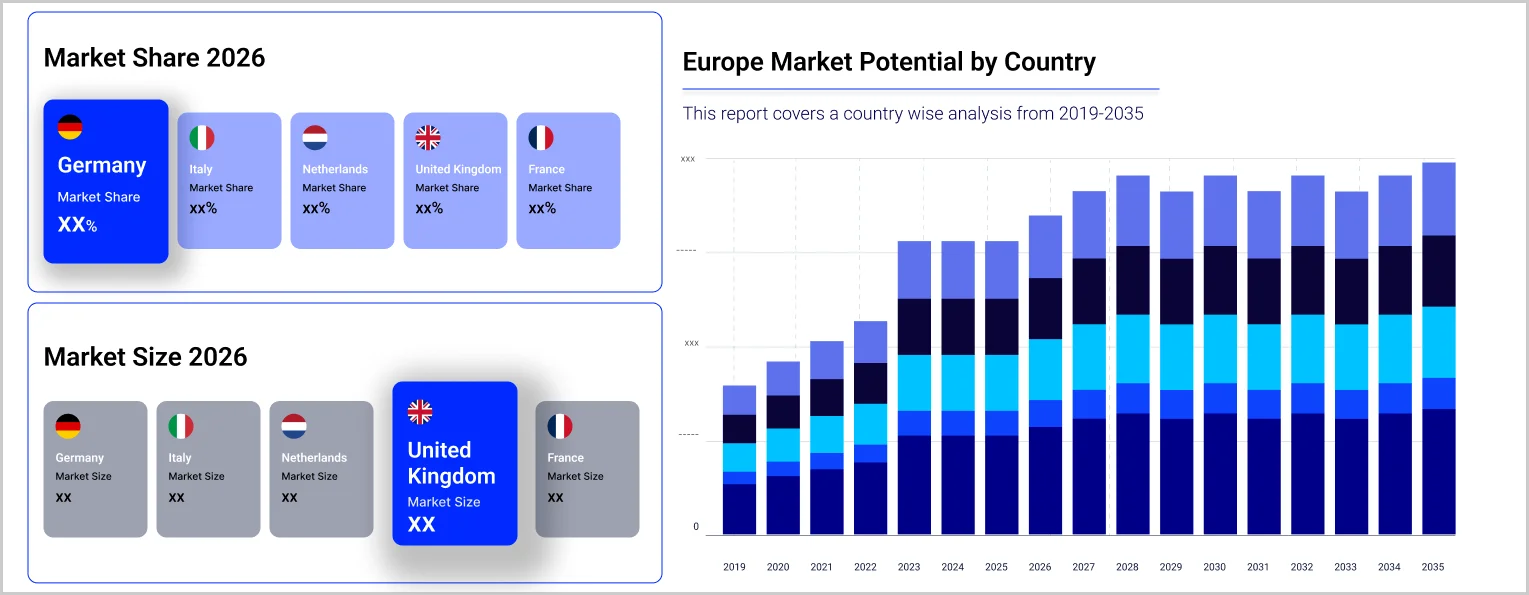
| Market Share by Country 2025 | Italy | 9.9% |
Biostimulants have become a crucial component of organic farming methods in Europe, primarily driven by the growing consumer demand for organic and sustainably sourced food.
In Europe, increasing collaboration among agribusinesses, regulators, and scientists is boosting awareness of biostimulants, enhancing application techniques, and promoting organic farming practices, which is further driving demand of the Europe biostimulants market.
The Europe biostimulants industry growth can be attributed to the increasing adoption of organic farming systems in the region, as farmers seek alternatives to traditional chemical fertilisers and pesticides. The market is also benefiting from advancements in biotechnology and microbiology, which have led to the development of more effective and targeted plant protection compounds such as biostimulants.
According to The Research Institute of Organic Agriculture FiBL, by the end of 2021, Europe had 17.8 million hectares of agricultural land managed organically, up from 17.0 million hectares in 2020, and cultivated by 442,274 producers. Organic farming accounted for 3.6 per cent of the total agricultural area in Europe. The countries with the largest organic agricultural areas were France, with 2.8 million hectares, Spain with 2.6 million hectares, and Italy with 2.2 million hectares. In 2021, organic grape cultivation in Europe spanned 435,216 hectares, significantly boosting the Europe biostimulants industry revenue. Biostimulants enhance crops' ability to endure environmental challenges like drought, extreme temperatures, and pests, thereby improving yield and quality.
Europe's organic retail sales reached USD 58.99 billion, with a per capita spending of USD 72.15. The market has noticed a growth rate of 3.8% from 2020 to 2021 as per The Research Institute of Organic Agriculture FiBL.
According to the United Kingdom Government, the production of field vegetables has been estimated to be around 2.1 million tonnes in 2022.
Further, according to the Department for Environment Food and Rural Areas, in the United Kingdom, in 2023, the total organic area is 497.9 thousand hectares out of the total agricultural holdings of 17,140 thousand hectares as of June, indicating the organic area accounts for 2.9% of the total agricultural area in the UK.
In 2021, Germany had nearly 36,000 organic farms cultivating over 4.3 million acres of land, according to BÖLW – the German organic industry association. Germany holds the position of the second-largest organic food market in the world, following the United States. Sales of organic food products in Germany have been rising consistently, reaching a record high of nearly USD 18.85 billion in 2021, which has bolstered the Europe biostimulants market revenue. Biostimulants support organic farming principles by promoting plant growth through natural processes, fostering a more sustainable and eco-friendly agricultural system.
Read more about this report - Request a Free Sample
“Europe Biostimulants Market Report and Forecast 2026-2035” offers a detailed analysis of the market based on the following segments:
Market Breakup by Crop Type
Market Breakup by Form
Market Breakup by Active Ingredient
Market Breakup by Application
Market Breakup by Region
| CAGR 2026-2035 - Market by | Region |
| United Kingdom | 8.8% |
| Germany | XX% |
| France | XX% |
| Italy | 8.1% |
| Others | XX% |
Europe holds a significant share of the global biostimulants market, accounting for nearly 40% of global sales. According to industry reports, nearly half of the market value is generated from row crops, which include cereals, fibre crops, oilseeds, and pulses. Fruits and vegetables represent approximately one-third of the biostimulant usage, with turf and ornamentals making up over 10%, further fueling the growth of the Europe biostimulants industry.
Moreover, there is a growing demand for sustainable farming methods in Europe, as farmers and consumers alike are becoming increasingly aware of the environmental impact of conventional agricultural practices. Biostimulants offer a more sustainable alternative by promoting plant growth and health without relying heavily on synthetic chemicals or fertilisers, consequently driving up the growth of the Europe biostimulants market.
The market players are focusing on research and development to enhance the efficacy of agricultural products like plant protection compounds and fertilisers.
Upto 15% Off
USD
$2499 $2249
$3999 $3599
$4999 $4249
$5999 $5099


*While we strive to always give you current and accurate information, the numbers depicted on the website are indicative and may differ from the actual numbers in the main report. At Expert Market Research, we aim to bring you the latest insights and trends in the market. Using our analyses and forecasts, stakeholders can understand the market dynamics, navigate challenges, and capitalize on opportunities to make data-driven strategic decisions.*
In 2025, the market reached an approximate value of USD 2.01 Billion.
The market is projected to grow at a CAGR of 8.40% between 2026 and 2035.
The market is estimated to witness healthy growth in the forecast period of 2026-2035 to reach USD 4.50 Billion by 2035.
The market is driven by the growth of the agriculture sector, increasing application of biostimulants, and rising awareness regarding its benefits over synthetic agricultural products.
The key trends aiding the market expansion include the growing demand for sustainably produced food and stringent government regulations supporting organic farming.
The major crop types are row crops, fruits and vegetables, and turf and ornamentals, among others.
The market is categorised according to its form, which includes liquid and dry.
The competitive landscape consists of FMC Corporation, Corteva Agriscience, UPL Ltd., Syngenta Crop Protection AG, Novozymes A/S, Haifa Negev Technologies Ltd., Biovert S.L.U., ILSA S.p.A., Bionema Group Limited, AXEB BIOTECH SL, and AGRITECNO FERTILIZANTES, among others.
The market is broken down into New England, Mideast, Great Lakes, Plains, Southeast, Southwest, Rocky Mountain, and Far West.
Explore our key highlights of the report and gain a concise overview of key findings, trends, and actionable insights that will empower your strategic decisions.
| REPORT FEATURES | DETAILS |
| Base Year | 2025 |
| Historical Period | 2019-2025 |
| Forecast Period | 2026-2035 |
| Scope of the Report |
Historical and Forecast Trends, Industry Drivers and Constraints, Historical and Forecast Market Analysis by Segment:
|
| Breakup by Crop Type |
|
| Breakup by Form |
|
| Breakup by Active Ingredient |
|
| Breakup by Application |
|
| Breakup by Country |
|
| Market Dynamics |
|
| Competitive Landscape |
|
| Companies Covered |
|
Datasheet
One User
USD 2,499
USD 2,249
tax inclusive*
Single User License
One User
USD 3,999
USD 3,599
tax inclusive*
Five User License
Five User
USD 4,999
USD 4,249
tax inclusive*
Corporate License
Unlimited Users
USD 5,999
USD 5,099
tax inclusive*
*Please note that the prices mentioned below are starting prices for each bundle type. Kindly contact our team for further details.*
Flash Bundle
Small Business Bundle
Growth Bundle
Enterprise Bundle
*Please note that the prices mentioned below are starting prices for each bundle type. Kindly contact our team for further details.*
Flash Bundle
Number of Reports: 3
20%
tax inclusive*
Small Business Bundle
Number of Reports: 5
25%
tax inclusive*
Growth Bundle
Number of Reports: 8
30%
tax inclusive*
Enterprise Bundle
Number of Reports: 10
35%
tax inclusive*
How To Order

Select License Type
Choose the right license for your needs and access rights.

Click on ‘Buy Now’
Add the report to your cart with one click and proceed to register.

Select Mode of Payment
Choose a payment option for a secure checkout. You will be redirected accordingly.
Strategic Solutions for Informed Decision-Making
Gain insights to stay ahead and seize opportunities.

Get insights & trends for a competitive edge.

Track prices with detailed trend reports.

Analyse trade data for supply chain insights.

Leverage cost reports for smart savings

Enhance supply chain with partnerships.

Connect For More Information
Our expert team of analysts will offer full support and resolve any queries regarding the report, before and after the purchase.
Our expert team of analysts will offer full support and resolve any queries regarding the report, before and after the purchase.
We employ meticulous research methods, blending advanced analytics and expert insights to deliver accurate, actionable industry intelligence, staying ahead of competitors.
Our skilled analysts offer unparalleled competitive advantage with detailed insights on current and emerging markets, ensuring your strategic edge.
We offer an in-depth yet simplified presentation of industry insights and analysis to meet your specific requirements effectively.


