

Consumer Insights
Uncover trends and behaviors shaping consumer choices today
Procurement Insights
Optimize your sourcing strategy with key market data
Industry Stats
Stay ahead with the latest trends and market analysis.
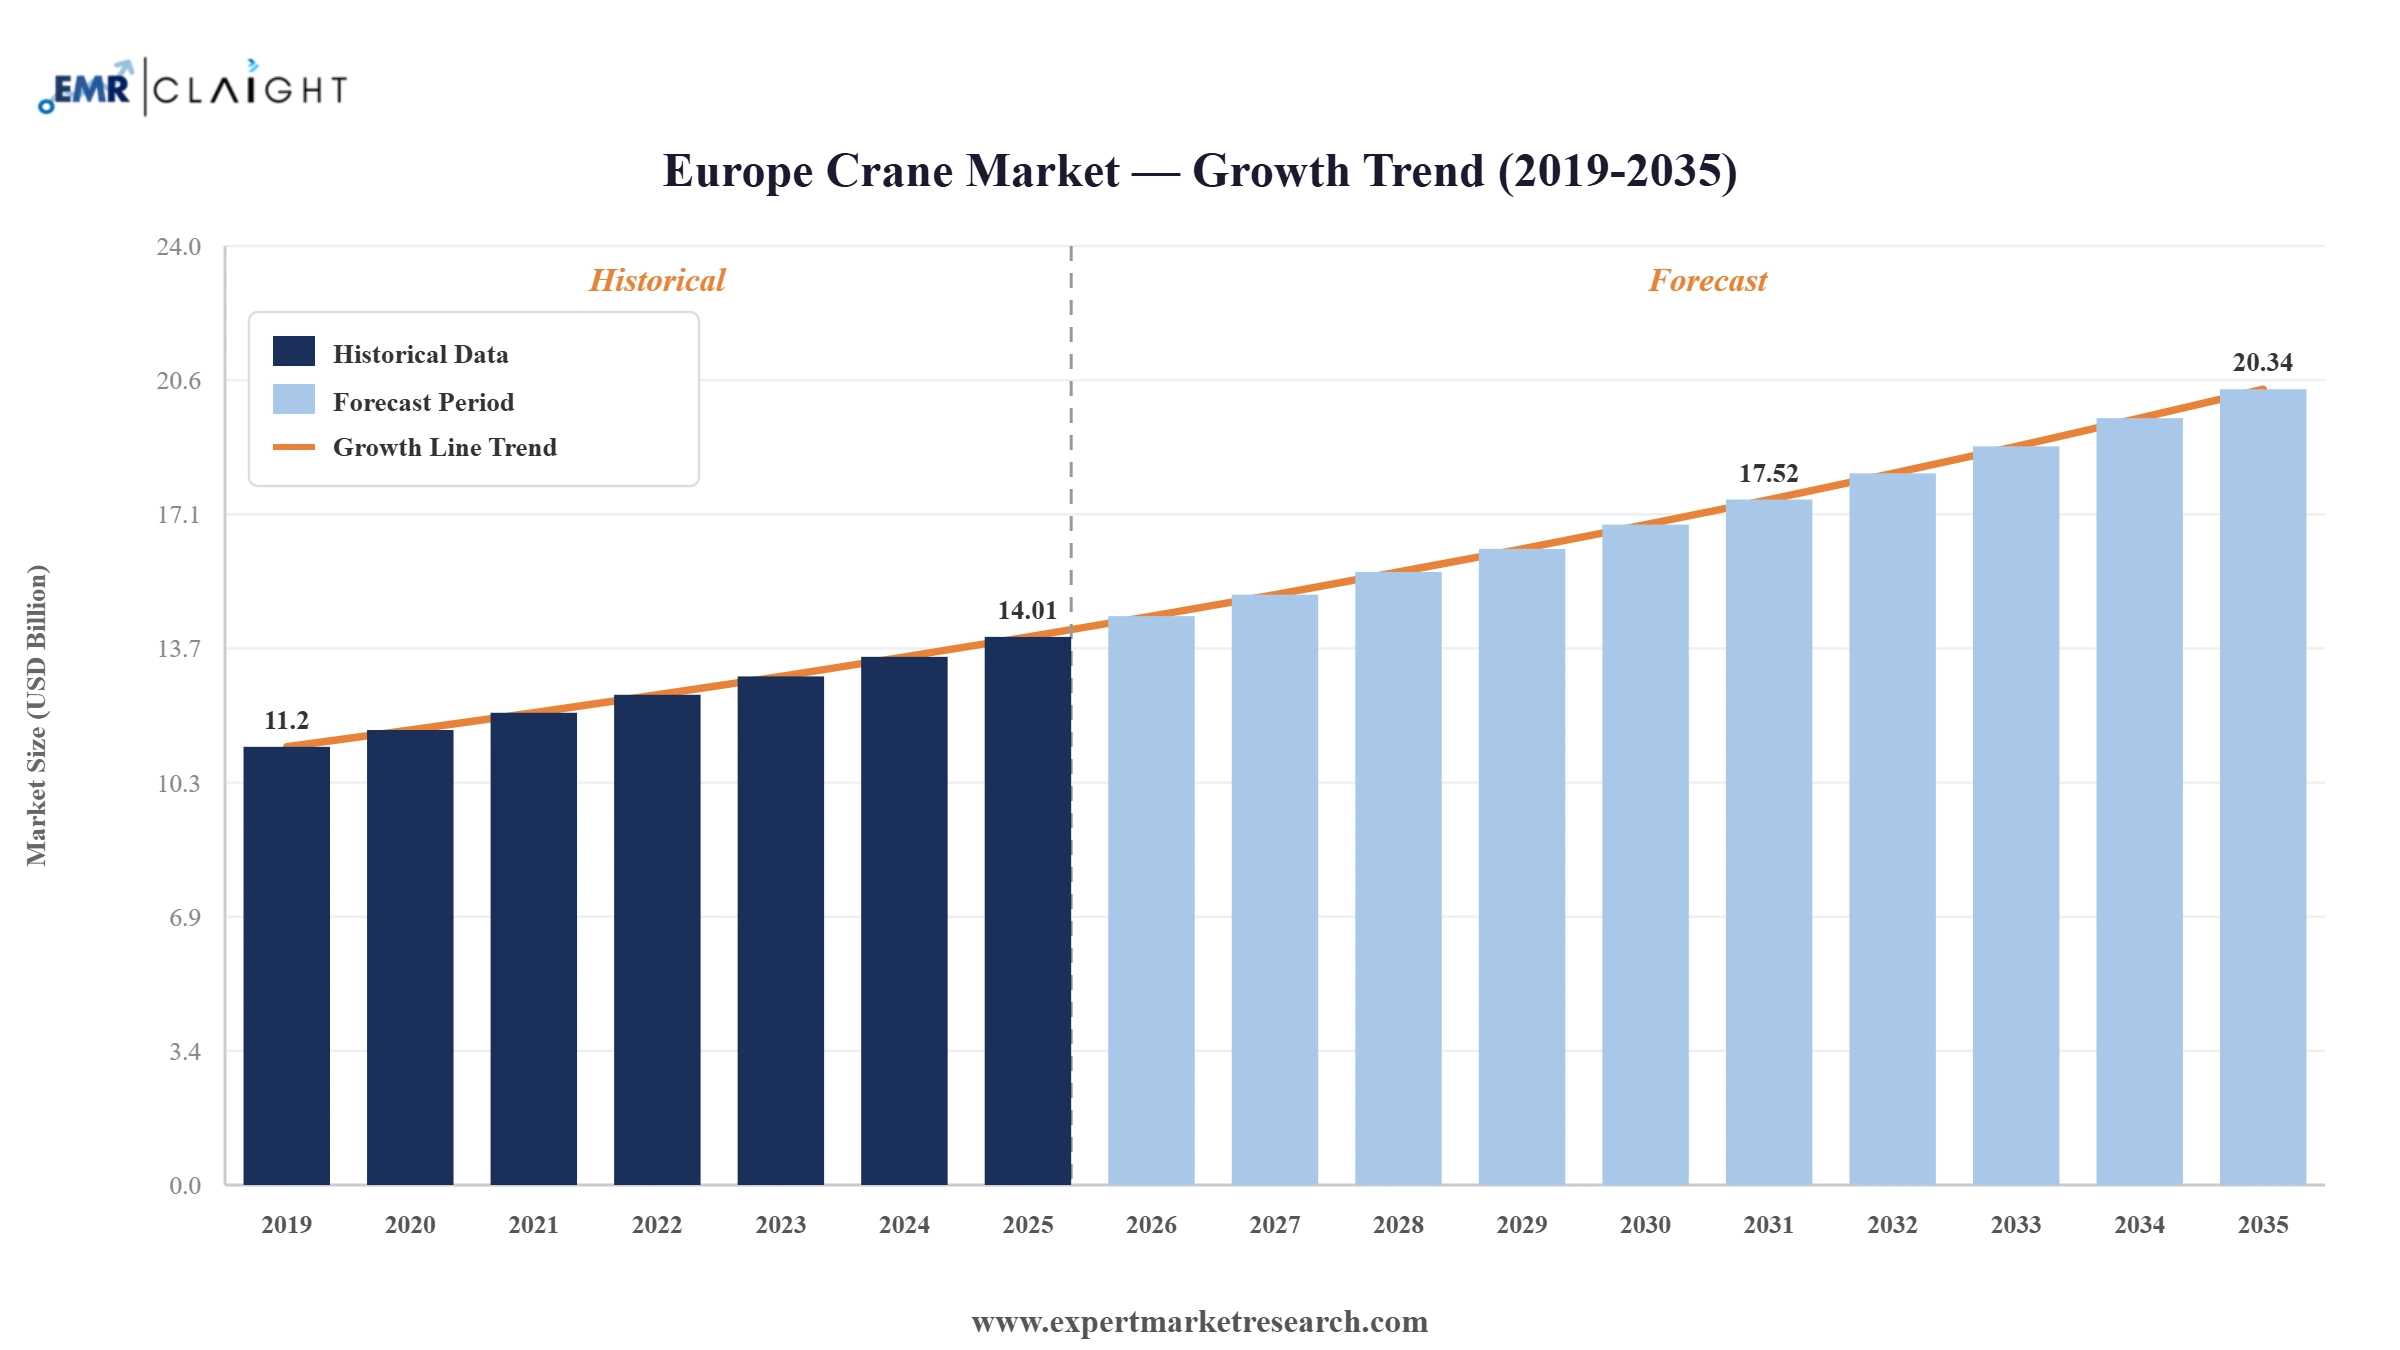
The Europe crane market reached a value of USD 14.01 Billion in 2025 and is projected to expand at a CAGR of around 3.80% through 2026-2035. Large-scale infrastructure investment across Germany, Italy, and the United Kingdom, accelerating offshore wind energy installation requiring specialised heavy-lift equipment, and growing adoption of electric and automated crane systems are keeping market momentum steady. The market is on track to reach USD 20.34 Billion by 2035. Sustained construction activity, port modernisation programmes, and the electrification transition across crane fleets are driving the Europe crane market.
Read more about this report - REQUEST FREE SAMPLE COPY IN PDF
| Europe Crane Market Report Summary | Description | Value |
| Base Year | USD Billion | 2025 |
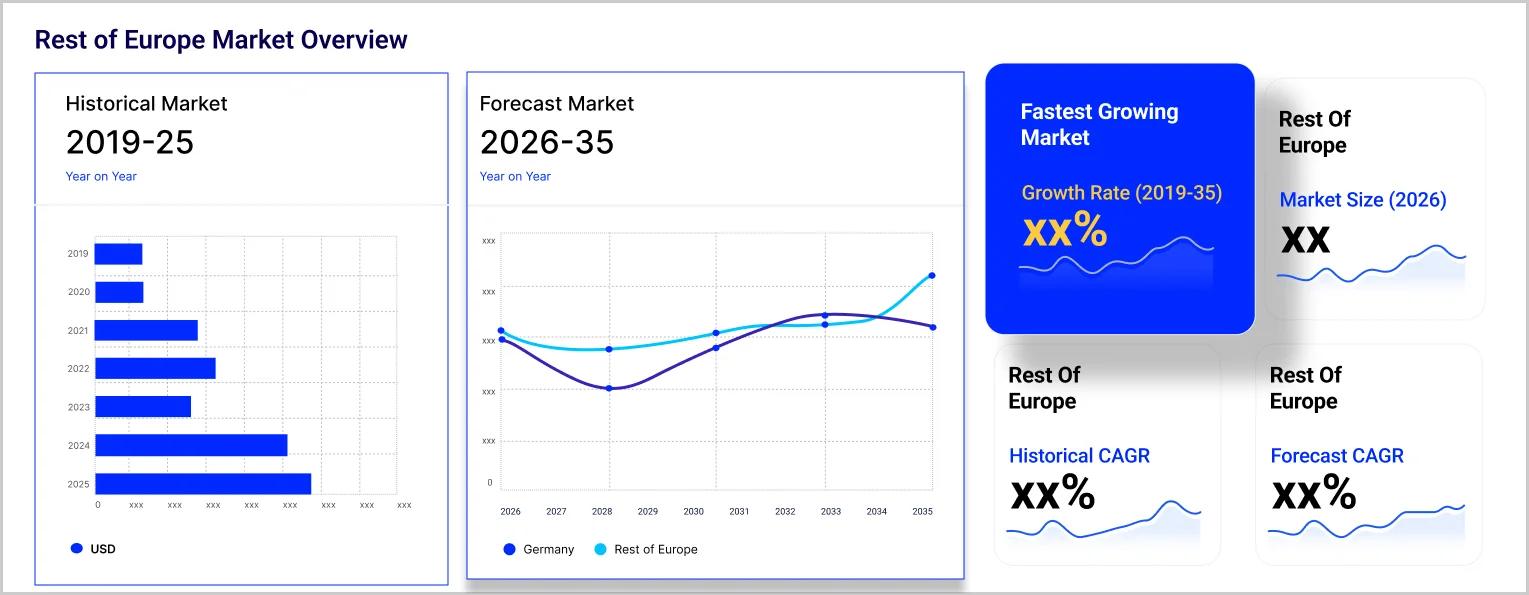
| Historical Period | USD Billion | 2019-2025 |
| Forecast Period | USD Billion | 2026-2035 |
| Market Size 2025 | USD Billion | 14.01 |
| Market Size 2035 | USD Billion | 20.34 |
| CAGR 2019-2025 | Percentage | XX% |
| CAGR 2026-2035 | Percentage | 3.80% |
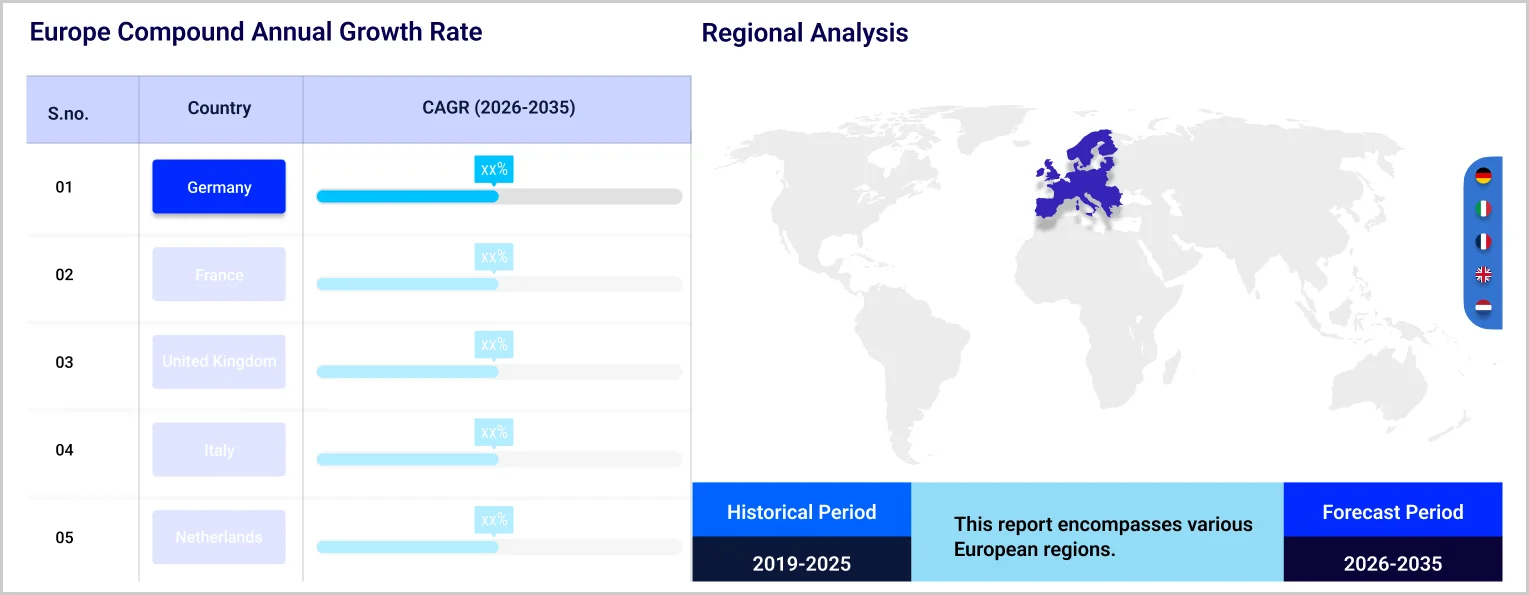
| CAGR 2026-2035 - Market by Country | United Kingdom | 4.3% |
| CAGR 2026-2035 - Market by Country | Germany | 4.0% |
| CAGR 2026-2035 - Market by Mobility | Mobile | 4.1% |
| CAGR 2026-2035 - Market by Type | Tower Crane | 4.3% |
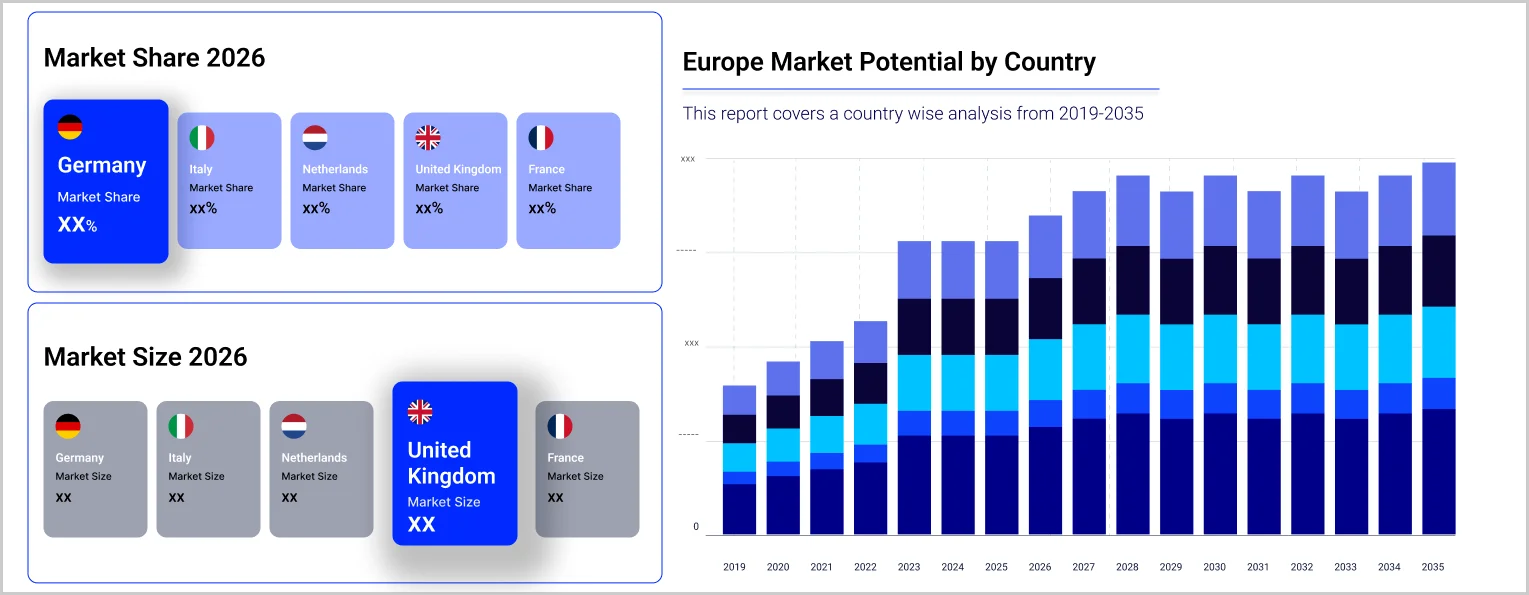
| 2025 Market Share by Country | United Kingdom | 14.2% |
The Europe crane market is undergoing a technology-driven transformation. Decarbonisation mandates, offshore wind expansion, and infrastructure modernisation are reshaping equipment demand. Manufacturers are accelerating investment in electric drivetrains and automation, while aftermarket service networks are growing strategically as operators seek to reduce lifecycle costs.
Palfinger secured a contract in May 2026 to supply davit cranes for five North Sea HVDC platforms, with production beginning in H1 2026. The contract follows 42 davit crane orders for offshore substations in 2025. The contract represents Palfinger's third major offshore substation programme for TenneT, cementing its position as a leading supplier to Europe's offshore wind infrastructure buildout.
Konecranes secured the first battery-electric RTG crane order in Europe in November 2025, with HHLA TK Estonia ordering two units for the Port of Muuga. The 296 kWh battery system enables up to eight hours of independent operation, with delivery scheduled for Q4 2026, marking a milestone in European port crane electrification.
Konecranes announced its E-Hybrid RTG crane and electric empty container handler at TOC Europe in Rotterdam in June 2025, advancing its goal of a fully electric port equipment portfolio by 2026. The E-Hybrid RTG combines onboard battery and busbar electric supply, addressing operational risk for terminals unable to immediately eliminate diesel backup power.
Italy confirmed in April 2025 a EUR 34.9 billion sustainable mobility programme and USD 10 billion port modernisation investment, covering high-speed rail, freight corridors, and port capacity upgrades. This positions Italy as one of the fastest-growing national crane markets in Europe.
Mobile cranes are the fastest-growing segment in Europe by mobility, expanding at a 5.6% CAGR. Construction activity, offshore wind installation, and infrastructure maintenance drive their adoption. Operational flexibility and rapid repositioning make them the preferred choice for renewable energy construction and infrastructure renewal programmes.
Germany holds around 26.8% of the European crane market, anchored by its advanced industrial manufacturing sector, established crane production capacity, and sustained construction and port equipment demand. Infrastructure renewal and the energy transition sustain consistent crane procurement across German industrial and construction end-users.
Offshore wind expansion is generating structurally elevated demand for heavy-lift cranes across European coastal markets. Wind turbine installation is concentrating demand in Germany, the Netherlands, Denmark, and the United Kingdom. Palfinger's 42 offshore substation crane orders in 2025 illustrate the commercial scale of the energy transition for European crane suppliers.
Electrification is the defining technology trend in the European crane market. EU emissions regulations, port decarbonisation targets, and demand for lower operating costs are driving battery and hybrid crane adoption. Konecranes’ battery-electric RTG, Liebherr’s R&D investment, and Palfinger’s electric platforms signal an industry-wide transition toward zero-emission lifting.
The aftermarket channel is gaining strategic importance as operators prioritise total lifecycle cost management. Manufacturers are expanding service networks with remote monitoring and predictive maintenance. Konecranes and Liebherr are both growing aftermarket revenue per unit as operators extend asset lifecycles and reduce unplanned downtime.
The report of Expert Market Research's titled "Europe Crane Market Report and Forecast 2026-2035" offers a detailed analysis of the market based on the following segments:
Market Breakup by Mobility
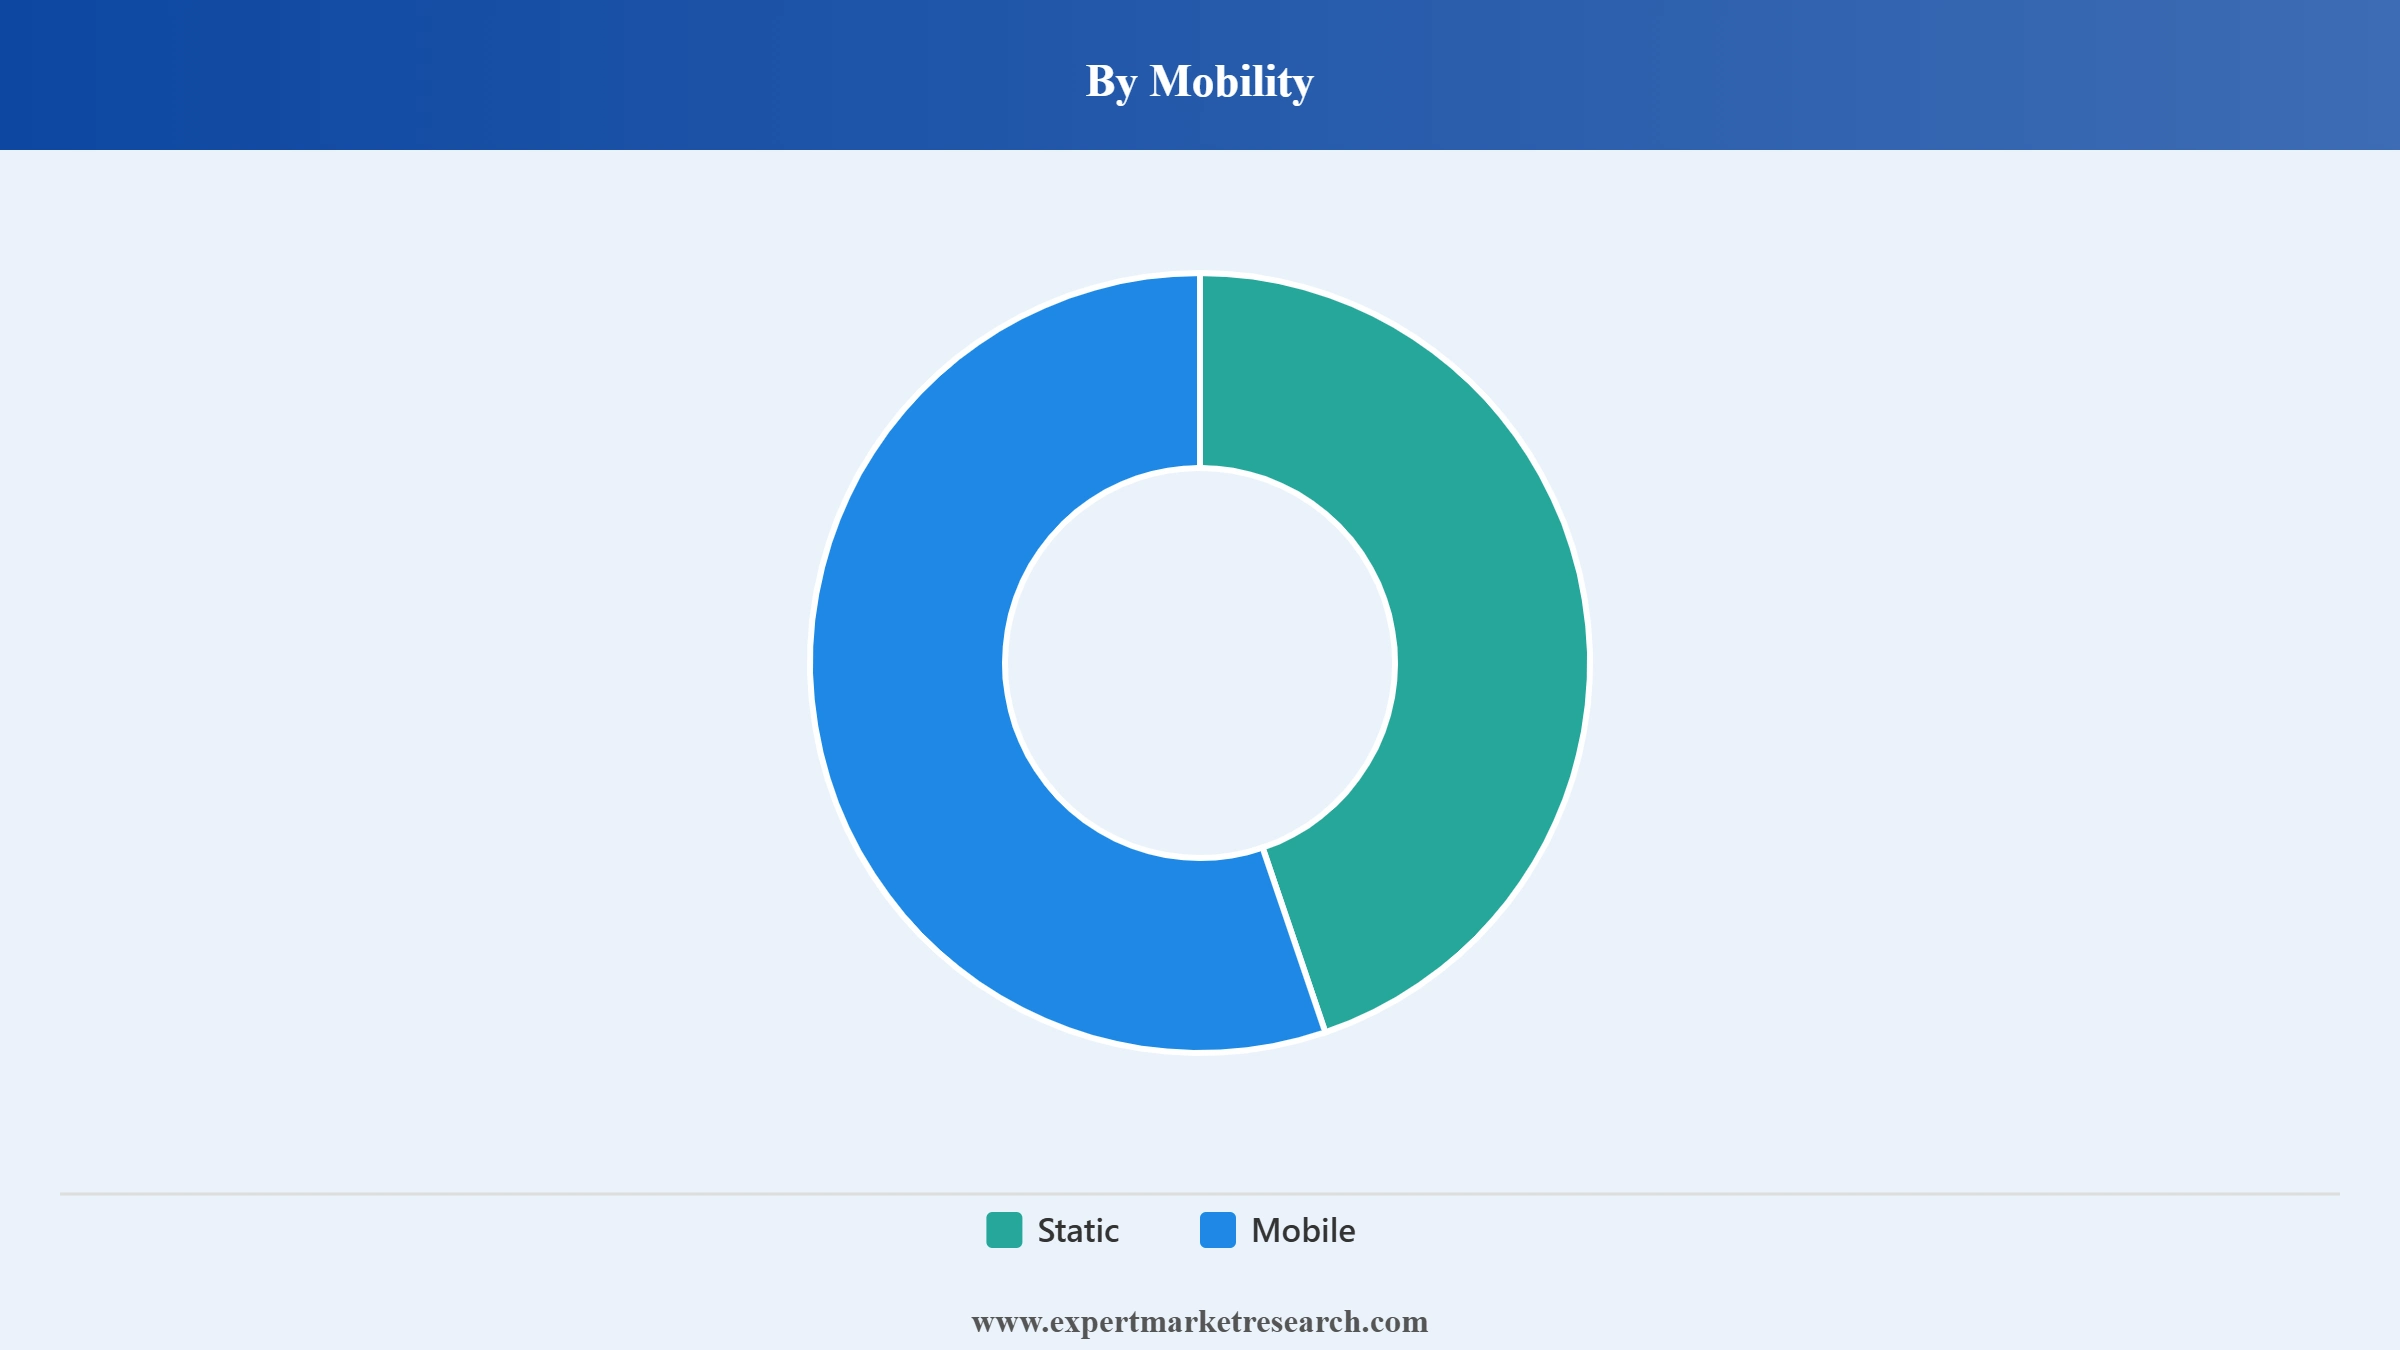
Key Insight: Static cranes lead by installed base across industrial and port facilities. Mobile cranes are the fastest-growing segment, driven by construction, wind energy installation, and infrastructure projects.
Market Breakup by Type
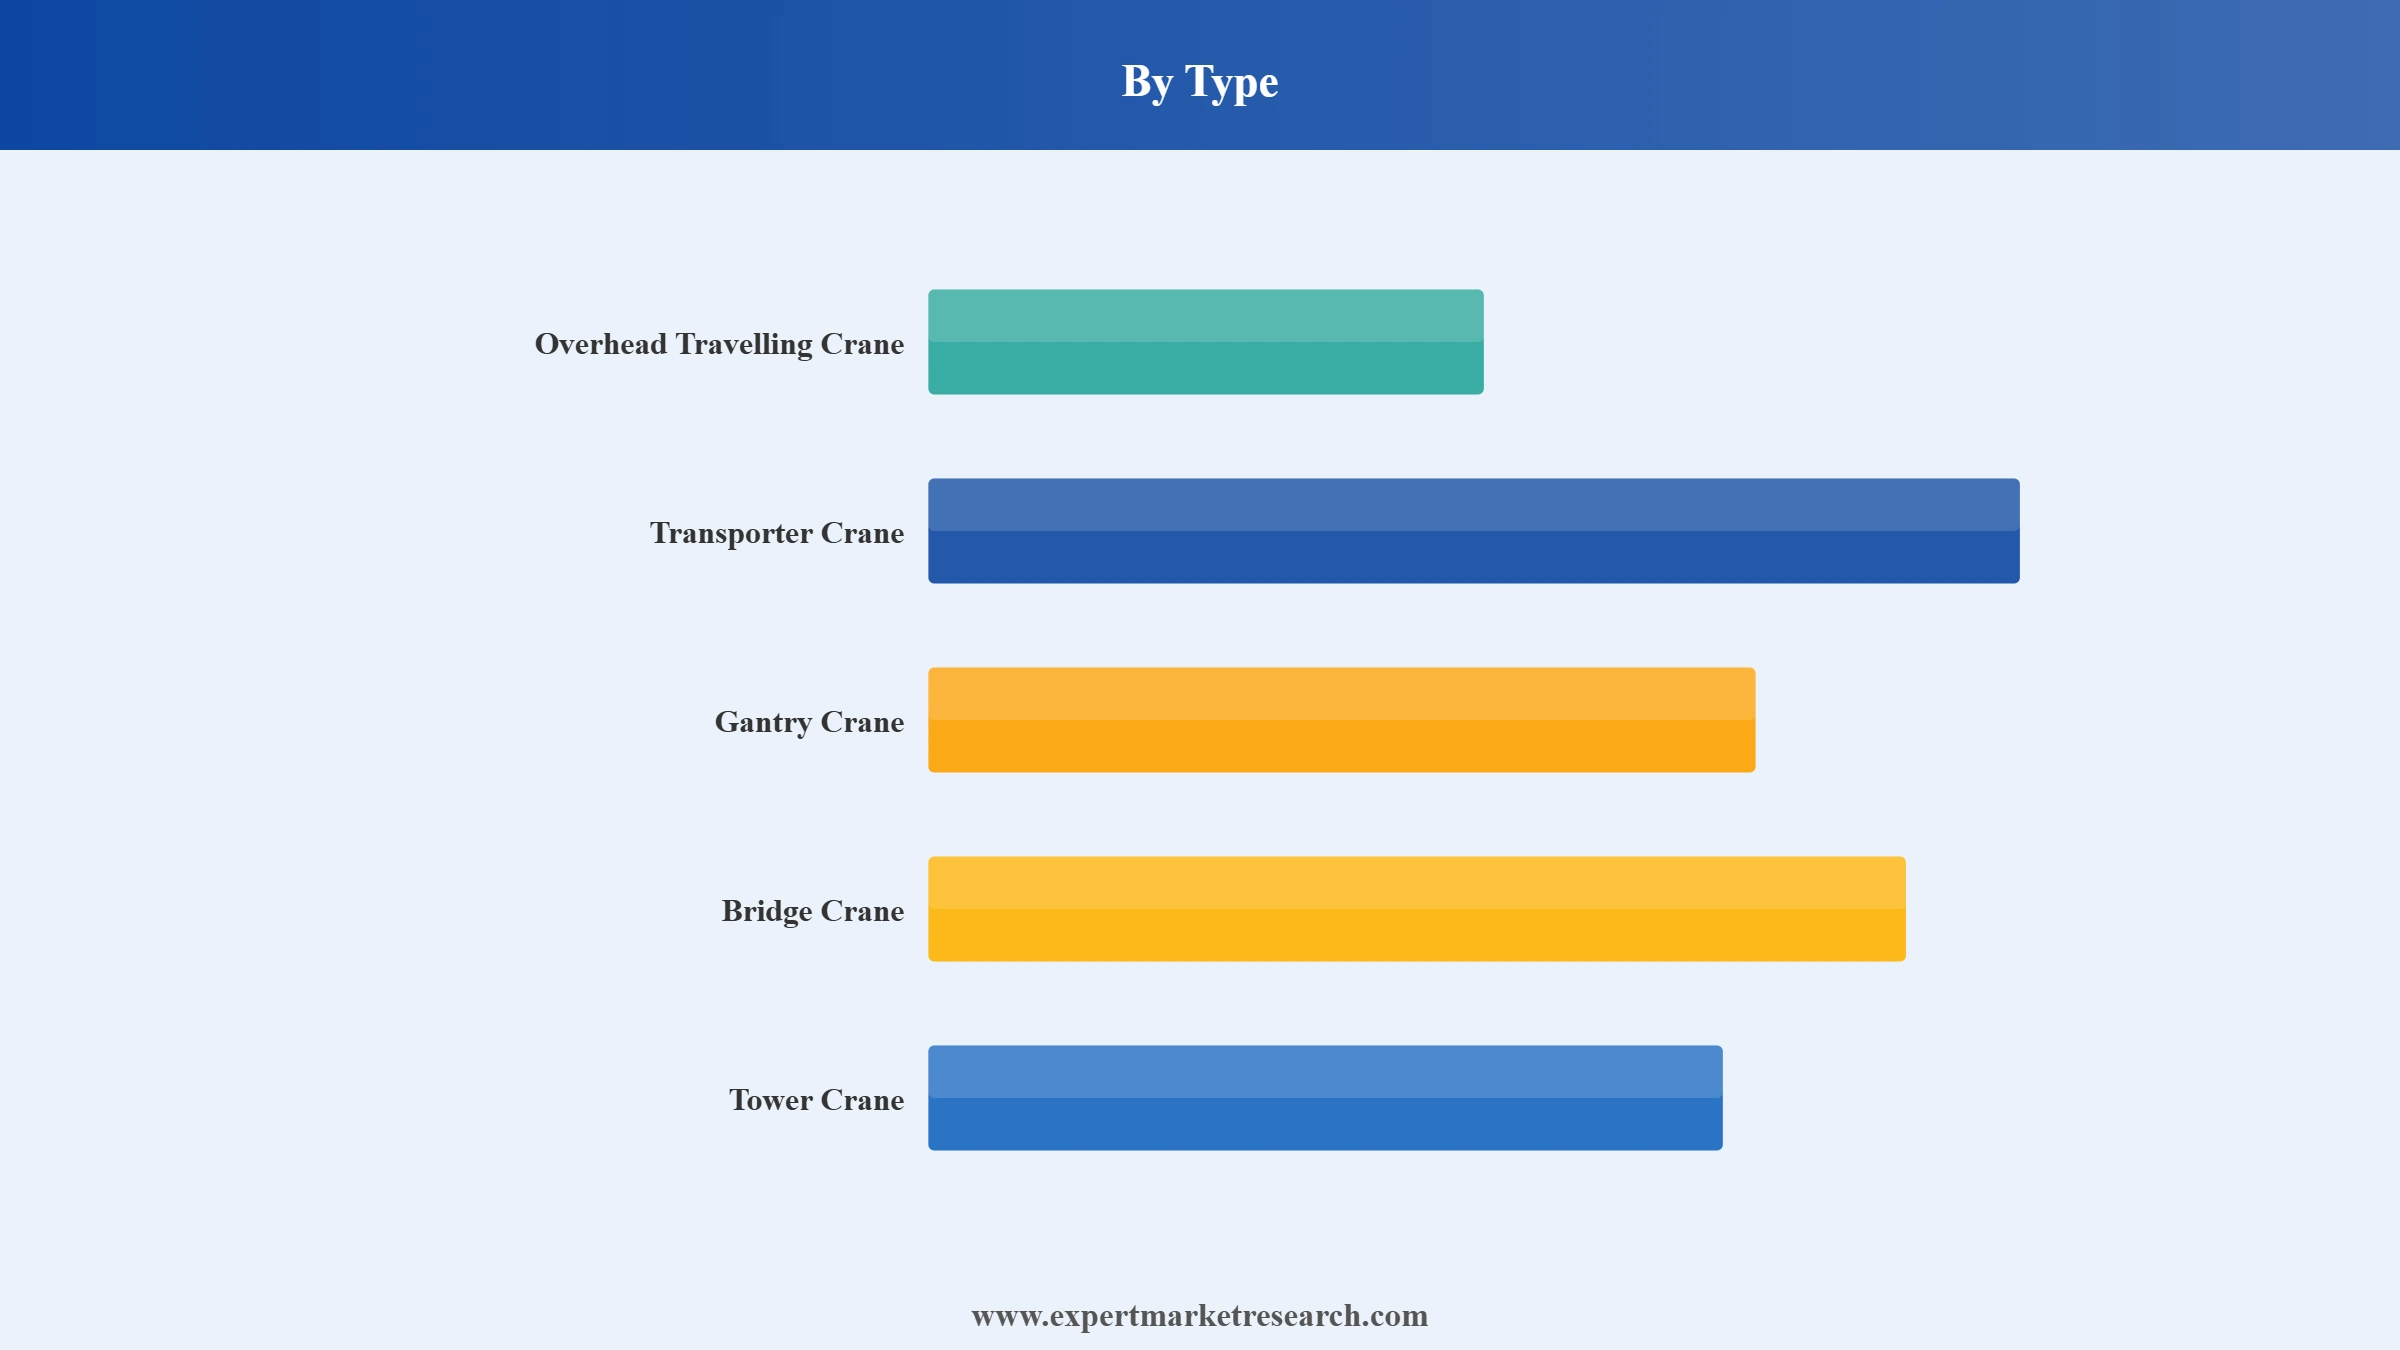
Key Insight: Overhead travelling and gantry cranes hold dominant shares through industrial manufacturing and port operations. Tower cranes are among the fastest-growing types, driven by urban construction and wind turbine installation.
Market Breakup by Sales Channel
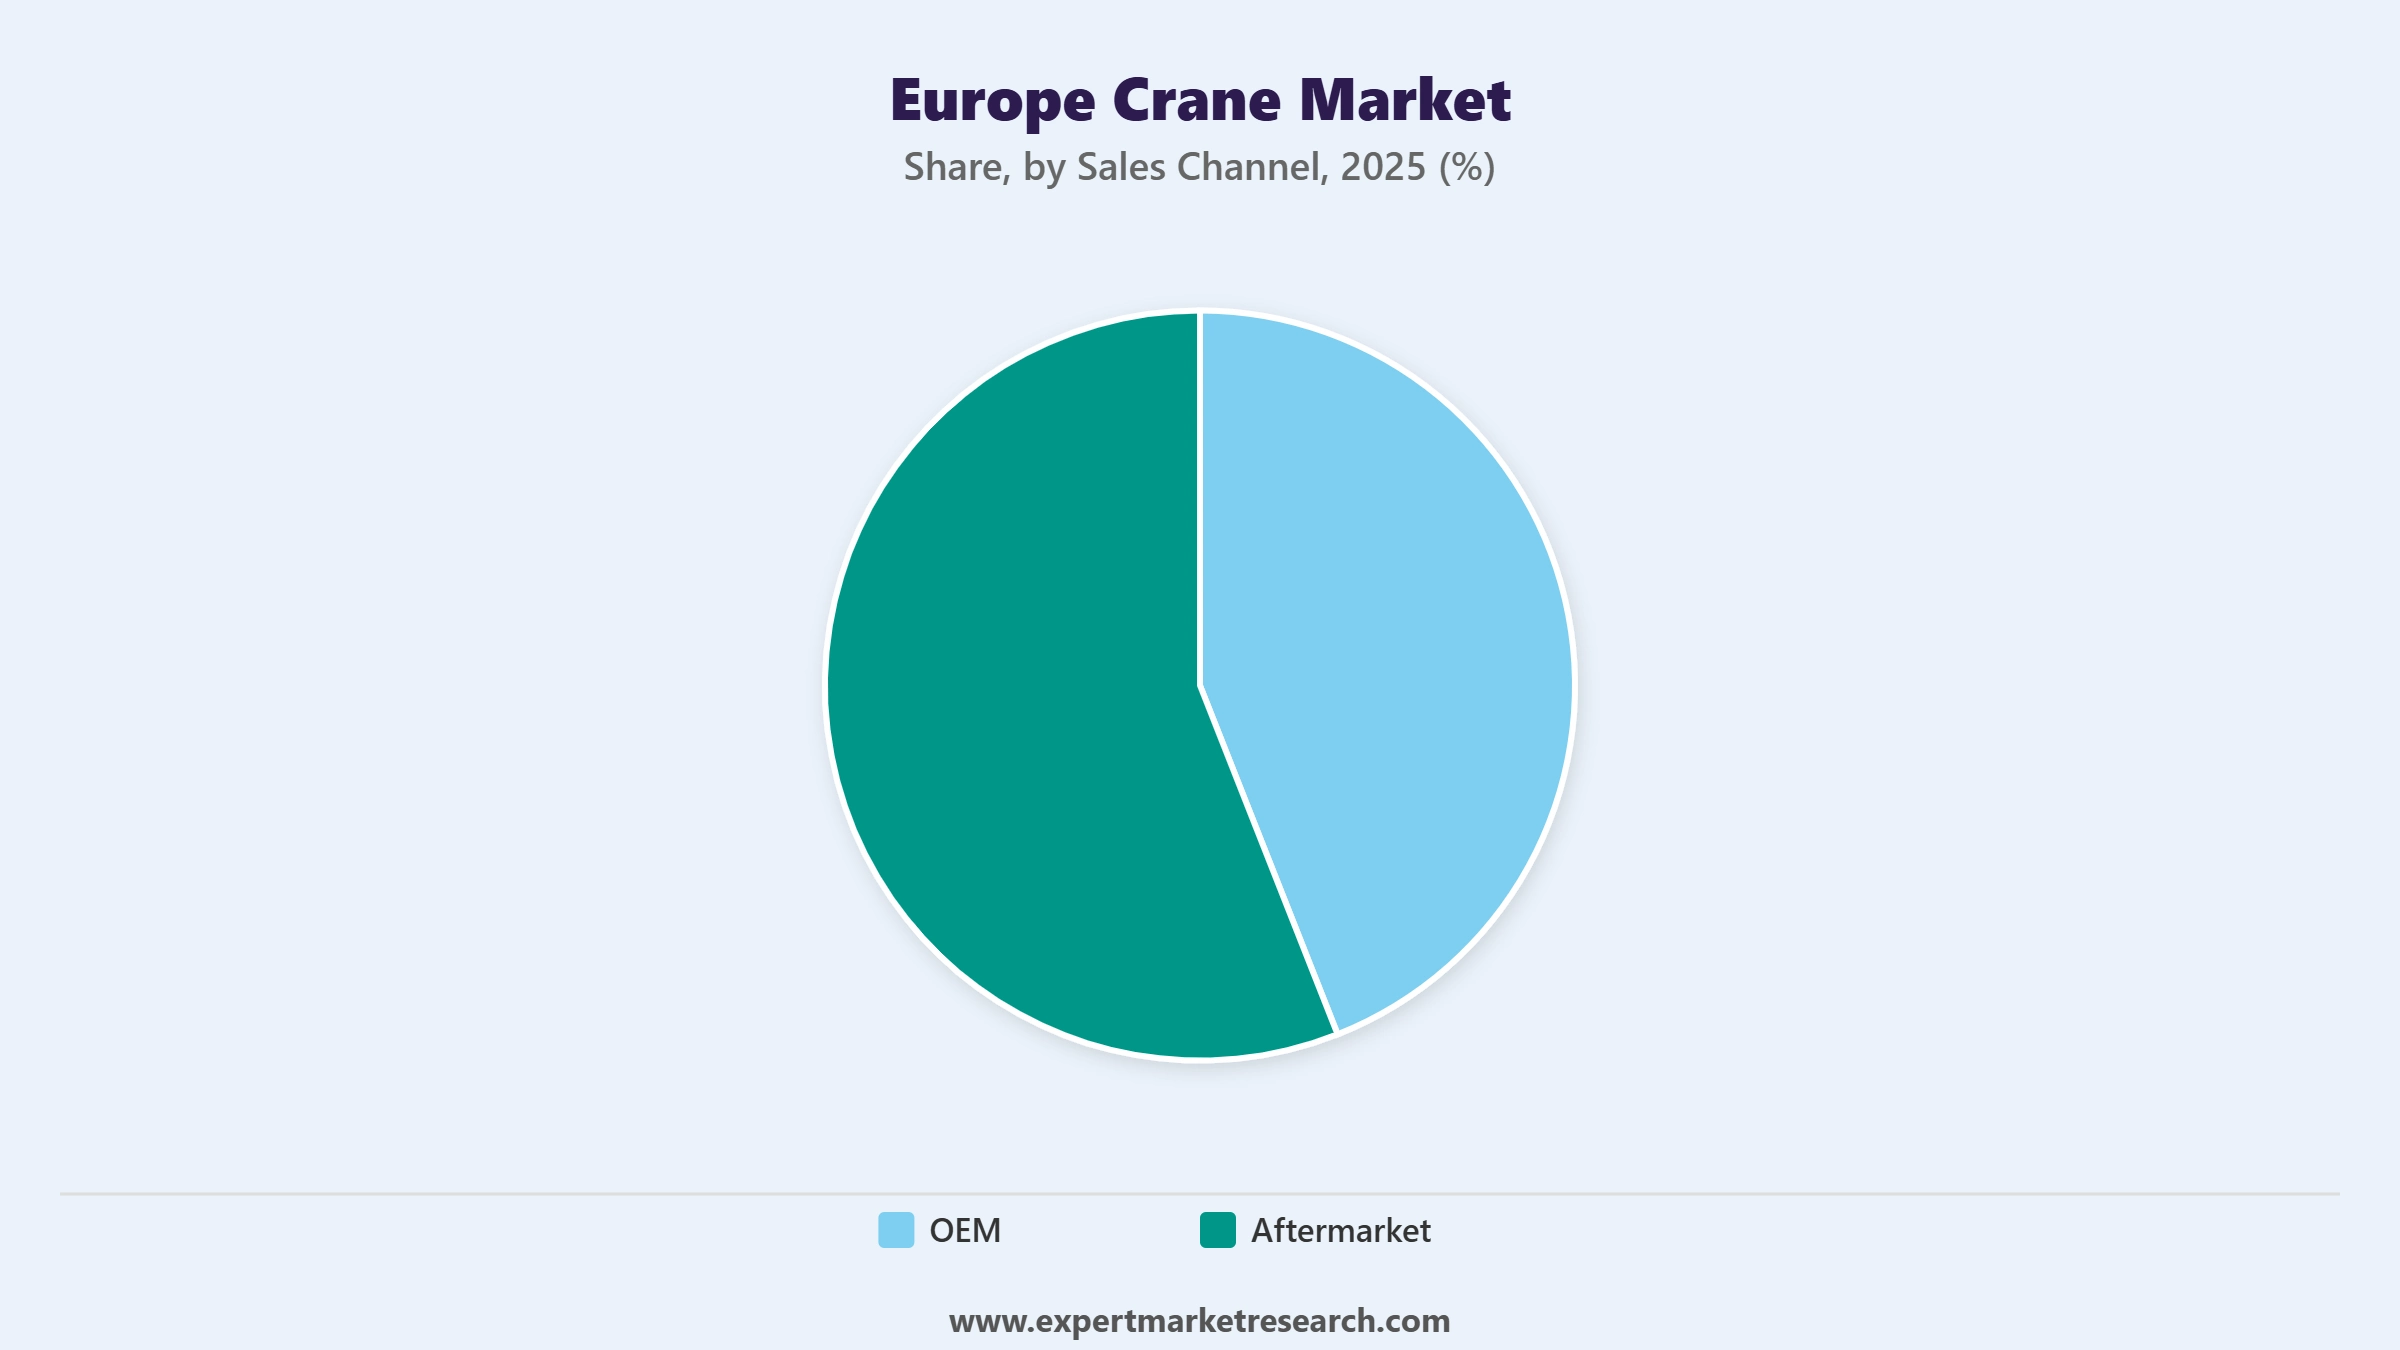
Key Insight: OEM sales lead through new equipment procurement from infrastructure and industrial programmes. The aftermarket channel is growing strategically as operators adopt predictive maintenance and digital service programmes to optimise fleet lifecycle costs.
Market Breakup by Country
Key Insight: Germany dominates with approximately 26.8% market share through its industrial base and domestic crane producers. Italy records strong growth from its EUR 34.9 billion sustainable mobility investment programme.
Read more about this report - REQUEST FREE SAMPLE COPY IN PDF
By Mobility, Static cranes hold the dominant share due to their critical role in industrial facilities, port operations, and manufacturing environments requiring permanent fixed lifting infrastructure
Static cranes command the largest installed base through their role in steel plants, automotive facilities, ports, and power generation sites. Overhead travelling cranes, gantry cranes, and bridge cranes anchor static crane demand across Europe's heavy industrial base.
Mobile cranes are the faster-growing segment, valued for operational flexibility across construction, wind energy installation, and infrastructure maintenance. Their ability to reposition rapidly across project sites makes them the preferred choice for Europe's expanding offshore wind and infrastructure renewal programmes.
Read more about this report - REQUEST FREE SAMPLE COPY IN PDF
By Type, Overhead Travelling Cranes hold the dominant share due to their widespread deployment across industrial manufacturing facilities and port operations throughout Europe
Overhead travelling cranes hold the largest type-level share, reflecting their role in Europe's heavy manufacturing industries including steel, automotive, shipbuilding, and aerospace. Germany and Central European industrial facilities provide a stable demand base for overhead crane procurement and aftermarket service.
Tower cranes are a key growth category driven by urban construction and wind turbine installation. Gantry and bridge cranes sustain steady demand through port and logistics investment. Transporter cranes serve specialist maritime and heavy industrial applications across the region.
Read more about this report - REQUEST FREE SAMPLE COPY IN PDF
By Sales Channel, OEM sales hold the dominant share due to new equipment procurement driven by infrastructure investment, fleet renewal, and electrification upgrade programmes across Europe
OEM sales lead through new equipment orders from construction contractors, port operators, and industrial facility owners investing in renewal and electrification upgrades. Infrastructure programmes across Germany, Italy, and the United Kingdom sustain OEM order pipelines through the forecast period.
The aftermarket channel is gaining share as operators extend asset lifecycles and adopt digital service programmes. Remote diagnostics, telematics, and predictive maintenance from Liebherr, Konecranes, and Palfinger are increasing aftermarket revenue per unit and deepening customer relationships.
Read more about this report - REQUEST FREE SAMPLE COPY IN PDF
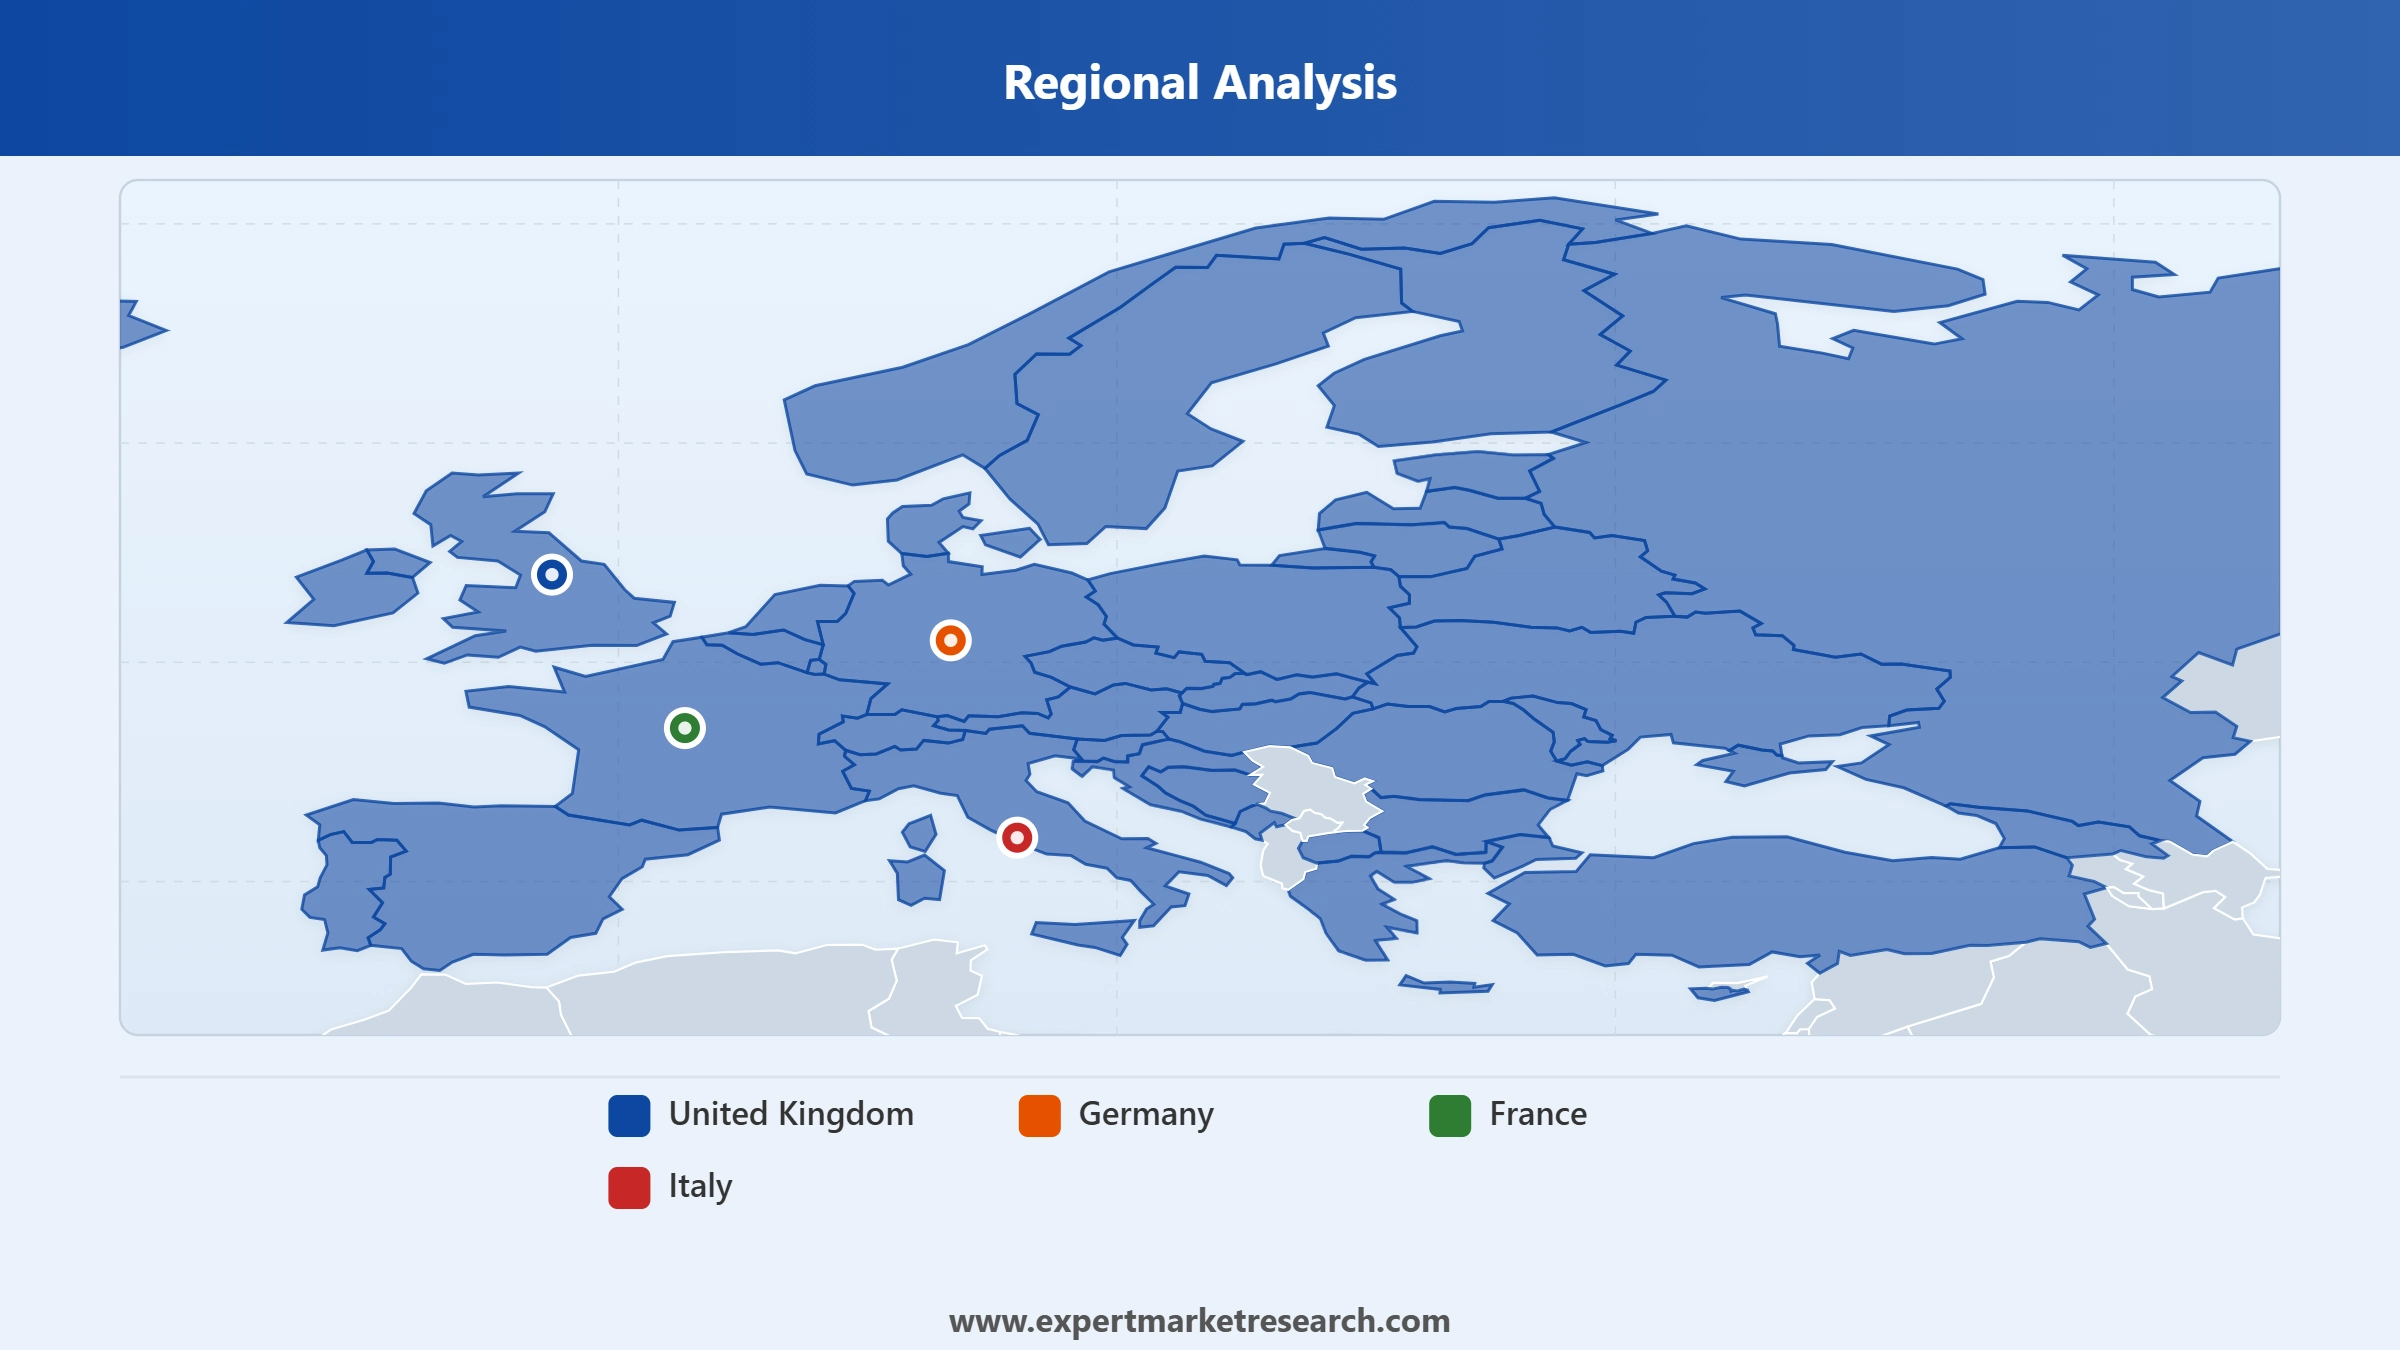
Germany dominates the Europe crane market due to its advanced industrial manufacturing base, established domestic crane production capacity, and sustained infrastructure investment across construction, ports, and energy sectors
Germany holds approximately 26.8% of the Europe crane market, underpinned by its dense heavy manufacturing sector, the global presence of Liebherr and other domestic producers, and consistent procurement by German construction, port, and industrial operators. Infrastructure renewal and energy transition investments sustain demand across both static and mobile crane segments.
Italy records strong growth from its EUR 34.9 billion sustainable mobility programme and USD 10 billion port modernisation investment. The United Kingdom maintains steady demand through infrastructure renewal and commercial construction. France contributes stable procurement from industrial maintenance and public infrastructure projects.
Read more about this report - REQUEST FREE SAMPLE COPY IN PDF
The Europe crane market is led by Liebherr, Konecranes, Terex, Fassi Gru, Tadano, and Palfinger. Competitive advantage is built on product range breadth, aftermarket service depth, electrification and automation leadership, and long-term relationships with construction, industrial, and port operators.
Founded in 1949 and headquartered in Bulle, Switzerland, Liebherr is one of Europe's largest construction equipment manufacturers. It generated EUR 14.042 billion in revenue in 2023 and reinvested EUR 634 million into R&D focused on autonomous and electric crane systems. Liebherr's portfolio spans tower cranes, mobile cranes, maritime cranes, and crawler cranes across a significant European manufacturing footprint.
Founded in 1994 and headquartered in Hyvinkaa, Finland, Konecranes is a global lifting equipment and service company. At TOC Europe in June 2025, it launched its E-Hybrid RTG crane and electric empty container handler. In Q4 2025, Konecranes secured Europe's first battery-electric RTG order for the Port of Muuga, with delivery scheduled for Q4 2026, marking a milestone in European port crane electrification.
Founded in 1933 and headquartered in Norwalk, Connecticut, Terex is a global manufacturer of lifting and material processing equipment with European operations spanning mobile cranes, tower cranes, and construction equipment, supported by an expanded service network across Eastern Europe.
Founded in 1969 and headquartered in Albino, Italy, Fassi Gru is one of Europe's leading hydraulic truck-mounted crane manufacturers. Its range spans light-duty loader cranes to heavy knuckle boom and fly-jib configurations, serving transport, construction, and utility sectors through a global dealer network with strong presence in Italy, Germany, and Iberia.
Other key players in the market are The Manitowoc Company Inc., Gorbel Inc., Buckner Heavylift Cranes LLC, Palfinger AG, Tadano Ltd., Broderson Manufacturing Corp., and others.
*Please note that this is only a partial list; the complete list of key players is available in the full report. Additionally, the list of key players can be customized to better suit your needs.*
Our comprehensive Europe crane market report for 2026-2035 covers equipment demand by mobility, type, and channel, country-level analysis, and competitive intelligence. Whether planning a product expansion, assessing aftermarket opportunities, or evaluating infrastructure demand, this report gives you the clarity to act. Reach out to our team to access the complete report or request a customised version.
Upto 15% Off
USD
$2499 $2249
$3999 $3599
$4999 $4249
$5999 $5099


*While we strive to always give you current and accurate information, the numbers depicted on the website are indicative and may differ from the actual numbers in the main report. At Expert Market Research, we aim to bring you the latest insights and trends in the market. Using our analyses and forecasts, stakeholders can understand the market dynamics, navigate challenges, and capitalize on opportunities to make data-driven strategic decisions.*
The market reached nearly USD 14.01 Billion in 2025.
The market is projected to grow at a CAGR of 3.80% between 2026 and 2035.
The market is assessed to witness healthy growth in the forecast period to reach around USD 20.34 Billion in 2035.
The different types of cranes in the market are overhead travelling crane, transporter crane, gantry crane, bridge crane, and tower crane, among others.
The different segments based on mobility of crane considered in the market report include static and mobile.
The different sales channels of cranes in the market are OEM and aftermarket.
The different countries covered in the market report are the United Kingdom, Germany, France, and Italy, among others.
The key market players are Liebherr Group GmbH, Konecranes Plc, Terex Corporation, Fassi Gru S.p.A., The Manitowoc Company Inc., Gorbel Inc., Buckner Heavylift Cranes, LLC, Palfinger AG, Tadano Ltd., and Broderson Manufacturing Corp., among others.
Explore our key highlights of the report and gain a concise overview of key findings, trends, and actionable insights that will empower your strategic decisions.
| REPORT FEATURES | DETAILS |
| Base Year | 2025 |
| Historical Period | 2019-2025 |
| Forecast Period | 2026-2035 |
| Scope of the Report |
Historical and Forecast Trends, Industry Drivers and Constraints, Historical and Forecast Market Analysis by Segment:
|
| Breakup by Mobility |
|
| Breakup by Type |
|
| Breakup by Sales Channel |
|
| Breakup by Region |
|
| Market Dynamics |
|
| Competitive Landscape |
|
| Companies Covered |
|
Datasheet
One User
USD 2,499
USD 2,249
tax inclusive*
Single User License
One User
USD 3,999
USD 3,599
tax inclusive*
Five User License
Five User
USD 4,999
USD 4,249
tax inclusive*
Corporate License
Unlimited Users
USD 5,999
USD 5,099
tax inclusive*
*Please note that the prices mentioned below are starting prices for each bundle type. Kindly contact our team for further details.*
Flash Bundle
Small Business Bundle
Growth Bundle
Enterprise Bundle
*Please note that the prices mentioned below are starting prices for each bundle type. Kindly contact our team for further details.*
Flash Bundle
Number of Reports: 3
20%
tax inclusive*
Small Business Bundle
Number of Reports: 5
25%
tax inclusive*
Growth Bundle
Number of Reports: 8
30%
tax inclusive*
Enterprise Bundle
Number of Reports: 10
35%
tax inclusive*
How To Order

Select License Type
Choose the right license for your needs and access rights.

Click on ‘Buy Now’
Add the report to your cart with one click and proceed to register.

Select Mode of Payment
Choose a payment option for a secure checkout. You will be redirected accordingly.
Strategic Solutions for Informed Decision-Making
Gain insights to stay ahead and seize opportunities.

Get insights & trends for a competitive edge.

Track prices with detailed trend reports.

Analyse trade data for supply chain insights.

Leverage cost reports for smart savings

Enhance supply chain with partnerships.

Connect For More Information
Our expert team of analysts will offer full support and resolve any queries regarding the report, before and after the purchase.
Our expert team of analysts will offer full support and resolve any queries regarding the report, before and after the purchase.
We employ meticulous research methods, blending advanced analytics and expert insights to deliver accurate, actionable industry intelligence, staying ahead of competitors.
Our skilled analysts offer unparalleled competitive advantage with detailed insights on current and emerging markets, ensuring your strategic edge.
We offer an in-depth yet simplified presentation of industry insights and analysis to meet your specific requirements effectively.


