

Consumer Insights
Uncover trends and behaviors shaping consumer choices today
Procurement Insights
Optimize your sourcing strategy with key market data
Industry Stats
Stay ahead with the latest trends and market analysis.
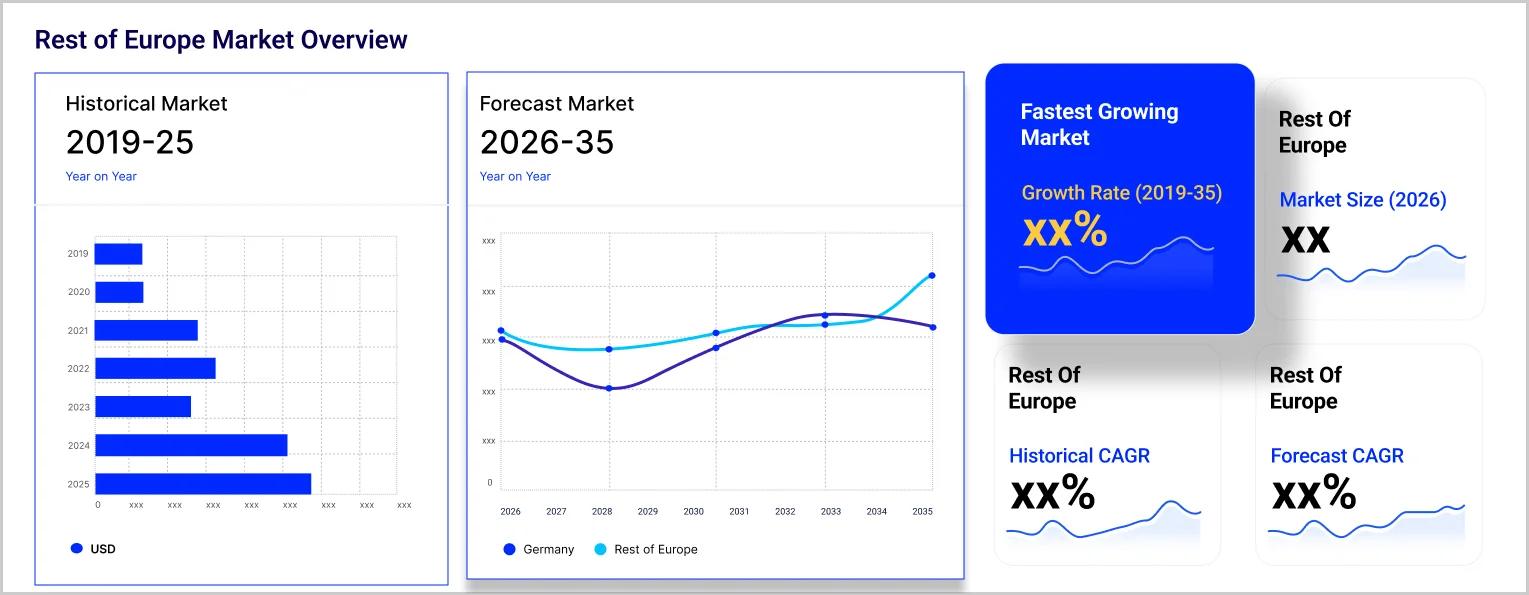
The Europe electric bus market size was approximately USD 2.64 Billion in 2025. The market is assessed to grow at a CAGR of 18.50% between 2026 and 2035, reaching a value of around USD 14.41 Billion by 2035.
Compound Annual Growth Rate
18.5%
Value in USD Billion
2026-2035
Read more about this report - REQUEST FREE SAMPLE COPY IN PDF
Electric buses refer to vehicles that use electric motors to generate mechanical energy. They reduce local and global emissions and boast lower operating costs than their conventional counterparts. Several countries worldwide are adopting electric mobility solutions, including electric buses, to reduce emissions from the transportation sector.
Electric buses can cut pollutants and lower the level of carbon emissions, thereby improving the quality of air and life. A conventional vehicle with an internal combustion engine, on average, produces 1.3kg CO2 per km travelled, whereas an electric bus produces none.
The EMR’s report titled “Europe Electric Bus Market Report and Forecast 2026-2035” offers a detailed analysis of the market based on the following segments:
Breakup by Propulsion Type
Breakup by Length
Breakup by Battery Type
Breakup by Range
Breakup by Battery Capacity
Breakup by End User
Breakup by Region
Read more about this report - REQUEST FREE SAMPLE COPY IN PDF
The comprehensive EMR report provides an in-depth assessment of the market based on the Porter's five forces model along with giving a SWOT analysis. The report gives a detailed analysis of the following key players in the Europe electric bus market, covering their competitive landscape and the latest developments like mergers, acquisitions, investments, and expansion plans.
AB Volvo was established in 1927 and is headquartered in Gothenburg, Sweden. It is a multinational manufacturing corporation that deals in the production and distribution of trucks, buses, construction equipment, and power solutions for marine and industrial applications.
Xiamen Golden Dragon Bus Co., LTD was founded in 1992 and is a joint venture company which is headquartered in Xiamen, China. It specialises in developing, manufacturing, and selling luxury buses and light vans in medium to large sizes. Its products include Intour electric bus, Astar, Polestar electric bus, and E12 electric bus series, among others.
BYD Europe B.V. was founded in 1998 and is a pioneer in battery technology. The leading European e-bus manufacturer aims to transform the global transportation sector through electrification. It offers a wide range of electric buses, including BYD eBus B11, BYD eBus B13, and BYD eBUS B15, among others.
*Please note that this is only a partial list; the complete list of key players is available in the full report. Additionally, the list of key players can be customized to better suit your needs.*
Other Europe electric bus market players include Yutong Bus Co., Ltd., Daimler Truck AG, IVECO S.p.A, Solaris Bus & Coach sp. z o.o., Traton SE, Karsan Otomotiv San. ve Tic. A.S, TAM-Europe d.o.o., and others.
Upto 15% Off
USD
$3999 $3599
$2499 $2249
$4999 $4249
$5999 $5099


*While we strive to always give you current and accurate information, the numbers depicted on the website are indicative and may differ from the actual numbers in the main report. At Expert Market Research, we aim to bring you the latest insights and trends in the market. Using our analyses and forecasts, stakeholders can understand the market dynamics, navigate challenges, and capitalize on opportunities to make data-driven strategic decisions.*
In 2025, the market reached an approximate value of USD 2.64 Billion.
The market is estimated to grow at a CAGR of 18.50% between 2026 and 2035.
The market is estimated to witness a healthy growth in the forecast period of 2026-2035 to reach a value of around USD 14.41 Billion by 2035.
The market is being driven by the rapid urbanisation, evolving mobility patterns, and the introduction of government initiatives aimed at decarbonising the transportation sector.
The key trends aiding the market expansion are technological advancements and innovations and the rising adoption of fuel cell electric buses.
The major propulsion types of electric bus are battery electric bus, plug-in hybrid electric bus, and fuel cell electric bus.
The different battery types in the market are lithium-ion battery and nickel-metal hydride battery (NiMH), among others.
The major key players in the market are Yutong Bus Co., Ltd., Daimler Truck AG, IVECO S.p.A, Solaris Bus & Coach sp. z o.o., AB Volvo, Traton SE, Karsan Otomotiv San. ve Tic. A.S, Xiamen Golden Dragon Bus Co.,LTD, TAM-Europe d.o.o., and BYD Europe B.V., among others.
Explore our key highlights of the report and gain a concise overview of key findings, trends, and actionable insights that will empower your strategic decisions.
| REPORT FEATURES | DETAILS |
| Base Year | 2025 |
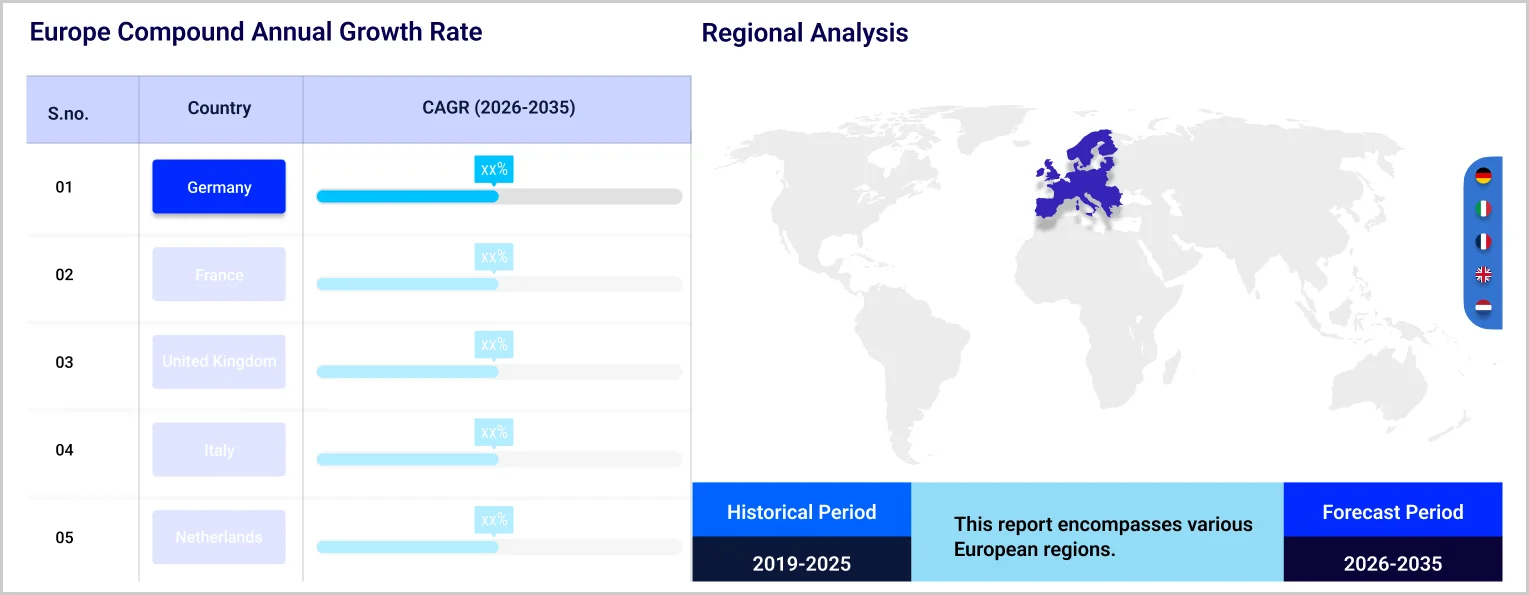
| Historical Period | 2019-2025 |
| Forecast Period | 2026-2035 |
| Scope of the Report |
Historical and Forecast Trends, Industry Drivers and Constraints, Historical and Forecast Market Analysis by Segment:
|
| Breakup by Propulsion Type |
|
| Breakup by Length |
|
| Breakup by Battery Type |
|
| Breakup by Range |
|
| Breakup by Battery Capacity |
|
| Breakup by End User |
|
| Breakup by Region |
|
| Market Dynamics |
|
| Competitive Landscape |
|
| Companies Covered |
|
Single User License
One User
USD 3,999
USD 3,599
tax inclusive*
Datasheet
One User
USD 2,499
USD 2,249
tax inclusive*
Five User License
Five User
USD 4,999
USD 4,249
tax inclusive*
Corporate License
Unlimited Users
USD 5,999
USD 5,099
tax inclusive*
*Please note that the prices mentioned below are starting prices for each bundle type. Kindly contact our team for further details.*
Flash Bundle
Small Business Bundle
Growth Bundle
Enterprise Bundle
*Please note that the prices mentioned below are starting prices for each bundle type. Kindly contact our team for further details.*
Flash Bundle
Number of Reports: 3
20%
tax inclusive*
Small Business Bundle
Number of Reports: 5
25%
tax inclusive*
Growth Bundle
Number of Reports: 8
30%
tax inclusive*
Enterprise Bundle
Number of Reports: 10
35%
tax inclusive*
How To Order

Select License Type
Choose the right license for your needs and access rights.

Click on ‘Buy Now’
Add the report to your cart with one click and proceed to register.

Select Mode of Payment
Choose a payment option for a secure checkout. You will be redirected accordingly.
Strategic Solutions for Informed Decision-Making
Gain insights to stay ahead and seize opportunities.

Get insights & trends for a competitive edge.

Track prices with detailed trend reports.

Analyse trade data for supply chain insights.

Leverage cost reports for smart savings

Enhance supply chain with partnerships.

Connect For More Information
Our expert team of analysts will offer full support and resolve any queries regarding the report, before and after the purchase.
Our expert team of analysts will offer full support and resolve any queries regarding the report, before and after the purchase.
We employ meticulous research methods, blending advanced analytics and expert insights to deliver accurate, actionable industry intelligence, staying ahead of competitors.
Our skilled analysts offer unparalleled competitive advantage with detailed insights on current and emerging markets, ensuring your strategic edge.
We offer an in-depth yet simplified presentation of industry insights and analysis to meet your specific requirements effectively.


