

Consumer Insights
Uncover trends and behaviors shaping consumer choices today
Procurement Insights
Optimize your sourcing strategy with key market data
Industry Stats
Stay ahead with the latest trends and market analysis.

The graph database market attained a value of USD 2.58 Billion as of 2025 and is anticipated to grow at a CAGR of 23.50% during the forecast period of 2026 to 2035. The increasing need for big data analytics in real-time is fueling the market of graph databases. Companies are increasingly depending upon graph databases to identify intricate relationships within data, which accelerates decision-making and helps improve personalization, fraud detection, and network analysis across verticals. The market is thus expected to reach a value of nearly USD 21.30 Billion by 2035.
Base Year
Historical Period
Forecast Period
Graph databases are increasingly being used in AI and machine learning because they can represent relationships naturally. Their application in recommendation engines, fraud detection, and knowledge graphs is enabling organizations to manage complex, interconnected data much better than with traditional databases.
Graph databases are being increasingly used by enterprises to support customer analytics, network operations, and supply chain insights. They can query related data with high speed and flexibility, making them central to digital transformation plans, particularly in industries such as finance, telecom, and retail, thereby increasing the growth of the graph database market.
Graph databases experienced more than a 25% increase in popularity index from 2020 to 2023. One of the leading vendors, Neo4j, has exceeded 800 commercial customers worldwide, indicative of the increasing enterprise demand for relationship-centric data platforms.
Compound Annual Growth Rate
23.5%
Value in USD Billion
2026-2035
*this image is indicative*
| Global Graph Database Market Report Summary | Description | Value |
| Base Year | USD Billion | 2025 |
| Historical Period | USD Billion | 2019-2025 |
| Forecast Period | USD Billion | 2026-2035 |
| Market Size 2025 | USD Billion | 2.58 |
| Market Size 2035 | USD Billion | 21.30 |
| CAGR 2019-2025 | Percentage | XX% |
| CAGR 2026-2035 | Percentage | 23.50% |
| CAGR 2026-2035 - Market by Region | North America | 24.4% |
| CAGR 2026-2035 - Market by Country | USA | 24.5% |
| CAGR 2026-2035 - Market by Country | UK | 24.2% |
| CAGR 2026-2035 - Market by Component | Services | 25.2% |
| CAGR 2026-2035 - Market by Deployment Model | Cloud | 24.9% |
| Market Share by Country 2025 | Australia | 2.0% |
The market for graph databases is growing significantly because of the growing need for sophisticated data analytics and real-time relationship monitoring. A major driver is the growth in interconnected data within social networks, recommendation engines, and fraud detection systems. Graph databases enable the easy exploration of relationships between entities, which relational databases find difficult to do. For example, Facebook and LinkedIn have used graph databases to model user connections and deliver personalized content effectively, thereby boosting the growth of the graph database market.
Another driver is the increasing use of AI and machine learning, where graph databases assist in knowledge graph construction and context-aware analysis. Google, for instance, constructed its Knowledge Graph to improve search relevance and respond to user queries with greater accuracy. Likewise, e-commerce companies have enjoyed the use of graph databases to improve product recommendations and identify fraudulent transactions in a timely manner.
Finance, healthcare, and logistics companies have embraced this technology to increase operational flexibility, customer satisfaction, and data-driven insights. Through graph-based architectures, these firms have gained quicker query performance and more profound data insight, positioning them competitively in their respective markets.
Graph databases are evolving with AI integration, cloud-native services, industry-specific models, and user-friendly tools, enhancing accessibility and insights, thus shaping the graph database market dynamics and trends.
Graph databases are increasingly being combined with generative AI to improve contextual comprehension and semantic reasoning. The union allows for more precise and human-like responses in use cases such as chatbots, recommendation engines, and intelligent search, fueling wiser, real-time decision-making across various business verticals, thus pushing the growth of the graph database market.
Cloud-native graph database services are being introduced by vendors, simplifying deployment, scalability, and management for businesses. The solutions include elastic storage, automated patching, and cross-service integration to enable businesses to handle complex relationships between data without infrastructure burden, greatly reducing time-to-insight and driving wide-scale adoption across industries.
Personalized graph data models that are developed specifically for vertical industries—e.g., health care, financial services, supply chain—are getting popular. Models specific to particular industries simplify deployments and improve performance by preserving context that is native to each business domain, reducing adoption time, and increasing investments' returns in organizations adopting graph technology, thereby helping to create new trends in the graph database market.
To democratize graph database adoption, suppliers are adding easy-to-use visualization capabilities and low-code interfaces. These capabilities allow non-technical users to engage with data relationships, visually construct queries, and derive insights, broadening graph database use across more enterprise teams and enhancing cross-functional collaboration.
Organizations are increasingly using graph databases to identify sophisticated cybersecurity attacks. Graph databases, by correlating relationships between large networks, identify anomalies, follow intrusion pathways, and counter risks more effectively than conventional systems. This is gaining traction in finance, healthcare, and government sectors, thus shaping new trends in the graph database market.
Graph databases are increasingly being employed to optimize worldwide supply chains. They facilitate real-time monitoring of products, oversee supplier relationships, and anticipate disruptions through linked data points. The trend is gathering pace as firms look for intelligent logistics solutions due to global supply chain volatility and calls for higher transparency and efficiency.
Read more about this report - REQUEST FREE SAMPLE COPY IN PDF
The EMR’s report titled “Graph Database Market Report and Forecast 2026-2035” offers a detailed analysis of the market based on the following segments:
Market Breakup by Component
Market Breakup by Deployment Model
Market Breakup by Type of Database
Market Breakup by Analysis Segment
Market Breakup by Application
Market Breakup by Organisation Size
Market Breakup by Industry Vertical
Market Breakup by Region


| CAGR 2026-2035 - Market by | Country |
| USA | 24.5% |
| UK | 24.2% |
| Germany | 23.9% |
| China | 23.7% |
| Saudi Arabia | 22.8% |
| Canada | XX% |
| France | XX% |
| Italy | XX% |
| Japan | XX% |
| India | XX% |
| Australia | XX% |
| Brazil | XX% |
| Mexico | 22.2% |
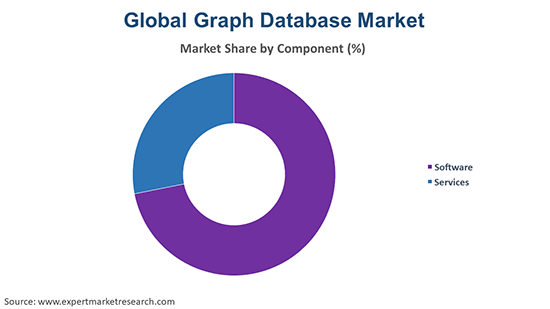
The market for graph database software is gaining traction as businesses implement advanced analytics, AI, and machine learning for data-driven decision-making. As per the graph database market analysis, the tools provide quicker data extraction and enhanced relationship mapping between related datasets. Firms are incorporating cloud-native, scalable, and elastic solutions, driving adoption in industries such as BFSI, healthcare, and retail.
According to the graph database industry analysis, implementation, support, and consulting services are also picking up steam as companies demand smooth deployment and upkeep of graph databases. With increasing data structure complexities, companies are looking toward service providers to customize and optimize. Training and managed services are particularly in high demand to secure long-term system performance and user competency in graph technology.
Leading graph database market players are emphasizing cloud-based graph solutions, GenAI workload support, and enhanced data visualization. Low-code platforms, developer tools, and self-service capabilities are seeing a high emphasis on expanding user adoption. Strategic partnerships and ongoing innovation in graph-powered AI and machine learning use cases are at the core of their initiatives in addressing enterprise needs across industries.
Oracle Corporation, founded in 1977 and having headquarters in Texas, United States, provides Oracle Spatial and Graph. It is capable of supporting property graphs and RDF data models, allowing users to execute sophisticated graph analytics in Oracle Database. It is broadly utilized in fraud prevention, social network analysis, and recommendation systems.
IBM Corporation, established in 1911 and headquartered in New York, United States, offers IBM Graph, a cloud-managed graph database service on IBM Cloud. It is Gremlin query language supported and allows real-time data processing, pattern detection, and relationship mapping in various industries such as finance, retail, and healthcare.
Amazon Web Services, Inc., founded in 2006 and based in Seattle, Washington, United States, provides Amazon Neptune, a graph database service that supports property graph and RDF models. It allows businesses to create knowledge and identity graphs, and fraud detection systems, with native integration throughout the AWS environment.
DataStax, Inc., which was established in 2010 and has its headquarters in California, USA, provides DataStax Enterprise Graph, which is built on Apache Cassandra. It supports TinkerPop Gremlin, and it drives real-time, scalable applications for logistics, customer experience, and recommendations through its high-availability and strong distributed architecture.
*Please note that this is only a partial list; the complete list of key players is available in the full report. Additionally, the list of key players can be customized to better suit your needs.*
Other key players profiled in the graph database market include Stardog Union, Inc., and Neo4j, Inc., among others.


Upto 35% Off
USD


*While we strive to always give you current and accurate information, the numbers depicted on the website are indicative and may differ from the actual numbers in the main report. At Expert Market Research, we aim to bring you the latest insights and trends in the market. Using our analyses and forecasts, stakeholders can understand the market dynamics, navigate challenges, and capitalize on opportunities to make data-driven strategic decisions.*
Get in touch with us for a customized solution tailored to your unique requirements and save upto 35%!
In 2025, the graph database market reached an approximate value of USD 2.58 Billion.
The market is assessed to grow at a CAGR of 23.50% between 2026 and 2035.
The market is estimated to witness healthy growth in the forecast period of 2026-2035 to reach a value of around USD 21.30 Billion by 2035.
The major drivers of the market include the growing demand for solutions that can process low-latency queries, upsurge in the penetration of connected data, rise in the need for better response time and accuracy, increasing adoption of cloud-based solutions, proliferation of Internet of Things (IoT), and investments in new technologies.
Real-time big data mining with visualisation of results and the increasing adoption of artificial intelligence (AI)-based graph database tools and services are the key trends propelling the growth of the market.
The major regions in the market are North America, Latin America, the Middle East and Africa, Europe, and the Asia Pacific.
The major components of graph database are software and services.
On-premises and cloud are the leading deployment models in the global graph database market.
The significant types of databases in the market are relational (SQL) and non-relational (NoSQL).
The major analysis segments in the market are path analysis, connectivity analysis, community analysis, and centrality analysis.
The leading applications of graph database in the market are fraud detection and risk management, master data management, customer analytics, identity and access management, recommendation engine, and privacy and risk compliance, among others.
The major organisation sizes considered in the market report are large enterprises and small and medium enterprises.
BFSI, retail and e-commerce, IT and telecom, identity and access management, healthcare and life science, government and public sector, media and entertainment, manufacturing, and transportation and logistics, among others, are the significant industry verticals in the market.
The major players in the market are Oracle Corporation, IBM Corporation, Amazon Web Services, Inc., DataStax, Inc., Stardog Union, Inc., and Neo4j, Inc., among others.
Explore our key highlights of the report and gain a concise overview of key findings, trends, and actionable insights that will empower your strategic decisions.
| REPORT FEATURES | DETAILS |
| Base Year | 2025 |
| Historical Period | 2019-2025 |
| Forecast Period | 2026-2035 |
| Scope of the Report |
Historical and Forecast Trends, Industry Drivers and Constraints, Historical and Forecast Market Analysis by Segment:
|
| Breakup by Component |
|
| Breakup by Deployment Model |
|
| Breakup by Type of Database |
|
| Breakup by Analysis |
|
| Breakup by Application |
|
| Breakup by Organisation Size |
|
| Breakup by Industry Vertical |
|
| Breakup by Region |
|
| Market Dynamics |
|
| Competitive Landscape |
|
| Companies Covered |
|
| Report Price and Purchase Option | Explore our purchase options that are best suited to your resources and industry needs. |
| Delivery Format | Delivered as an attached PDF and Excel through email, with an option of receiving an editable PPT, according to the purchase option. |
Datasheet
One User
USD 2,499
USD 2,249
tax inclusive*
Single User License
One User
USD 3,999
USD 3,599
tax inclusive*
Five User License
Five User
USD 4,999
USD 4,249
tax inclusive*
Corporate License
Unlimited Users
USD 5,999
USD 5,099
tax inclusive*
*Please note that the prices mentioned below are starting prices for each bundle type. Kindly contact our team for further details.*
Flash Bundle
Small Business Bundle
Growth Bundle
Enterprise Bundle
*Please note that the prices mentioned below are starting prices for each bundle type. Kindly contact our team for further details.*
Flash Bundle
Number of Reports: 3
20%
tax inclusive*
Small Business Bundle
Number of Reports: 5
25%
tax inclusive*
Growth Bundle
Number of Reports: 8
30%
tax inclusive*
Enterprise Bundle
Number of Reports: 10
35%
tax inclusive*
How To Order

Select License Type
Choose the right license for your needs and access rights.

Click on ‘Buy Now’
Add the report to your cart with one click and proceed to register.

Select Mode of Payment
Choose a payment option for a secure checkout. You will be redirected accordingly.
Gain insights to stay ahead and seize opportunities.

Get insights & trends for a competitive edge.

Track prices with detailed trend reports.

Analyse trade data for supply chain insights.

Leverage cost reports for smart savings

Enhance supply chain with partnerships.

Connect For More Information
Our expert team of analysts will offer full support and resolve any queries regarding the report, before and after the purchase.
Our expert team of analysts will offer full support and resolve any queries regarding the report, before and after the purchase.
We employ meticulous research methods, blending advanced analytics and expert insights to deliver accurate, actionable industry intelligence, staying ahead of competitors.
Our skilled analysts offer unparalleled competitive advantage with detailed insights on current and emerging markets, ensuring your strategic edge.
We offer an in-depth yet simplified presentation of industry insights and analysis to meet your specific requirements effectively.


Share