

Consumer Insights
Uncover trends and behaviors shaping consumer choices today
Procurement Insights
Optimize your sourcing strategy with key market data
Industry Stats
Stay ahead with the latest trends and market analysis.
The global industrial wax market size reached around USD 12.29 Billion in 2025. The market is projected to grow at a CAGR of 3.60% between 2026 and 2035 to reach nearly USD 17.50 Billion by 2035.
Compound Annual Growth Rate
3.6%
Value in USD Billion
2026-2035
| Global Industrial Wax Market Report Summary | Description | Value |
| Base Year | USD Billion | 2025 |
| Historical Period | USD Billion | 2019-2025 |
| Forecast Period | USD Billion | 2026-2035 |
| Market Size 2025 | USD Billion | 12.29 |
| Market Size 2035 | USD Billion | 17.50 |
| CAGR 2019-2025 | Percentage | XX% |
| CAGR 2026-2035 | Percentage | 3.60% |
| CAGR 2026-2035 - Market by Region | Asia Pacific | 4.2% |
| CAGR 2026-2035 - Market by Country | India | 4.8% |
| CAGR 2026-2035 - Market by Country | China | 3.9% |
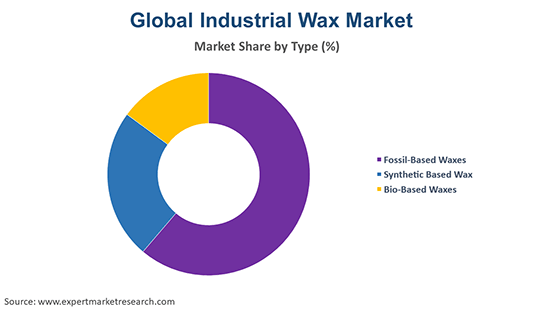
| CAGR 2026-2035 - Market by Type | Bio-Based Waxes | 4.0% |
| CAGR 2026-2035 - Market by Application | Candles | 4.1% |
| Market Share by Country 2025 | UK | 3.6% |
The Asia Pacific region accounts for the highest market share due to the rising consumption and production of products like coatings, candles, and packaging products.
Read more about this report - REQUEST FREE SAMPLE COPY IN PDF
The EMR’s report titled “Global Industrial Wax Market Report and Forecast 2026-2035” offers a detailed analysis of the market based on the following segments:
Market Breakup by Type
Market Breakup by Application
Market Breakup by Region


The personal care sector is seeing a significant growth due to the increased consumer demand. Industrial wax is used for the improvement of the viscosity and durability of these personal care products as well as cosmetic products. Thus, the rising demand for personal care products is significantly increasing the demand for industrial wax.
The growing demand for industrial applications has led to an increase in research and development activities. Scientists are also focusing on developing techniques to expand industrial wax applications. Industrial wax is being produced on 3D printers as an alternative to plastic.
| CAGR 2026-2035 - Market by | Country |
| India | 4.8% |
| China | 3.9% |
| USA | 3.2% |
| Germany | 3.0% |
| Australia | 2.8% |
| Canada | XX% |
| UK | XX% |
| France | 2.8% |
| Italy | XX% |
| Japan | XX% |
| Saudi Arabia | XX% |
| Brazil | XX% |
| Mexico | XX% |
The report presents a detailed analysis of the following key players in the global industrial wax market, looking into their capacity, market shares, and latest developments like capacity expansions, plant turnarounds, and mergers and acquisitions:
The EMR report gives an in-depth insight into the industrial wax market by providing a SWOT analysis as well as an analysis of Porter’s Five Forces models.
Upto 15% Off
USD
$2499 $2249
$3999 $3599
$4999 $4249
$5999 $5099


*While we strive to always give you current and accurate information, the numbers depicted on the website are indicative and may differ from the actual numbers in the main report. At Expert Market Research, we aim to bring you the latest insights and trends in the market. Using our analyses and forecasts, stakeholders can understand the market dynamics, navigate challenges, and capitalize on opportunities to make data-driven strategic decisions.*
In 2025, the market attained a value of nearly USD 12.29 Billion.
The market is assessed to grow at a CAGR of 3.60% between 2026 and 2035.
The market is estimated to witness a healthy growth in the forecast period of 2026-2035 to reach about USD 17.50 Billion by 2035.
The major market drivers include the rising consumption and production of products like coatings, candles, and packaging products, the robust growth of the personal care sector, and increasing research and development activities.
The key market trends include the development of innovative technologies to expand industrial wax applications, the surging use of industrial wax in food packaging applications, and the rising use of industrial wax to improve the durability of cosmetics products.
The major regions in the market are North America, Latin America, the Middle East and Africa, Europe, and the Asia Pacific.
The major types of industrial wax in the market are fossil based wax, synthetic based wax, and bio-based wax.
The significant applications of industrial wax include candles, packaging, coatings and polishes, hot melt adhesives, tyres and rubber, cosmetics and personal care, and food, among others.
The major market players include China Petroleum and Chemical Corporation, Royal Dutch Shell PLC, Exxon Mobil Corporation, Sasol Limited, Numaligarh Refinery Limited, Petroleo Brasilerio S.A., and NK Lukoil PAO, among others.
Explore our key highlights of the report and gain a concise overview of key findings, trends, and actionable insights that will empower your strategic decisions.
| REPORT FEATURES | DETAILS |
| Base Year | 2025 |
| Historical Period | 2019-2025 |
| Forecast Period | 2026-2035 |
| Scope of the Report |
Historical and Forecast Trends, Industry Drivers and Constraints, Historical and Forecast Market Analysis by Segment:
|
| Breakup by Type |
|
| Breakup by Application |
|
| Breakup by Region |
|
| Market Dynamics |
|
| Competitive Landscape |
|
| Companies Covered |
|
| Report Price and Purchase Option | Explore our purchase options that are best suited to your resources and industry needs. |
| Delivery Format | Delivered as an attached PDF and Excel through email, with an option of receiving an editable PPT, according to the purchase option. |
Datasheet
One User
USD 2,499
USD 2,249
tax inclusive*
Single User License
One User
USD 3,999
USD 3,599
tax inclusive*
Five User License
Five User
USD 4,999
USD 4,249
tax inclusive*
Corporate License
Unlimited Users
USD 5,999
USD 5,099
tax inclusive*
*Please note that the prices mentioned below are starting prices for each bundle type. Kindly contact our team for further details.*
Flash Bundle
Small Business Bundle
Growth Bundle
Enterprise Bundle
*Please note that the prices mentioned below are starting prices for each bundle type. Kindly contact our team for further details.*
Flash Bundle
Number of Reports: 3
20%
tax inclusive*
Small Business Bundle
Number of Reports: 5
25%
tax inclusive*
Growth Bundle
Number of Reports: 8
30%
tax inclusive*
Enterprise Bundle
Number of Reports: 10
35%
tax inclusive*
How To Order

Select License Type
Choose the right license for your needs and access rights.

Click on ‘Buy Now’
Add the report to your cart with one click and proceed to register.

Select Mode of Payment
Choose a payment option for a secure checkout. You will be redirected accordingly.
Strategic Solutions for Informed Decision-Making
Gain insights to stay ahead and seize opportunities.

Get insights & trends for a competitive edge.

Track prices with detailed trend reports.

Analyse trade data for supply chain insights.

Leverage cost reports for smart savings

Enhance supply chain with partnerships.

Connect For More Information
Our expert team of analysts will offer full support and resolve any queries regarding the report, before and after the purchase.
Our expert team of analysts will offer full support and resolve any queries regarding the report, before and after the purchase.
We employ meticulous research methods, blending advanced analytics and expert insights to deliver accurate, actionable industry intelligence, staying ahead of competitors.
Our skilled analysts offer unparalleled competitive advantage with detailed insights on current and emerging markets, ensuring your strategic edge.
We offer an in-depth yet simplified presentation of industry insights and analysis to meet your specific requirements effectively.


