

Consumer Insights
Uncover trends and behaviors shaping consumer choices today
Procurement Insights
Optimize your sourcing strategy with key market data
Industry Stats
Stay ahead with the latest trends and market analysis.
The global interactive display market reached a value of USD 19.58 Billion in 2025. The market is further expected to grow at a CAGR of 6.70% in the forecast period of 2026-2035 to reach a value of USD 37.45 Billion by 2035.
Compound Annual Growth Rate
6.7%
Value in USD Billion
2026-2035
Read more about this report - REQUEST FREE SAMPLE COPY IN PDF
The global market for interactive display is significantly supported by the growth of the industry in North America. The market growth in North America can be attributed to the high presence of providers of touch table solutions, along with a large number of restaurants using interactive or touch-enabled technology in regions such as Canada and the United States. In the current scenario, the United States controls a significant share of the North America market. A rapid adoption of touch tables has been seen in the education, corporate, retail, and government sectors of the United States.
The Asia Pacific is also anticipated to witness a robust growth in the forecast period. This growth is mainly attributed to a broad base of tech-savvy population and increased investment in digital classrooms. In addition, many technology companies sell touch tables in China, rendering the regional market an active participant in the overall market. The market in Europe is expected to see substantial growth in the coming years as a result of the growing deployment of these interactive screens in educational institutions.
Read more about this report - REQUEST FREE SAMPLE COPY IN PDF
An interactive display is a touchscreen display that could be used for various applications and activities. The data collected from the interaction between the user, and the device is processed and the output is generated. Interactive displays are also commonly used in both commercial and industrial sectors.
Breakup by Product
Breakup by Panel Type
Breakup by Panel Size
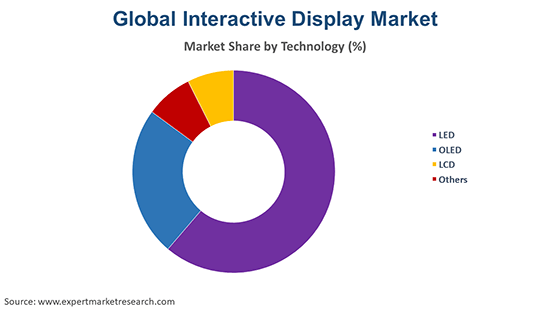
Breakup by Technology
Breakup by End Use
Breakup by Region


Read more about this report - REQUEST FREE SAMPLE COPY IN PDF
The growing use of interactive displays to alert customers about the timing of arrivals and departures, bookings, ticket prices, and the status of trains and flights at airports and railway stations is expected to further propel the growth of the market. The growing adoption of digital classrooms for active learning in universities and schools is expected to fuel the growth of the interactive display industry. Factors including internet penetration and changing technological preferences have had a positive effect on the acceptance of touch interface technologies, which is further aiding the growth of the interactive display industry.
In addition, the growing focus on gamification in the education system has fuelled the market growth. Gamification is considered to be an influential method that enhances the medium of teaching by integrating lessons in the form of games. It aids in developing cognitive skills and successful interactions in classrooms.
The report gives a detailed analysis of the following key players in the global interactive display market, covering their competitive landscape, capacity, and latest developments like mergers, acquisitions, and investments, expansions of capacity, and plant turnarounds:
The comprehensive EMR report provides an in-depth assessment of the market based on the Porter's five forces model along with giving a SWOT analysis.
Upto 15% Off
USD
$2499 $2249
$3999 $3599
$4999 $4249
$5999 $5099


*While we strive to always give you current and accurate information, the numbers depicted on the website are indicative and may differ from the actual numbers in the main report. At Expert Market Research, we aim to bring you the latest insights and trends in the market. Using our analyses and forecasts, stakeholders can understand the market dynamics, navigate challenges, and capitalize on opportunities to make data-driven strategic decisions.*
In 2025, the global interactive display market attained a value of USD 19.58 Billion.
The market is projected to grow at a CAGR of 6.70% between 2026 and 2035.
The market is estimated to witness a healthy growth in the forecast period of 2026-2035 to reach about USD 37.45 Billion by 2035.
The major market drivers include rapid urbanisation and industrialisation, increasing disposable incomes, the growing adoption of interactive displays in the education sector, and surging internet penetration.
The growing trend of gamification in the education sector, the rising use of interactive displays in airports and railway stations, technological advancements and innovations, and the rapid adoption of touch tablets are the key trends augmenting the market growth.
The major regions in the market are North America, Latin America, the Middle East and Africa, Europe, and the Asia Pacific.
The leading products of interactive display in the market are interactive video wall, interactive whiteboard, interactive table, interactive monitor, and interactive kiosk, among others.
The significant panel types of interactive display in the market are flexible, transparent, and flat.
The major panel sizes of interactive display in the market are 17–32”, 32–65”, and 65” and above.
The leading technology segments in the market are LED, OLED, and LCD, among others.
The significant end uses of interactive display include BFSI, healthcare, military and defence, education, retail, and transportation, among others.
The major players in the market are LG Electronics, Samsung Electronics Co., Ltd., NEC Corporation, Panasonic Corporation, ViewSonic Corporation, and Sharp Corporation, among others.
Explore our key highlights of the report and gain a concise overview of key findings, trends, and actionable insights that will empower your strategic decisions.
| REPORT FEATURES | DETAILS |
| Base Year | 2025 |
| Historical Period | 2019-2025 |
| Forecast Period | 2026-2035 |
| Scope of the Report |
Historical and Forecast Trends, Industry Drivers and Constraints, Historical and Forecast Market Analysis by Segment:
|
| Breakup by Product |
|
| Breakup by Panel Type |
|
| Breakup by Panel Size |
|
| Breakup by Technology |
|
| Breakup by End Use |
|
| Breakup by Region |
|
| Market Dynamics |
|
| Competitive Landscape |
|
| Companies Covered |
|
| Report Price and Purchase Option | Explore our purchase options that are best suited to your resources and industry needs. |
| Delivery Format | Delivered as an attached PDF and Excel through email, with an option of receiving an editable PPT, according to the purchase option. |
Datasheet
One User
USD 2,499
USD 2,249
tax inclusive*
Single User License
One User
USD 3,999
USD 3,599
tax inclusive*
Five User License
Five User
USD 4,999
USD 4,249
tax inclusive*
Corporate License
Unlimited Users
USD 5,999
USD 5,099
tax inclusive*
*Please note that the prices mentioned below are starting prices for each bundle type. Kindly contact our team for further details.*
Flash Bundle
Small Business Bundle
Growth Bundle
Enterprise Bundle
*Please note that the prices mentioned below are starting prices for each bundle type. Kindly contact our team for further details.*
Flash Bundle
Number of Reports: 3
20%
tax inclusive*
Small Business Bundle
Number of Reports: 5
25%
tax inclusive*
Growth Bundle
Number of Reports: 8
30%
tax inclusive*
Enterprise Bundle
Number of Reports: 10
35%
tax inclusive*
How To Order

Select License Type
Choose the right license for your needs and access rights.

Click on ‘Buy Now’
Add the report to your cart with one click and proceed to register.

Select Mode of Payment
Choose a payment option for a secure checkout. You will be redirected accordingly.
Strategic Solutions for Informed Decision-Making
Gain insights to stay ahead and seize opportunities.

Get insights & trends for a competitive edge.

Track prices with detailed trend reports.

Analyse trade data for supply chain insights.

Leverage cost reports for smart savings

Enhance supply chain with partnerships.

Connect For More Information
Our expert team of analysts will offer full support and resolve any queries regarding the report, before and after the purchase.
Our expert team of analysts will offer full support and resolve any queries regarding the report, before and after the purchase.
We employ meticulous research methods, blending advanced analytics and expert insights to deliver accurate, actionable industry intelligence, staying ahead of competitors.
Our skilled analysts offer unparalleled competitive advantage with detailed insights on current and emerging markets, ensuring your strategic edge.
We offer an in-depth yet simplified presentation of industry insights and analysis to meet your specific requirements effectively.


