

Consumer Insights
Uncover trends and behaviors shaping consumer choices today
Procurement Insights
Optimize your sourcing strategy with key market data
Industry Stats
Stay ahead with the latest trends and market analysis.
The global intraoperative imaging market size attained a value of USD 2.33 Billion in 2025. The market is likely to grow at a CAGR of 5.30% during the forecast period of 2026-2035 to attain a value of USD 3.91 Billion by 2035.
Compound Annual Growth Rate
5.3%
Value in USD Billion
2026-2035
The rising use of intraoperative imaging in orthopaedic and trauma surgeries is augmenting the growth of the market. As it is crucial to identify the most precise position of implants, C-arm systems are extensively deployed to view long bones and joints effectively to boost intraoperative assessment and healthcare quality. The market growth can also be attributed to the increasing innovations in C-arm systems to surge their functionality and precision. This is increasing the demand for C-arm systems that automates image quality to produce high-quality image for complex procedures. In addition, the development of innovative intraoperative C-arm systems that reduces radiation exposure is projected to drive the market for intraoperative imaging in the forecast period.
The market in North America is poised to witness lucrative growth due to the robust healthcare in the country. The rising adoption of innovative techniques in the healthcare industry in the United States and Canada is bolstering the market growth. Moreover, the rising prevalence of chronic illnesses such as cancer owing to the growing geriatric population in the region is leading to a surge in complex surgical procedures, hence increasing the demand for intraoperative imaging. The increasing cost-effectiveness of diagnostics in the region is also propelling the market growth, thereby significantly contributing to the overall market growth.


Intraoperative imaging refers to an imaging technique that provides enhanced image quality to provide information for the positioning and monitoring of instruments during surgical procedures. It boosts the decision-making ability of healthcare professionals and minimises the risk of reoperation. Intraoperative imaging enhances the imaging resolutions to boost post-implant evaluation and the recovery of patients.
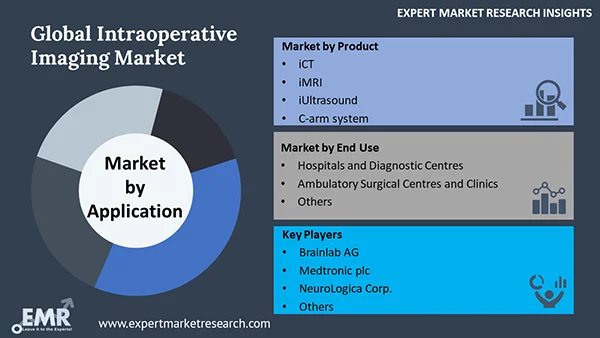
The major products of intraoperative imaging are:
The market can be broadly categorised on the basis of its application segments into:
Based on end use, the market is divided into:
Based on Region the market divided into:
Read more about this report - REQUEST FREE SAMPLE COPY IN PDF
The increasing use of intraoperative computed tomography (iCT) in surgical operations is propelling the market growth. As iCT produces a detailed anatomical image in operating rooms, it boosts decision-making process of surgeons and enables them to provide optimal healthcare. Moreover, iCT is extensively used in neurological surgeries to prevent complications in patients by enhancing surgeons’ precision during tissue removal. It also prevents the risk of hematoma by identifying critical bleeding areas while visualising changes to provide an accurate location of the problem. Hence, the growing prevalence of neurological diseases such as brain tumours and stroke, among others, is expected to bolster the demand for iCT, which is anticipated to augment the growth of the intraoperative imaging industry.
The integration of artificial intelligence (AI) in iCT is increasing the exposure of patients to harmful exposure, hence driving the market growth. Moreover, artificial intelligence enhances the diagnostics resolution and quality of images produced from iCT in low-dose screening to enable rapid and accurate interpretation by radiologists. The potential of artificial intelligence to harmonise image quality and bolster diagnostic accuracy while enhancing cost-effectiveness is predicted to provide further impetus to the market for intraoperative imaging in the forecast period.
The report presents a detailed analysis of the following key players in the global intraoperative imaging market, looking into their capacity, market shares, and latest developments like capacity expansions, plant turnarounds, and mergers and acquisitions:
The comprehensive report looks into the macro and micro aspects of the industry. The EMR report gives an in-depth insight into the market by providing a SWOT analysis as well as an analysis of Porter’s Five Forces model.
Upto 15% Off
USD
$3299 $2969
$5499 $4949
$6999 $5949
$8199 $6969


*While we strive to always give you current and accurate information, the numbers depicted on the website are indicative and may differ from the actual numbers in the main report. At Expert Market Research, we aim to bring you the latest insights and trends in the market. Using our analyses and forecasts, stakeholders can understand the market dynamics, navigate challenges, and capitalize on opportunities to make data-driven strategic decisions.*
The intraoperative market was valued at USD 2.33 Billion in 2025.
The market is expected to grow at a CAGR of 5.30% from 2026 to 2035 to reach a value of USD 3.91 Billion by 2035.
The market is being aided by the growing use of intraoperative imaging in orthopaedic and trauma surgeries, the increasing innovations in C-arm systems, and the rising adoption of innovative technologies in the healthcare industry.
The industry is predicted to be propelled by the growing use of intraoperative computed tomography (iCT) in surgeries, the rising demand for precise neurosurgical procedures, and the integration of artificial intelligence (AI) in iCT.
The major regions in the industry are North America, Latin America, the Middle East and Africa, Europe, and the Asia Pacific.
The major products of intraoperative imaging in the industry are iCT, iMRI, iUltrasound, and C-arm system.
The significant application segments in the market are neurosurgery, orthopaedic surgery, ENT surgery, oncology surgery, trauma surgery/ emergency room, and cardiovascular, among others.
The various end uses of intraoperative imaging are hospitals and diagnostic centres, ambulatory surgical centres and clinics, among others.
The major players in the industry are Brainlab AG, Medtronic plc, NeuroLogica Corp., Siemens Healthineers AG, and Koninklijke Philips N.V., among others.
Explore our key highlights of the report and gain a concise overview of key findings, trends, and actionable insights that will empower your strategic decisions.
| REPORT FEATURES | DETAILS |
| Base Year | 2025 |
| Historical Period | 2019-2025 |
| Forecast Period | 2026-2035 |
| Scope of the Report |
Historical and Forecast Trends, Industry Drivers and Constraints, Historical and Forecast Market Analysis by Segment:
|
| Breakup by Product |
|
| Breakup by Application |
|
| Breakup by End User |
|
| Breakup by Region |
|
| Market Dynamics |
|
| Supplier Landscape |
|
| Companies Covered |
|
Datasheet
One User
USD 3,299
USD 2,969
tax inclusive*
Single User License
One User
USD 5,499
USD 4,949
tax inclusive*
Five User License
Five User
USD 6,999
USD 5,949
tax inclusive*
Corporate License
Unlimited Users
USD 8,199
USD 6,969
tax inclusive*
*Please note that the prices mentioned below are starting prices for each bundle type. Kindly contact our team for further details.*
Flash Bundle
Small Business Bundle
Growth Bundle
Enterprise Bundle
*Please note that the prices mentioned below are starting prices for each bundle type. Kindly contact our team for further details.*
Flash Bundle
Number of Reports: 3
20%
tax inclusive*
Small Business Bundle
Number of Reports: 5
25%
tax inclusive*
Growth Bundle
Number of Reports: 8
30%
tax inclusive*
Enterprise Bundle
Number of Reports: 10
35%
tax inclusive*
How To Order

Select License Type
Choose the right license for your needs and access rights.

Click on ‘Buy Now’
Add the report to your cart with one click and proceed to register.

Select Mode of Payment
Choose a payment option for a secure checkout. You will be redirected accordingly.
Strategic Solutions for Informed Decision-Making
Gain insights to stay ahead and seize opportunities.

Get insights & trends for a competitive edge.

Track prices with detailed trend reports.

Analyse trade data for supply chain insights.

Leverage cost reports for smart savings

Enhance supply chain with partnerships.

Connect For More Information
Our expert team of analysts will offer full support and resolve any queries regarding the report, before and after the purchase.
Our expert team of analysts will offer full support and resolve any queries regarding the report, before and after the purchase.
We employ meticulous research methods, blending advanced analytics and expert insights to deliver accurate, actionable industry intelligence, staying ahead of competitors.
Our skilled analysts offer unparalleled competitive advantage with detailed insights on current and emerging markets, ensuring your strategic edge.
We offer an in-depth yet simplified presentation of industry insights and analysis to meet your specific requirements effectively.


